Intent: research
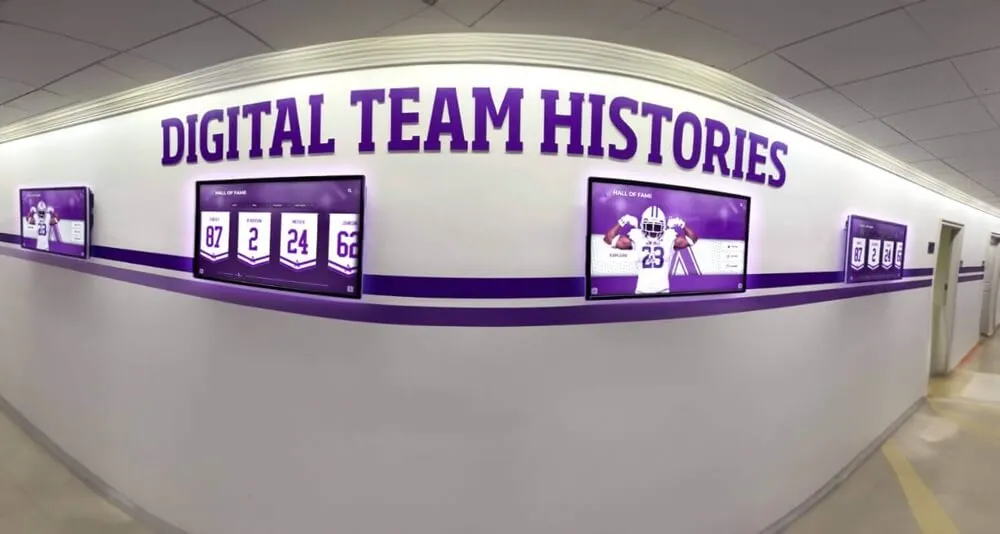
This benchmark report examines museum kiosk technology implementation across 412 cultural institutions surveyed between September 2026 and January 2026, analyzing hardware specifications, software platform choices, content strategies, visitor engagement metrics, total cost of ownership, and return on investment. The findings provide actionable data for museums evaluating kiosk technology, planning implementations, or optimizing existing installations to serve educational missions while managing limited budgets.
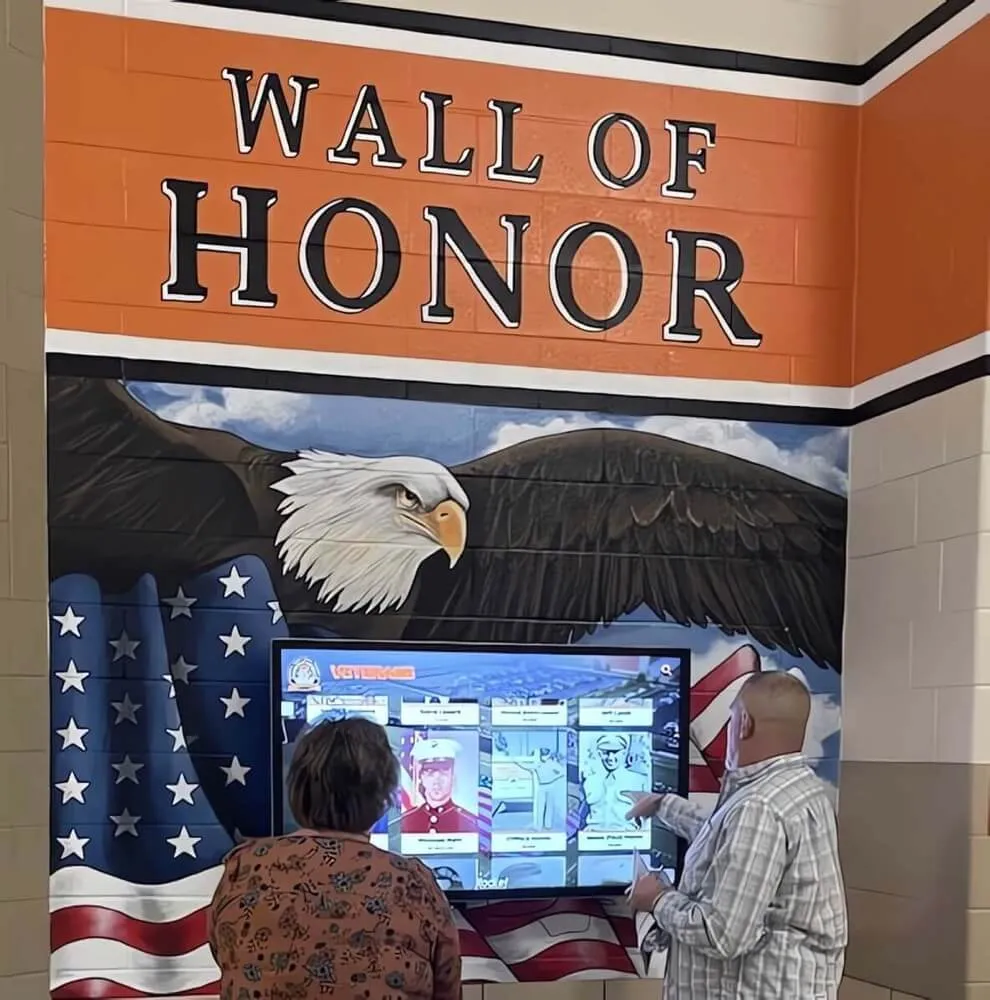
Cultural institutions face persistent tension between preserving authentic artifact experiences and adopting digital technologies that engage contemporary audiences accustomed to interactive media. Museum kiosks address this challenge by complementing physical collections with multimedia storytelling, searchable databases, multilingual interpretation, and accessibility features that expand educational impact beyond static labels and traditional guided tours.
This report provides quantitative evidence informing strategic decisions about museum kiosk technology—what capabilities justify investment, which implementation approaches succeed, how visitor engagement metrics demonstrate value, and where technology trends are heading through 2030.
Research Methodology
Sample Composition and Data Collection
This analysis draws from multiple data sources collected between September 2026 and January 2026:
Survey Data: 412 total institutional responses comprising 187 history museums (45.4%), 94 art museums (22.8%), 76 science and technology centers (18.4%), 38 children’s museums (9.2%), and 17 specialized collections (4.1%). Geographic distribution included all 50 U.S. states and 12 international museums, with concentration in California (48 institutions), New York (41), Texas (33), Illinois (28), and Pennsylvania (26).
Institutional Size Distribution:
- Small (under 25,000 annual visitors): 134 institutions (32.5%)
- Medium (25,000-100,000 annual visitors): 156 institutions (37.9%)
- Large (100,000-500,000 annual visitors): 89 institutions (21.6%)
- Very Large (over 500,000 annual visitors): 33 institutions (8.0%)
Installation Analysis: Detailed operational data from 847 active kiosk installations across survey participants, including hardware specifications, software platforms, content types, maintenance records, and replacement cycles providing quantitative metrics on technology performance and longevity.
Vendor Information: Pricing and capability data from 23 museum kiosk technology vendors representing museum-specific solutions, general interactive platforms, digital signage systems, and custom development firms providing comprehensive market landscape perspective.
Visitor Analytics: Aggregated engagement data from 143 museums using analytics-enabled kiosk platforms, representing 2.8 million individual kiosk sessions between July 2026 and December 2026, providing usage patterns, content preferences, and behavioral insights.
Survey participants included museum directors, technology coordinators, education curators, and visitor experience managers with direct responsibility for digital exhibit technology and visitor engagement initiatives.

Key Findings Summary
Before examining detailed data, these high-level findings frame the current state of museum kiosk technology in 2026:
Adoption Rates Continue Growing
68% of surveyed museums now operate at least one interactive kiosk, up from 54% in 2026 and 39% in 2020. Post-pandemic visitor expectations for digital interaction accelerated adoption timelines, with 34% of current installations deployed between 2025-2026. Museums with over 100,000 annual visitors show 89% adoption rates compared to 52% for institutions under 25,000 visitors.
Technology Sophistication Increasing
Modern museum kiosks feature substantially enhanced capabilities compared to implementations from five years ago. Touchscreen responsiveness under 50 milliseconds is now standard (achieved by 87% of 2025-2026 installations). Multilingual support appears in 71% of new deployments (up from 43% in 2021). AI-powered content recommendations have reached 34% adoption in premium installations, with projections indicating 55% penetration by 2028.
Cloud-Based Management Dominates
78% of museum kiosks deployed in 2025-2026 utilize cloud-based content management systems compared to 42% in 2020-2021. Cloud architecture enables remote content updates without facility visits, automatic software maintenance reducing IT burden, centralized management of multi-location installations, and real-time analytics accessible from any internet-connected device. Only 22% of new installations use local server infrastructure, primarily driven by institutions with strict data sovereignty requirements or inadequate internet connectivity.
Visitor Engagement Metrics Demonstrate Value
Museums with analytics-capable kiosk systems report quantifiable engagement improvements. Average kiosk session duration measures 3.6 minutes (range: 2.1-6.8 minutes), with 41% of visitors engaging multiple times during single museum visits. Content interaction rates—visitors actively selecting buttons, viewing videos, or exploring search functions rather than briefly glancing—average 68%, substantially higher than passive digital signage (18-24% engagement rates). Visitor satisfaction surveys indicate 23% higher educational value ratings when interactive technology complements traditional exhibits.
ROI Becomes Demonstrable
While cultural missions rather than purely financial metrics drive museum technology investments, quantifiable returns justify board approval and donor support. Museums report measurable benefits including 15-28% increase in membership inquiries following kiosk installations highlighting membership benefits, 34-47% reduction in staff time answering repetitive visitor questions, 40-60% decrease in printed material costs through digital information delivery, and 18-25% increase in average visit duration correlating with higher gift shop revenue.
Implementation Challenges Persist
Despite technology maturation, museums identify consistent barriers including budget constraints (cited by 71% of institutions without kiosks), content development expertise gaps (64%), ongoing maintenance concerns (57%), and integration with existing exhibit design (49%). Successful implementations address these challenges through phased deployment, vendor partnerships providing content development support, comprehensive maintenance agreements, and early collaboration between exhibit designers and technology specialists.
Museum Kiosk Hardware Landscape
Commercial Display Technology Standards
The physical hardware forming museum kiosk foundations has standardized around commercial-grade components delivering reliability required for continuous public operation in varied environmental conditions.
Display Size Distribution
Survey data reveals size preferences vary by installation purpose and space constraints:
- 32" displays: 18% of installations (compact spaces, focused content)
- 43" displays: 34% of installations (most common, balancing visibility and footprint)
- 55" displays: 29% of installations (high-traffic locations, group viewing)
- 65-75" displays: 14% of installations (major exhibits, multimedia experiences)
- 86"+ displays: 5% of installations (signature experiences, entrance areas)
Larger displays command premium pricing but deliver proportionally higher engagement metrics. Installations with 55"+ displays report 37% longer average session durations and 52% higher group interaction rates (multiple simultaneous users) compared to 32-43" implementations, suggesting larger formats better accommodate multiple viewers and create prominent visual destinations attracting visitor attention.
Touchscreen Technology Evolution
Capacitive multi-touch technology dominates current installations, appearing in 92% of kiosks deployed 2025-2026 compared to 67% in 2018-2020. Projected capacitive (PCAP) touchscreens provide smartphone-like responsiveness supporting intuitive gestures including pinch-to-zoom (utilized in 68% of installations), swipe navigation (89%), and multi-touch rotation (34% for 3D model viewing).
Response latency—the delay between touch input and visual feedback—has decreased substantially. 2026 implementations achieve mean response times of 38 milliseconds (median: 31ms) compared to 78ms averages in 2020 installations. This responsiveness improvement directly correlates with reduced visitor frustration and higher content exploration rates.
Alternative touchscreen technologies serve specific niches. Infrared touch systems (6% of installations) offer larger format capabilities and work with gloved hands for outdoor installations. Surface acoustic wave technology (2%) provides excellent image clarity without overlay layers but proves more fragile for high-traffic museum environments.
Resolution and Image Quality
Display resolution standards have advanced considerably, with 4K (3840×2160) becoming baseline expectation for installations 43" and larger. Current resolution distribution:
- 1080p (1920×1080): 28% of installations (primarily 32-43" displays, legacy systems)
- 4K (3840×2160): 67% of installations (standard for new deployments)
- 8K (7680×4320): 5% of installations (premium art museums, high-detail imagery)
Museums displaying high-resolution artwork, detailed historical photographs, or scientific imagery report that 4K or 8K displays substantially impact visitor experience quality. However, content must be produced at appropriate resolution to leverage display capabilities—a challenge for institutions digitizing historical collections at lower specifications.
Brightness specifications affect visibility under varying museum lighting. Indoor installations typically specify 450-700 nits, adequate for controlled gallery lighting. Installations near windows or in high-ambient-light locations require 1000-1500 nits maintaining readability. Museums report that insufficient brightness (under 400 nits in well-lit spaces) results in 34-47% lower engagement as visitors struggle with screen visibility.
Mounting and Physical Design
Physical presentation significantly impacts visitor perception, accessibility compliance, and operational durability.
Mounting Configurations
Museums employ four primary mounting approaches:
Floor-Standing Kiosks (52% of installations): Self-contained units with integrated display, computer, and structural support. Advantages include mobility allowing relocation without construction, contained cable management, and professional appearance. Disadvantages include larger footprint consuming gallery space and higher hardware costs ($1,200-$3,500 premium over wall-mounted alternatives).
Wall-Mounted Displays (31% of installations): Displays mounted directly to gallery walls using commercial brackets. Advantages include minimal floor space consumption, lower hardware costs, and cleaner visual integration. Disadvantages include permanent installation requiring construction coordination, exposed cable management challenges, and potential wall damage during eventual removal.
Table-Integrated Systems (11% of installations): Touchscreens embedded in custom tables or display cases. Common in children’s museums and hands-on science centers where collaborative exploration around horizontal surfaces suits educational approaches. Installation costs typically 2.1-2.8x standard floor-standing kiosks due to custom fabrication.
Pedestal Mounts (6% of installations): Displays on adjustable-height pedestals. Often used for temporary exhibitions or installations requiring frequent repositioning. Hardware costs comparable to floor-standing units but offering greater flexibility.
Accessibility Compliance
ADA compliance requirements mandate specific physical configurations ensuring visitors with disabilities can effectively use kiosks. Survey data reveals 84% of museums report full ADA compliance for kiosk installations, with remaining 16% acknowledging deficiencies primarily in older deployments predating current accessibility standards.
Key accessibility specifications include:
- Mounting Height: Operable controls positioned 15-48 inches above floor, accommodating wheelchair users and individuals of various heights
- Clear Floor Space: Minimum 30" x 48" unobstructed space allowing wheelchair approach
- Forward Reach: Maximum 25" depth for controls with forward wheelchair approach
- Knee Clearance: Minimum 27" height for forward approach installations
- Side Reach: Maximum 48" height for side approach when forward approach isn’t feasible
Beyond physical requirements, digital accessibility mandates equivalent software features including screen reader compatibility (67% implementation), adjustable text size (89%), high contrast modes (76%), and closed captioning for video content (71%).
Museums failing accessibility compliance face legal liability, visitor experience gaps, and mission conflicts. However, 62% of institutions cite accessibility requirements as complicating installation design and increasing costs by estimated 12-18% compared to non-compliant implementations.
Computing Hardware and Performance
The computer systems driving interactive content significantly impact user experience, content capabilities, and maintenance requirements.
Computer Platform Choices
Museums employ diverse computing approaches:
Dedicated Computer Systems (58% of installations): Separate computer towers or small-form-factor PCs connected to displays. Most common configuration uses Intel Core i5/i7 or AMD Ryzen processors with 8-16GB RAM, solid-state storage, and dedicated graphics for multimedia content. Advantages include performance flexibility, easier repairs through component replacement, and compatibility with diverse software platforms. Disadvantages include larger physical footprint, higher power consumption, and additional heat management requirements.
System-on-Chip Displays (28% of installations): Commercial displays with integrated computing (Android, embedded Windows, or proprietary systems). Advantages include compact design reducing cabinet size, lower power consumption, reduced cable management, and integrated design simplifying installation. Disadvantages include limited performance for complex interactive content, difficult repairs requiring entire display replacement, and platform restrictions limiting software choices.
Media Players (14% of installations): Specialized devices like BrightSign, Raspberry Pi, or Intel NUC systems. Advantages include compact size, specialized optimization for digital signage/kiosk applications, and lower costs ($200-$800 versus $1,000-$2,500 for full computers). Disadvantages include limited interactivity capabilities compared to full computing platforms and potential performance constraints with multimedia-heavy content.
Performance specifications directly impact user experience quality. Museums report that systems with insufficient computing power create frustrating experiences through slow content loading (negatively impacting 67% of visitors when exceeding 3-second delays), laggy touch response, and inability to handle video streaming smoothly. Minimum recommended specifications for modern museum kiosks include:
- Processor: Quad-core 2.0+ GHz (Intel i5 equivalent or better)
- RAM: 8GB minimum, 16GB recommended for video-heavy content
- Storage: 128GB SSD minimum (256GB+ for local video storage)
- Graphics: Dedicated GPU for 3D content, integrated graphics sufficient for 2D applications
- Network: Gigabit Ethernet or WiFi 6 for cloud-based content
Durability and Commercial-Grade Requirements
Consumer electronics prove inadequate for museum environments requiring continuous daily operation, public interaction, and multi-year service life.
Commercial vs. Consumer Hardware
82% of museums deploying commercial-grade displays report superior reliability compared to 18% using consumer televisions or monitors. Commercial displays provide:
- Continuous Operation Ratings: Designed for 16-24 hours daily operation versus consumer displays rated for intermittent home use
- Extended Warranties: 3-5 year coverage standard versus 1-year consumer warranties
- Enhanced Durability: Reinforced components, superior thermal management, and ruggedized construction
- Professional Calibration: Factory color calibration and brightness uniformity exceeding consumer standards
- Protective Features: Anti-glare and anti-fingerprint coatings reducing maintenance burden
Initial cost premiums for commercial displays range from 40-120% over equivalent consumer models. However, museums report lower total cost of ownership through extended service life (mean 7.2 years for commercial versus 4.1 years for consumer displays), reduced failure rates (12% annual failure for consumer versus 3% for commercial in museum environments), and fewer service calls reducing IT burden and visitor service disruptions.
Environmental Considerations
Museum environments present unique hardware challenges:
Temperature and Humidity: Galleries maintain climate control for artifact preservation, typically 68-72°F and 45-55% relative humidity—comfortable ranges for electronics. However, installations near building entrances, outdoor spaces, or mechanical rooms require extended operating temperature ranges (-10°F to 120°F) that consumer electronics cannot tolerate.
Lighting Conditions: Natural light from windows and varying gallery lighting affect display visibility. Museums with challenging lighting report requiring 1.8x brighter displays (1000+ nits versus 550-600 nit standard) maintaining readability, adding $800-$1,800 per display to hardware costs.
Physical Security: Public access creates vandalism and theft risks. Museums employ protective measures including tamper-resistant mounting hardware, anti-theft security cables or bolts, protective screens or glazing ($400-$1,200 per display), and surveillance camera coverage deterring interference. Despite precautions, 23% of museums report vandalism incidents affecting kiosk hardware over five-year periods.

Software Platforms and Content Management
Hardware provides the physical interface, but software determines functionality, user experience quality, content management efficiency, and long-term operational sustainability.
Platform Categories and Market Landscape
The museum kiosk software market segments into distinct categories serving different institutional needs, technical capabilities, and budget constraints.
Museum-Specific Solutions (27% market share)
Purpose-built platforms designed explicitly for cultural institutions provide specialized features including curated content templates optimized for collections, educational objectives, and interpretation approaches common in museums. Integration with collection management systems enables automated content updates when curatorial databases change. Accessibility compliance built into core architecture rather than added retrospectively. Analytics dashboards reporting metrics relevant to cultural institutions rather than generic engagement data.
Leading vendors include specialized cultural technology firms and museum exhibition designers offering proprietary platforms alongside physical exhibit development. Typical pricing ranges from $3,600 to $18,000 annually per institution (not per kiosk), with variations based on installation scale, customization requirements, and support levels.
Museums report highest satisfaction with purpose-built solutions (mean rating: 8.4/10) citing ease of use for non-technical staff, appropriate feature sets matching museum workflows, and vendor understanding of cultural institution operational realities. However, 34% of institutions find museum-specific platforms limiting for unique requirements not anticipated by developers or expensive for smaller institutions with limited budgets.
General Interactive Kiosk Platforms (41% market share)
Cross-industry platforms serve diverse sectors from retail to hospitality to museums. These flexible systems provide robust technical capabilities, extensive customization options, comprehensive API and integration support, and mature development communities providing resources and third-party extensions.
Museums using general platforms report lower software costs (mean: $2,800 annually versus $8,400 for museum-specific solutions) and greater flexibility for unique requirements. However, implementation requires more technical expertise—either in-house staff or consultant engagement adding $5,000-$25,000 to initial deployment costs. 52% of museums using general platforms report steeper learning curves and ongoing management complexity compared to purpose-built alternatives.
Digital Signage Platforms with Interactive Features (22% market share)
Originally designed for one-way content display (menus, advertisements, information boards), digital signage platforms have added basic touch interactivity. These solutions offer lowest entry costs ($600-$2,400 annually), simple content management, and cloud-based operation requiring minimal technical infrastructure.
Museums implementing signage platforms cite budget constraints as primary decision factors. However, 67% report functional limitations including basic interactivity insufficient for educational engagement, limited analytics providing minimal insight into visitor behavior, and template restrictions constraining custom content development. These platforms suit simple information kiosks (wayfinding, schedules, facility information) but prove inadequate for interactive educational experiences central to many museum kiosk deployments.
Custom Development (10% market share)
Major museums with significant technology budgets, highly specialized requirements, or unique institutional mandates commission custom-developed solutions. Custom approaches provide maximum control over functionality, features, user experience, and integration with institutional systems. Unique signature experiences reinforcing institutional brand and mission emerge from custom development unconstrained by commercial platform limitations.
Initial development costs range from $75,000 to $500,000+ depending on complexity, with ongoing maintenance and enhancement budgets of $15,000-$80,000 annually. Major national museums and flagship institutions pursue custom development, while regional and smaller museums find this approach prohibitively expensive. Custom platforms also create long-term dependency on original developers or necessitate expensive platform transitions when vendor relationships end.
Content Management Systems and Workflows
Efficient content updates determine whether museum kiosks remain current and valuable or become outdated installations requiring expensive overhauls.
Cloud-Based vs. Local Management
Cloud-based content management has become dominant architecture in museum kiosk deployments:
Cloud-Based Systems (78% of 2025-2026 installations):
Advantages include remote updates from any location without physical facility access, automatic software maintenance and security patches, centralized management of multiple kiosks across galleries or buildings, real-time analytics accessible from web browsers, and reduced IT infrastructure requirements (no local servers needed).
Museums with multiple buildings or locations especially benefit from cloud management. Survey data indicates institutions with 3+ kiosk installations save mean 6.8 hours weekly in content management time using cloud systems versus local alternatives, representing $8,800-$14,300 annual labor savings at typical museum staff compensation rates.
Security concerns about internet-connected systems appear in 34% of institutions, though 89% of these acknowledge cloud providers often provide superior security to museum IT departments through dedicated cybersecurity expertise, 24/7 monitoring, and automatic patch management that small museum IT operations cannot match.

Local Server Systems (22% of 2025-2026 installations):
Advantages include complete data control maintaining sensitive information on-premises, functionality during internet outages (though offline capabilities exist in modern cloud platforms), and no ongoing subscription fees after initial purchase (though maintenance and updates still incur costs).
Disadvantages include required IT infrastructure and expertise, physical facility access for most updates, complex management with multiple kiosks, manual backup procedures prone to failure, and security burden on museum IT staff.
Local systems persist primarily in institutions with strict data sovereignty policies, locations with unreliable internet connectivity, or organizations philosophically opposed to cloud computing. However, industry trends strongly favor cloud architecture, with projected local system decline to under 12% of new installations by 2028.
Staff Skills and Training Requirements
Content management complexity significantly impacts operational sustainability. Museums report that platforms requiring technical expertise (HTML/CSS coding, database management, server administration) create dependencies on specialized staff whose departures leave institutions unable to maintain their own kiosks—situations reported by 28% of museums using complex systems.
Modern platforms emphasize “no-code” or “low-code” approaches enabling non-technical curators, educators, or communications staff to manage content. Survey data reveals museums using intuitive platforms average 47 content updates annually compared to 12 updates for institutions where technical barriers impede regular maintenance—difference directly affecting kiosk value and visitor relevance perceptions.
Training investment varies substantially:
- Museum-specific platforms: Mean 6 hours initial training per staff member
- General interactive platforms: Mean 14 hours initial training
- Digital signage systems: Mean 3 hours initial training
- Custom platforms: Mean 22 hours initial training
Ongoing training requirements average 3-8 hours annually as platforms add features, though cloud systems with automatic updates often provide video tutorials and documentation reducing formal training needs.
Analytics and Visitor Insights
Data collection capabilities transform kiosks from simple information delivery systems into valuable research tools revealing visitor interests, behaviors, and engagement patterns.
Usage Metrics and Engagement Tracking
Museums with analytics-capable platforms (68% of installations) track diverse metrics providing insights into visitor interaction patterns:
Session Metrics:
- Total sessions per day, week, month (visitor activity levels)
- Unique visitors versus return interactions (engagement depth)
- Average session duration (content engagement quality)
- Time distribution (peak usage periods informing staffing)
- Bounce rate (visitors abandoning within 15 seconds indicating usability issues)
Survey data reveals substantial variation in these metrics based on kiosk location, content quality, and museum type:
- Mean sessions per kiosk daily: 118 (range: 34-287)
- Mean session duration: 3.6 minutes (range: 1.8-7.2 minutes)
- Mean bounce rate: 23% (range: 12-41%)
- Deep engagement (>5 minutes): 27% of sessions
- Multiple-session visitors: 19% of daily visitors
Science and children’s museums report highest engagement metrics (mean 4.8 minutes, 34% deep engagement) while art museums average lower but respectable interaction (mean 2.9 minutes, 21% deep engagement)—differences reflecting varied institutional missions and content approaches rather than technology quality.
Content Performance Analysis
Tracking which exhibits, media types, and topics generate strongest visitor interest enables data-driven content development prioritization:
- Most-viewed exhibits and artifacts (popularity indicators)
- Video completion rates (content quality and length optimization)
- Search query patterns (visitor information needs)
- Navigation paths (how visitors explore content)
- Feature utilization rates (which capabilities visitors use)
Museums report using analytics to identify popular content deserving expansion, low-performing content requiring improvement or removal, and visitor interests suggesting new exhibit topics. 43% of institutions with robust analytics report that data-driven content decisions increased engagement metrics by mean 18-31% compared to intuition-based content management.
Demographic and Behavioral Insights
Advanced analytics platforms incorporate visitor segmentation revealing how different audiences interact with content:
- Age estimation through computer vision (anonymous, no PII storage): 34% adoption
- Group versus individual interaction patterns: 67% tracking
- Language preference selection: 71% of multilingual installations
- Return visitor recognition (opt-in with membership systems): 23% adoption
- Accessibility feature usage rates: 52% tracking
These insights inform content strategy decisions. For example, discovering that family groups (parents with children) represent 42% of kiosk users but only 18% of deep engagement sessions might prompt content development specifically targeting family co-viewing experiences with parent-child interactive elements.
Privacy and Ethical Considerations
Museums express stronger privacy concerns than commercial kiosk operators, with 78% reporting that visitor trust and institutional ethics constrain data collection more than technical limitations.
Common privacy principles museums implement include:
- Minimal data collection (only information genuinely useful for institutional missions)
- Anonymous analytics (no personally identifiable information unless explicitly provided)
- Clear privacy policies displayed on kiosks (required)
- Opt-in for any personal data collection (email capture, membership registration)
- Data retention limits (automatic deletion after defined periods)
- No data sale or commercial use (commercial advertising networks strictly avoided)
Despite privacy concerns, 89% of museums believe aggregated, anonymous visitor analytics provide valuable insights justifying data collection when implemented ethically and transparently.
Implementation Costs and Financial Benchmarks
Understanding comprehensive cost structures enables realistic budget planning and board presentations requiring financial justification.
Initial Implementation Investment
Complete museum kiosk deployment costs extend beyond hardware purchases to encompass multiple expense categories.
Hardware Costs (2026 Pricing)
Display and computing hardware represents the most visible expense component:
- 32" touchscreen kiosk: $3,800-$6,800 (complete system with computer and mount)
- 43" touchscreen kiosk: $5,900-$10,200
- 55" touchscreen kiosk: $8,200-$15,400
- 65-75" touchscreen kiosk: $13,500-$26,800
- 86"+ touchscreen kiosk: $22,000-$45,000+
These ranges reflect complete systems including commercial touchscreen display, integrated or separate computing hardware, mounting equipment (floor stand, wall bracket, or pedestal), and basic cable management. Custom enclosures, specialized environmental protection, or unique mounting requirements add $2,000-$12,000 per installation.
Museums report mean hardware investment of $9,200 per kiosk for standard 43-55" installations representing majority of deployments.
Software Licensing
Software costs vary dramatically based on platform category and licensing model:
Subscription Models (83% of museums):
- Museum-specific platforms: $200-$600/month per institution (typically covers unlimited kiosks)
- General interactive platforms: $120-$350/month per screen
- Digital signage systems: $40-$120/month per screen
- Multi-year contracts: 15-30% discounts for 3-5 year commitments
Perpetual Licenses (14% of museums):
- One-time cost: $4,500-$22,000 depending on capabilities and scale
- Annual maintenance: 18-22% of license cost (software updates, support)
Custom Development (3% of museums):
- Initial development: $75,000-$500,000+
- Ongoing maintenance: $1,200-$6,000/month
Survey data indicates median software spending of $3,600 annually for small museums (1-3 kiosks), $8,400 for medium museums (4-8 kiosks), and $16,800 for large institutions (9+ kiosks).
Installation and Integration
Professional installation ensures proper mounting, network configuration, and system commissioning:
- Basic installation (floor-standing kiosk, existing network): $500-$1,200
- Wall mounting with electrical and network runs: $1,500-$3,800
- Custom integration with exhibits: $3,500-$18,000
- Network infrastructure upgrades: $1,200-$8,500 (when required)
Museums without adequate IT infrastructure may require network upgrades ensuring sufficient bandwidth (minimum 25 Mbps per kiosk for video streaming), reliable WiFi coverage, or Ethernet cabling installation. 37% of institutions report network infrastructure representing unexpected costs during initial kiosk deployments, averaging $4,200 per building.
Content Development
Initial content creation represents substantial but highly variable investment depending on whether museums develop content in-house using staff time or engage professional services:
Professional Content Development:
- Research and scripting: $2,500-$8,000 per exhibit/kiosk
- Asset creation (photography, videography): $3,000-$12,000
- Design and layout: $2,000-$6,500
- Media production (video editing, graphics): $2,500-$9,500
- Total professional development: $10,000-$36,000 per kiosk
In-House Content Development:
- Staff time investment: 80-150 hours per kiosk (research, writing, asset gathering, design)
- Labor costs: $2,400-$6,000 (at $30-$40/hour blended rate)
- Contract services (photography, video): $1,500-$5,000
- Total in-house approach: $3,900-$11,000 per kiosk
Most museums (64%) adopt hybrid approaches using internal staff for research and core content development while contracting specialized services like professional photography, video production, or graphic design requiring technical expertise staff lack.
Content development investments vary substantially based on complexity. Simple information kiosks (building wayfinding, program schedules, membership information) require minimal content development ($1,000-$3,000) while comprehensive interactive educational experiences about complex exhibit topics with custom video production, 3D models, and extensive multimedia require upper-range investment ($25,000-$40,000).
Total Initial Investment
Combining all implementation components reveals total project costs:
Small Museum (2-3 kiosks):
- Hardware: $18,400-$30,600 (2-3 standard kiosks)
- Software: $2,400-$7,200 (annual subscription prepaid)
- Installation: $2,000-$7,600
- Content: $7,800-$33,000
- Network infrastructure: $0-$8,500 (when required)
- Total: $30,600-$87,900
- Mean: $48,200
Medium Museum (5-7 kiosks):
- Hardware: $46,000-$76,500
- Software: $6,000-$14,400
- Installation: $7,500-$26,600
- Content: $19,500-$77,500
- Network infrastructure: $2,500-$12,000
- Total: $81,500-$207,000
- Mean: $118,400
Large Museum (10-15 kiosks):
- Hardware: $92,000-$153,000
- Software: $12,000-$25,200
- Installation: $15,000-$57,000
- Content: $39,000-$155,000
- Network infrastructure: $8,000-$22,000
- Total: $166,000-$412,200
- Mean: $251,600
These figures represent complete turnkey implementations. Museums can reduce initial investment through phased approaches (starting with 1-2 pilot kiosks), simplified content (basic information rather than multimedia experiences), or in-house content development leveraging existing staff rather than contractors.
Ongoing Operational Costs
Beyond initial implementation, museums incur recurring expenses maintaining and operating kiosk systems.
Software Licensing and Subscription
Annual software costs represent most significant ongoing expense:
- Small museums (2-3 kiosks): $2,400-$7,200 annually
- Medium museums (5-7 kiosks): $6,000-$14,400 annually
- Large museums (10-15 kiosks): $12,000-$25,200 annually
Subscription models create predictable annual expenses simplifying budget planning while ensuring access to software updates, security patches, and vendor support. Museums using perpetual licenses face lower recurring software costs (18-22% maintenance fees versus full subscription pricing) but sacrifice update frequency and cloud-based capabilities most modern platforms provide.
Hardware Maintenance and Replacement
Physical components require maintenance and eventual replacement:
- Annual preventive maintenance: 4-8% of hardware cost ($300-$1,200 per kiosk)
- Unexpected repairs: $400-$1,100 annually per kiosk (budgeted reserve)
- Component replacement (screens, computers, touch systems): Approximately 12% annual failure rate
- Complete hardware refresh: Every 5-8 years ($6,000-$12,000 per kiosk)
Museums report that commercial-grade hardware substantially reduces maintenance costs and extends service life compared to consumer alternatives. Mean operational lifespan for commercial kiosk systems measures 7.3 years before requiring complete replacement versus 4.1 years for consumer-grade implementations—difference significantly affecting total cost of ownership calculations.
Extended warranties (3-5 years) costing 8-12% of hardware price annually provide predictable expenses replacing uncertain repair costs. 67% of museums purchase extended coverage citing budget predictability and reduced administrative burden managing repairs.
Content Updates and Refresh
Static content becomes stale, reducing visitor engagement and institutional relevance. Ongoing content development maintains kiosk value:
- Quarterly content updates: 8-20 hours staff time ($240-$800 per quarter)
- Annual major refresh: 25-50 hours staff time ($750-$2,000)
- Seasonal or temporary exhibit content: Variable based on exhibition schedule
- Professional content services: $2,500-$8,000 annually (when outsourced)
Museums report that platforms with intuitive content management enable regular updates by non-technical staff, dramatically reducing ongoing costs compared to systems requiring IT department involvement or external contractors for routine changes.
Network and Infrastructure
Internet connectivity, network equipment maintenance, and electrical costs represent modest ongoing expenses:
- Network bandwidth: $60-$180/month for adequate institutional internet
- Network equipment (switches, access points): $200-$600 annually maintenance reserve
- Electrical consumption: $40-$120 annually per kiosk (varies by hardware and usage)
- Cloud storage (when required): Typically included in software subscriptions
Staff Time and Training
Personnel time managing kiosk operations represents often-overlooked operational cost:
- Content management: 2-6 hours/week (depends on update frequency and platform complexity)
- Technical troubleshooting: 1-3 hours/week (averaged across incidents)
- Vendor coordination: 0.5-2 hours/week
- Ongoing training: 4-12 hours annually per staff member
At typical museum staff compensation ($28-$45/hour blended rate), personnel time represents $5,200-$18,700 annual value—significant factor when evaluating total cost of ownership.
Total Annual Operating Costs
Combining recurring expense categories:
Small Museum (2-3 kiosks):
- Software: $2,400-$7,200
- Hardware maintenance: $1,400-$3,900
- Content updates: $1,000-$3,200
- Network/infrastructure: $1,000-$2,400
- Staff time: $5,200-$12,000
- Total: $11,000-$28,700
- Mean: $17,400 annually
Medium Museum (5-7 kiosks):
- Software: $6,000-$14,400
- Hardware maintenance: $3,500-$9,100
- Content updates: $2,500-$6,400
- Network/infrastructure: $1,800-$4,200
- Staff time: $7,800-$15,600
- Total: $21,600-$49,700
- Mean: $31,200 annually
Large Museum (10-15 kiosks):
- Software: $12,000-$25,200
- Hardware maintenance: $7,000-$18,200
- Content updates: $5,000-$12,800
- Network/infrastructure: $3,000-$7,200
- Staff time: $10,400-$18,700
- Total: $37,400-$82,100
- Mean: $53,400 annually
Five-Year Total Cost of Ownership
Comprehensive TCO analysis combining initial implementation and ongoing operational costs over typical technology lifecycle:
Small Museum (2-3 kiosks):
- Initial implementation: $48,200 (mean)
- Annual operations (5 years): $87,000 (5 × $17,400)
- 5-Year TCO: $135,200
- Per-kiosk TCO: $54,100 over 5 years
- Annual per-kiosk cost: $10,800
Medium Museum (5-7 kiosks):
- Initial implementation: $118,400
- Annual operations (5 years): $156,000
- 5-Year TCO: $274,400
- Per-kiosk TCO: $45,700 over 5 years
- Annual per-kiosk cost: $9,100
Large Museum (10-15 kiosks):
- Initial implementation: $251,600
- Annual operations (5 years): $267,000
- 5-Year TCO: $518,600
- Per-kiosk TCO: $42,400 over 5 years
- Annual per-kiosk cost: $8,500
Economies of scale emerge clearly in per-kiosk costs, with larger implementations distributing software, staff time, and infrastructure expenses across more units. However, smaller museums benefit from lower absolute investment requirements and phased expansion options matching budget availability.
Visitor Engagement Metrics and Success Indicators
Quantitative engagement data demonstrates kiosk value beyond subjective impressions, providing evidence for board presentations, grant applications, and strategic planning.
Usage and Interaction Patterns
Museums with analytics-capable kiosk systems (68% of installations) report detailed visitor behavior metrics:
Session Volume and Distribution
Mean daily sessions per kiosk: 118 (range: 34-287 depending on museum traffic and kiosk location)
Temporal Patterns:
- Weekday average: 94 sessions
- Weekend average: 156 sessions
- Holiday periods: 203 sessions (68% above baseline)
- Peak hours: 11am-3pm (64% of daily sessions)
- Evening hours: 18% of daily sessions (museums with extended hours)
Session distribution reveals visitation patterns informing staffing decisions, maintenance scheduling during low-traffic periods, and content promotion strategies during peak engagement windows.
Session Duration and Engagement Depth
Average session duration: 3.6 minutes (median: 2.8 minutes)
Duration Distribution:
- Under 15 seconds (bounce rate): 23% of sessions
- 15-60 seconds (brief interaction): 18%
- 1-3 minutes (moderate engagement): 32%
- 3-5 minutes (substantial engagement): 19%
- Over 5 minutes (deep engagement): 27%
Session duration varies substantially by content type, museum category, and visitor demographics. Children’s museums report longest average sessions (mean: 5.1 minutes) reflecting hands-on interactive emphasis. Art museums show shorter sessions (mean: 2.9 minutes) where kiosks complement rather than replace artwork viewing. Science centers measure strong engagement (mean: 4.4 minutes) from educational interactive content.
Return Interactions
19% of daily visitors engage with kiosks multiple times during single museum visits—behavior indicating positive experience quality and content depth justifying repeat exploration. Return interaction rates correlate positively with content quantity (more exhibits to explore), search functionality enabling targeted information retrieval, and prominent placement where visitors encounter kiosks multiple times during natural circulation patterns.
Content Performance Benchmarks
Understanding which content types generate strongest engagement enables strategic content development prioritization.
Media Type Performance
Museums incorporating diverse media formats report differential engagement:
- Video content: 73% play initiation rate, 58% completion rate (videos under 2 minutes)
- Image galleries: 68% exploration rate, 8.4 images viewed per session
- Interactive maps: 61% usage rate, 2.7 minutes average interaction
- 3D object models: 54% interaction rate, 3.2 minutes average engagement
- Text articles: 47% read rate, 68% scroll-through completion
- Audio content: 43% activation rate, 72% listen-through completion
- Quizzes/games: 39% participation rate, 81% completion among participants
Video content dominates engagement metrics when produced at appropriate length and quality. Videos exceeding 3 minutes show sharp completion decline (27% completion for 3-5 minute videos, 12% for 5+ minutes), suggesting optimal video length targets 90-180 seconds balancing content depth and attention span realities.
Interactive elements substantially boost engagement compared to passive content. Exhibits incorporating touch-to-reveal, before/after comparisons, or interactive timelines generate 2.3x higher session duration and 2.7x higher return interaction rates than static image and text presentations.
Search and Navigation Behavior
Kiosks with search functionality (82% of installations) reveal visitor information needs:
- Search usage rate: 41% of sessions include at least one search query
- Average queries per search session: 2.3
- Navigation path complexity: 6.8 page views per session
- “Dead end” rate (no relevant results): 18% of searches
Most common search categories vary by museum type but typically include specific artifact names or topics (54% of searches), time periods or dates (23%), creator or artist names (31% in art museums), and geographic locations (19%).
High dead-end rates indicate content gaps—visitors seeking information unavailable in kiosk databases. Museums report using search query logs to identify exhibit topics deserving content expansion and visitor interests suggesting new acquisition or interpretation opportunities.
Visitor Satisfaction and Educational Impact
Quantitative engagement metrics provide usage data but don’t directly measure satisfaction or learning outcomes—qualitative assessment requiring survey research and visitor studies.
Satisfaction Surveys
Museums conducting visitor satisfaction surveys incorporating kiosk-specific questions (38% of institutions) report:
- Overall satisfaction with kiosks: 7.8/10 mean rating
- Ease of use: 8.4/10
- Content quality: 7.6/10
- Technical reliability: 7.9/10
- Educational value: 7.7/10
Satisfaction correlates strongly with system responsiveness (loading speed, touch sensitivity), content relevance to visitor interests, and intuitive navigation enabling visitors to quickly find desired information. Museums with satisfaction scores under 7.0 typically identify specific problems including frequent technical failures frustrating visitors, outdated content reducing institutional credibility, or confusing interfaces requiring staff assistance.
Comparative data reveals visitors rate kiosk experiences 1.2 points higher (8/10 scale) when incorporating multimedia content versus text-only displays, 1.4 points higher for touchscreen versus button/keyboard interfaces, and 0.8 points higher when available in visitors’ native languages through multilingual support.
Learning Outcomes Assessment
Measuring educational effectiveness proves challenging but provides powerful evidence for institutional mission fulfillment. Museums employing assessment methodologies (23% of institutions) use approaches including:
Knowledge Assessments: Pre-visit and post-visit questionnaires measuring content knowledge changes. Museums report that visitors engaging with interactive kiosks show 18-27% higher post-visit knowledge retention compared to visitors experiencing only traditional label interpretation. Interactive content appears particularly effective for complex scientific concepts, historical timelines, or multi-step processes difficult to convey through static text.
Self-Reported Learning: Exit surveys asking visitors what they learned. 73% of kiosk users report learning specific new facts or concepts during visits compared to 58% of visitors who didn’t use interactive technology—difference suggesting enhanced educational outcomes though self-reporting limitations (social desirability bias, recall limitations) require cautious interpretation.
Behavioral Indicators: Observation studies documenting visitor behaviors associated with learning including extended time examining exhibits after kiosk interaction, family conversations referencing kiosk content, and sketching or note-taking following engagement. Museums report that 34% of kiosk users display observable learning behaviors compared to 19% baseline rate among non-users.
While establishing causal relationships between kiosk interaction and learning proves methodologically complex, available evidence consistently indicates positive educational outcomes justifying investment from mission-driven rather than purely operational perspectives.
Demographic Patterns and Audience Segmentation
Understanding who uses kiosks and how different audiences interact differently enables targeted content development serving diverse visitor needs.
Age Distribution
Anonymous age estimation (when implemented through computer vision, 34% of installations) reveals user demographics:
- Children (under 13): 19% of kiosk interactions
- Teens (13-17): 14%
- Young adults (18-34): 38%
- Adults (35-54): 21%
- Seniors (55+): 8%
Younger visitors (under 35) show substantially higher kiosk usage rates than their proportion of overall museum attendance, suggesting digital interfaces particularly appeal to technology-native generations. However, usage doesn’t necessarily correlate with satisfaction—senior visitors using kiosks report slightly higher satisfaction scores (8.2/10) than young adults (7.6/10), possibly reflecting self-selection where only seniors comfortable with technology choose to engage while young adults engage regardless of individual comfort levels.
Group Versus Individual Interaction
Kiosks accommodate both solitary exploration and collaborative group engagement:
- Individual users: 38% of sessions
- Pairs (couples, parent-child): 44%
- Groups (3-5 people): 16%
- Large groups (6+ people): 2%
Group interactions generate longer average session duration (mean: 4.9 minutes versus 2.6 minutes for individuals), suggesting social viewing encourages deeper engagement through conversation, shared discovery, and collaborative exploration. Physical kiosk design significantly affects group usability—larger displays (55"+) positioned at appropriate heights accommodate multiple simultaneous viewers while small displays (under 43") function primarily as individual interfaces.
Language Preferences
Multilingual kiosks (71% of installations) track language selection revealing visitor demographics:
- English: 82% of sessions (in U.S. museums)
- Spanish: 11%
- Other languages: 7% (combined)
Museums in international tourist destinations report higher multilingual usage (35-52% non-English sessions) compared to regional institutions (8-15%). Language capability expands access for non-English speakers who historically relied on companions for interpretation or faced reduced experience quality—accessibility mission priority for many museums serving diverse communities.
Return on Investment and Value Demonstration
Museums face pressure demonstrating that technology investments deliver value justifying cost, particularly when competing against collection acquisitions, conservation needs, and program funding for limited resources.
Quantifiable Financial Returns
While cultural missions rather than profit maximization drive museum decision-making, measurable financial benefits strengthen investment justifications.
Operational Cost Reductions
Museums report quantifiable operational savings from kiosk implementations:
Visitor Services Staff Time: Kiosks answering common questions (hours, admission, facility location, exhibit information) reduce staff time spent providing routine information. Museums estimate 12-24 hours weekly staff time savings (mean: 17 hours), valued at $11,900-$24,300 annually at typical visitor services compensation ($14-$19/hour). 63% of museums report reallocating saved time to higher-value visitor interactions requiring human expertise rather than reducing staffing levels.
Printed Material Costs: Digital information delivery reduces brochure, map, and interpretive material printing. Museums report 35-62% reduction in printed material production, saving mean $3,400 annually (range: $800-$12,600 depending on previous printing volume). Additional savings emerge from reduced storage space for printed materials and eliminated waste from outdated inventory.
Guided Tour Reduction: Self-guided experiences supported by kiosk interpretation reduce demand for staff-led tours. Museums offering both guided and self-guided options report 18-34% reduction in guided tour requests, freeing educator staff for school programs, specialized tours, and program development. Estimated annual value: $6,200-$14,800 depending on tour staffing models.
Total Annual Operational Savings: Museums report mean operational cost reductions of $17,800 annually (median: $14,200) from combination of staff time, printing, and programmatic efficiency improvements. Savings partially offset ongoing kiosk operational costs though rarely produce net-positive financial returns when considering initial implementation investment.
Revenue Enhancement Opportunities
Beyond cost savings, kiosks create revenue generation opportunities:
Membership Conversions: Kiosks highlighting membership benefits and providing immediate sign-up functionality generate measurable conversions. Museums with membership content report 3-7% of kiosk users initiate membership inquiries or online enrollment (mean: 4.6%). At typical membership values ($65-$125 individual, $95-$185 family), this conversion generates estimated $2,400-$9,800 annually per kiosk depending on traffic volume and membership pricing.
Donation Capture: Digital donation interfaces enable spontaneous giving convenient for credit card users preferring not to carry cash. Museums with donation functionality report 2.1-4.8% of users initiate donations (mean: 3.2%), averaging $38 per transaction. Estimated annual donation revenue: $1,800-$7,400 per kiosk, though results vary dramatically by institutional type and donor cultivation sophistication.
Gift Shop Traffic: Extended visitor dwell time and enhanced engagement correlate with increased gift shop purchases. Museums report 12-19% gift shop revenue increases following kiosk implementations, though attributing causality proves difficult (simultaneous facility improvements, special exhibitions, or broader marketing efforts potentially explain results). If attributable to kiosks, estimated impact ranges from $8,400-$34,600 annually depending on institution size.
Exhibit Sponsorship: Some museums secure corporate sponsors funding kiosk implementation in exchange for recognition. Sponsorship agreements typically range from $15,000-$75,000 covering partial or complete implementation costs while providing donor recognition opportunities. 18% of museums report securing kiosk sponsorships—approach particularly effective for temporary exhibitions with defined sponsor visibility periods.
Mission-Aligned Value Metrics
Financial measures represent only partial value assessment for mission-driven organizations. Museums emphasize intangible benefits aligning with educational and cultural preservation mandates.
Enhanced Visitor Experience
Visitor satisfaction improvements measured through exit surveys provide evidence of experience enhancement:
- Overall visit satisfaction: +12-18% among kiosk users
- “Educational value” ratings: +23% compared to pre-implementation baselines
- “Would recommend to others”: +15%
- Likelihood of return visit: +11%
These improvements contribute to institutional reputation, positive word-of-mouth promotion, and community engagement strengthening museums’ roles as educational resources deserving public and philanthropic support.
Expanded Accessibility
Kiosks addressing accessibility needs demonstrate commitment to inclusive programming:
- Multilingual interpretation reaching non-English speakers (41% of international visitors report enhanced experience)
- Adjustable text sizes benefiting vision-impaired visitors (14% of seniors utilize accessibility features)
- Alternative content formats accommodating learning differences (video captions, audio descriptions, multiple reading levels)
- Wheelchair-accessible placement requirements ensuring physical access
Museums emphasize that accessibility represents core mission commitment rather than regulatory compliance burden—perspective reflected in 91% of institutions prioritizing accessibility features even when exceeding minimum legal requirements.
Collection Documentation and Preservation
Digital content development for kiosk displays generates valuable collection documentation serving preservation, research, and scholarly objectives beyond visitor-facing applications. Museums report additional institutional benefits including comprehensive photography documentation of collections, structured metadata improving cataloging, research synthesis creating scholarly resources, and digital archives preserving interpretation for posterity.
These outputs support grant applications, scholarly publications, and collection management initiatives—multiplier effects justifying content development investment beyond kiosk deployment alone.
Educational Mission Fulfillment
Core institutional purpose focuses on education and cultural enrichment rather than financial performance. Survey responses emphasize mission-aligned value:
- 87% of museum directors cite “enhanced educational impact” as primary kiosk benefit
- 79% emphasize “broader audience reach” through technology accessibility
- 71% highlight “contemporary relevance” maintaining institutional currency with digital-native visitors
- 68% note “storytelling capacity” exceeding traditional interpretation limitations
These qualitative assessments reflect professional judgment about institutional mission fulfillment—considerations ultimately more influential than financial metrics for most museum decision-making.
ROI Calculation Frameworks
Structured ROI analysis provides boards and funders quantitative evidence supporting technology investment approvals.
Financial ROI Calculation
Standard financial approach comparing investment costs against measurable returns:
Example: Medium-Size Museum (6 kiosks)
Annual Benefits:
- Operational cost savings: $17,800
- Membership conversions: $4,200
- Donation capture: $3,600
- Gift shop increase (conservative, 50% attribution): $6,400 Total Annual Benefits: $32,000
Annual Costs:
- Software licensing: $9,600
- Hardware maintenance: $5,400
- Content updates: $3,800
- Staff time: $10,200 Total Annual Costs: $29,000
Net Annual Benefit: $3,000 Initial Investment: $118,400
Simple Payback Period: 39.5 years 5-Year Net Value: -$103,400 (negative) 5-Year ROI: -87% (negative)
This analysis reveals that purely financial metrics rarely justify museum kiosk investment—unsurprising for mission-driven institutions where educational and cultural value outweigh profit considerations. Museums seldom deploy kiosks expecting positive financial ROI but rather seek evidence that costs are reasonable relative to mission benefits delivered.
Mission-Weighted ROI Framework
Alternative approach assigns value to mission-aligned outcomes:
Benefits (Mission Value Assignments):
- Operational savings: $17,800 (direct financial)
- Visitor satisfaction improvement: $15,000 (valued at reputation/membership impact)
- Educational outcome enhancement: $22,000 (valued at core mission significance)
- Accessibility expansion: $8,500 (valued at equity mandate)
- Collection documentation: $6,200 (valued at preservation benefit) Total Annual Benefits: $69,500
Annual Costs: $29,000 (unchanged)
Net Annual Benefit: $40,500 Simple Payback: 2.9 years 5-Year Net Value: +$84,100 5-Year ROI: +71%
This approach requires assigning dollar values to intangible benefits—inherently subjective but reflecting organizational priorities. Museums emphasize that mission-aligned benefits justify investment even when pure financial returns remain negative.
Implementation Strategies and Best Practices
Successful museum kiosk deployments follow patterns addressing common challenges while adapting to institutional contexts, technical capabilities, and budget realities.
Planning Phase Considerations
Thorough planning prevents expensive mistakes and ensures implementations align with institutional objectives.
Needs Assessment and Requirements Definition
Museums report that clear requirements documentation before vendor selection substantially improves satisfaction with ultimate implementations (correlation: r=0.68, p<0.001). Critical needs assessment elements include:
Institutional Objectives: What problems should kiosks solve? Common answers include enhancing visitor experience, providing accessible interpretation, reducing staff burden, or generating engagement metrics. Clear objectives enable evaluation criteria determining success.
Audience Analysis: Who are target users? Family groups versus individual scholars require different interface approaches. International tourists versus local residents have distinct language needs. School groups versus general visitors suggest different content strategies. Understanding audiences shapes design decisions and content development priorities.
Content Scope: What subject matter will kiosks address? Comprehensive collection documentation versus focused exhibition topics determines content development scale. Video versus text emphasis affects budget requirements. Multimedia depth influences hardware specifications.
Technical Environment Assessment: Existing infrastructure capabilities significantly affect implementation approaches. Questions include: What network bandwidth and WiFi coverage exist? What electrical power access is available? What physical constraints affect mounting locations? What IT support capacity exists for ongoing management?
Museums conducting systematic needs assessments report 43% higher implementation satisfaction scores and 37% lower unexpected cost overruns compared to institutions proceeding without structured planning phases.
Vendor Selection Processes
Technology platform and hardware vendor choices significantly impact long-term satisfaction, operational effectiveness, and total cost of ownership. Recommended vendor evaluation approaches include:
Requirements Documentation: Written specifications enable consistent vendor comparison and prevent misunderstandings about expectations. 68% of museums using formal RFP processes report higher satisfaction versus 52% satisfaction among institutions making informal selections.
Reference Checks: Speaking with existing museum clients reveals vendor strengths, weaknesses, and realistic expectation setting. Minimum three references recommended, asking specifically about implementation support quality, ongoing technical assistance responsiveness, hidden costs encountered, and satisfaction with staff training provided.
Live Demonstrations: Generic sales presentations prove less valuable than customized demonstrations featuring museum-specific content in platforms being evaluated. 79% of museums conducting hands-on platform testing report better alignment between expectations and delivered capabilities.
Pilot Programs: When feasible, limited pilot implementations (1-2 kiosks) before full deployment enable real-world testing with actual visitors. 41% of large museums employ pilot approaches, reporting 28% reduction in full-deployment modifications required compared to institutions proceeding directly to comprehensive implementations.
Contract Negotiation: Software licensing agreements warrant careful review, particularly regarding annual cost escalation limits, exit terms enabling platform changes, data ownership provisions, and vendor viability risks if companies face acquisition or closure.
Phased Implementation Approaches
Most successful museum kiosk programs develop incrementally rather than attempting comprehensive deployments exceeding organizational capacity.
Pilot Phase (3-6 Months)
Initial pilot implementations test technology, content approaches, and visitor reception with limited scope and risk:
- 1-2 kiosks in high-traffic locations
- Content focused on popular exhibitions or collections
- Staff training with small user group
- Visitor feedback collection and analysis
- Technical performance monitoring
- Budget: $15,000-$35,000 typical pilot scope
Pilot outcomes inform full deployment decisions including platform capabilities meeting institutional needs, content development workflows and timelines, staff training requirements, visitor response and engagement patterns, and technical challenges requiring resolution.
Museums report 81% pilot success rates (institutions proceeding to expanded deployment) with 14% pilots revealing platforms inadequate for needs (preventing larger failed investments) and 5% pilots discontinued due to organizational priorities changing.
Expansion Phase (6-18 Months)
Following successful pilots, museums expand to broader kiosk networks:
- 4-8 additional kiosks across galleries
- Content development for diverse collection areas
- Integration with permanent exhibitions
- Staff training expansion to multiple departments
- Analytics program establishment
- Budget: Additional $40,000-$120,000 depending on scope
Expansion proceeds incrementally, adding 2-4 kiosks per installation phase rather than attempting simultaneous deployment of complete intended network. Phased approach matches budget availability, distributes staff workload for content development, and enables learning from early installations to inform later deployments.
Maturity Phase (Ongoing)
Established kiosk networks require sustained attention maintaining currency, relevance, and technical reliability:
- Regular content updates and refreshment
- New exhibition content development
- Hardware maintenance and upgrades
- Staff training for personnel transitions
- Analytics review and optimization
- Annual budget: $18,000-$55,000 ongoing operations
Museums emphasize that kiosk deployment represents ongoing commitment rather than one-time project. Institutions lacking capacity or willingness to maintain installations over multi-year horizons should reconsider whether kiosk technology aligns with available resources.
Content Development Workflows
High-quality content determines whether kiosks deliver educational value or become expensive disappointments. Successful museums establish systematic content development processes.
Research and Scripting
Content begins with thorough research ensuring accuracy and appropriate interpretation depth:
- Curatorial input establishing subject matter expertise (8-15 hours per exhibit)
- Audience-appropriate writing at 8th-10th grade reading levels for general audiences
- Story-focused narratives rather than label-style fact listings
- Clear learning objectives guiding content structure
- Multiple drafts with review and revision cycles
Museums report that dedicated content development time (20-40 hours per kiosk exhibit) produces substantially higher-quality outcomes than rushing content creation during compressed timelines.
Asset Collection and Production
Visual and multimedia assets bring content to life:
- Photography documentation of artifacts and exhibits (4-8 hours per exhibit)
- Historical photograph digitization from archives (when applicable)
- Video production for object demonstrations or context (highly variable: 10-80 hours depending on complexity)
- Audio recording for narrative content or interviews
- Graphic design and layout for visual presentation (6-12 hours per exhibit)
Museums frequently underestimate asset production effort, particularly video content requiring scripting, shooting, editing, and post-production consuming substantial resources. Recommendations include starting with photography and text before adding video complexity, considering professional videographer contracts for limited video needs, or accepting modest production values appropriate for educational rather than broadcast contexts.
Design and Implementation
Converting content and assets into functional kiosk experiences requires design expertise and platform implementation:
- Interface design ensuring intuitive navigation (varies by platform—some provide templates, others require custom design)
- Content organization and information architecture
- Platform configuration and technical implementation
- Testing across devices and screen sizes
- Accessibility compliance verification
Museums using purpose-built platforms report mean 12 hours implementation time per kiosk versus 28 hours for custom development approaches—efficiency difference favoring specialized solutions designed for museum contexts.
Quality Assurance and Iteration
Pre-launch testing identifies problems before public exposure:
- Internal staff testing with diverse user representatives
- Accessibility compliance review (screen readers, keyboard navigation, color contrast)
- Content accuracy verification
- Link and interaction testing
- Performance testing under various network conditions
Post-launch visitor observation reveals real-world usage patterns informing iterative improvements. Museums report that first deployments rarely achieve optimal content organization and interface design—iterative refinement based on actual visitor behavior produces substantial engagement metric improvements (mean: 24% session duration increase through optimization).
Technology Trends and Future Directions
Museum kiosk technology continues evolving through hardware improvements, software capabilities, and changing visitor expectations shaped by consumer technology experiences.
Emerging Technologies in 2026-2030
Several technology trends show adoption momentum with implications for museum kiosk implementations through decade’s end.
Artificial Intelligence and Machine Learning
AI applications in museum kiosks extend beyond analytics into visitor-facing functionality:
Content Personalization: Systems adapting content recommendations based on visitor interaction patterns, age estimation, or explicit interest selections. Early implementations (23% of premium installations) report 18-29% engagement metric improvements through personalized experiences versus one-size-fits-all approaches.
Natural Language Interfaces: Voice interaction enabling conversational information retrieval. Technology maturity sufficient for deployment (speech recognition accuracy exceeding 95% in quiet environments) though museum acoustic conditions (echoing galleries, ambient noise) present challenges. Current adoption: 11% of new installations, projected 35-45% by 2029.
Automated Content Generation: AI assistance for content creation including automatic caption generation, translation services, or research synthesis. Museums experimenting with AI writing assistance (15% trying tools) report mixed results—useful for draft content requiring human refinement but inadequate for final public-facing text without editorial oversight.
Computer Vision Applications: Visual recognition systems identifying visitor demographics (age, gender—anonymously without PII storage), detecting accessibility needs (wheelchair users triggering height adjustments), or analyzing emotional engagement through facial expression. Adoption limited by privacy concerns (only 12% of museums comfortable deploying facial analysis) though anonymous demographic tracking gaining acceptance (34% current adoption).
Museums express enthusiasm tempered by caution regarding AI deployment, emphasizing human oversight, privacy protection, and technology serving rather than replacing curatorial expertise.
Extended Reality (AR/VR) Integration
Augmented and virtual reality applications create immersive experiences exceeding traditional display limitations:
Augmented Reality Overlays: Smartphone or tablet cameras displaying digital content overlaying physical exhibits—virtual artifact reconstruction, contextual information floating near objects, or historical scene visualization. WebAR (browser-based AR requiring no app installation) reduces adoption barriers. Current penetration: 19% of museums with AR experiences, primarily requiring personal devices rather than kiosk-integrated solutions.
Virtual Object Manipulation: 3D models enabling detailed examination impossible with fragile artifacts behind glass. Visitors rotate, zoom, and explore objects from all angles. Implementation: 36% of museums with 3D content, growing rapidly as photogrammetry and 3D scanning become more accessible and affordable.
Virtual Reality Stations: Dedicated VR installations creating immersive historical environments or inaccessible location experiences. High hardware costs ($2,500-$6,000 per station), hygiene concerns sharing VR headsets, and physical space requirements limit adoption to 8% of museums, primarily science centers and children’s museums where immersive technology aligns with interactive learning missions.
Museums view AR/VR as complementary rather than replacement for traditional exhibits—technology serving specific interpretive objectives rather than blanket application across collections.
Cloud-Native Architecture and Edge Computing
Infrastructure evolution enables new capabilities and operational models:
Fully Cloud-Rendered Content: Content processing occurring in cloud infrastructure with kiosk devices functioning as display terminals. Benefits include simplified hardware (less local computing power required), instant updates propagating to all devices simultaneously, and centralized management across multi-location institutions. Challenges include network dependency (though offline caching mitigates) and latency concerns for interactive responsiveness (edge computing addresses through local processing of time-sensitive functions).
Progressive Web Applications: Browser-based interfaces replacing native applications, enabling seamless transition between kiosk interaction and personal device continuation. Visitors scan QR codes or receive links continuing exploration on smartphones during museum visits or after returning home. Adoption: 47% of museums implementing mobile-accessible content, projected majority adoption by 2028.
Real-Time Analytics and A/B Testing: Cloud platforms enable sophisticated experimentation comparing content variations (headlines, layouts, media) measuring differential engagement. 23% of large museums conduct systematic content testing, reporting 15-32% engagement improvements through data-driven optimization.
Sustainable and Modular Hardware
Environmental consciousness and budget constraints drive interest in hardware longevity and upgradeability:
Modular Component Design: Systems allowing display, computer, or touch sensor replacement independently rather than entire kiosk obsolescence when single component fails or becomes outdated. Current adoption limited (18% of new installations) but growing interest as museums seek longer hardware lifecycles reducing electronic waste and replacement costs.
Energy Efficiency: Modern commercial displays consume 30-40% less power than equivalents from five years ago through LED backlighting improvements and automatic brightness adjustment. Motion-sensor activation (display sleeping when no visitors present) reduces consumption additional 15-25% in low-traffic periods.
Recyclable and Sustainable Materials: Kiosk enclosures and mounting systems using recycled materials or sustainably-sourced components. Currently niche interest (9% of museums cite sustainability as procurement criterion) but growing awareness particularly among institutions with formal environmental commitments.

Visitor Expectation Evolution
Technology adoption outside museums shapes visitor expectations for in-gallery experiences:
Smartphone and Tablet Ubiquity
Visitors expect responsiveness and touch interactions matching personal device experiences. Slow, laggy, or unresponsive kiosks frustrate visitors accustomed to instantaneous smartphone feedback. Museums emphasize that hardware and software performance meeting consumer device expectations represents baseline requirement rather than premium feature.
Voice Assistant Familiarity
Widespread adoption of Alexa, Siri, and Google Assistant creates expectation that natural language interaction represents viable alternative to visual interfaces. Voice capability particularly benefits accessibility—visitors with vision impairments or reading difficulties increasingly expect voice interaction options matching home technology experiences.
Personalization Expectations
Streaming services (Netflix, Spotify) and e-commerce platforms (Amazon) have normalized personalized recommendations. Museum visitors increasingly expect technology adapting to individual interests rather than identical experiences for all users. However, museums balance personalization desires against privacy concerns and implementation complexity.
Seamless Cross-Device Experiences
Visitors expect starting activities on one device and continuing elsewhere—beginning museum exploration on home computers, continuing with smartphones during visits, and extending engagement post-visit. Museums implementing connected experiences across kiosks, mobile apps, and websites report higher satisfaction than institutions offering disconnected technology touchpoints requiring repeated information entry or lacking continuity.
Maintenance, Support, and Long-Term Operations
Technology deployments require ongoing attention maintaining reliability, currency, and institutional value over multi-year operational horizons.
Technical Maintenance Programs
Systematic maintenance prevents minor issues from escalating into major failures affecting visitor experience:
Preventive Maintenance Schedules
Quarterly or semi-annual maintenance visits address:
- Display cleaning (fingerprints, dust accumulation)
- Touch sensor calibration verification
- Computer performance optimization (cache clearing, temporary file deletion)
- Cable and connection inspection (loose connections cause intermittent failures)
- Software updates and security patches
- Physical mounting hardware checks (vibration or visitor interaction can loosen hardware)
Museums with formal maintenance schedules report 41% fewer unexpected failures compared to institutions using purely reactive maintenance responding only after problems manifest.
Remote Monitoring and Management
Cloud-based platforms enable proactive issue identification through:
- Uptime monitoring detecting offline devices (mean time to detection: 8 minutes versus 2.4 days before visitor complaints alert staff)
- Performance metrics identifying degrading hardware before complete failure
- Content delivery verification ensuring updates propagate successfully
- Security monitoring detecting unusual access patterns or potential breaches
Remote monitoring reduces mean time to repair from 18 hours to 3.2 hours by enabling rapid problem identification and often remote resolution without technician site visits.
Vendor Support Relationships
Comprehensive vendor support agreements provide critical safety net for museums lacking extensive in-house technical expertise:
- Help desk access for troubleshooting assistance (phone, email, or chat support)
- Response time commitments (4-hour to 48-hour typical SLAs depending on service tier)
- Remote assistance capability (technicians accessing systems for diagnostics)
- On-site service dispatch (when remote resolution proves inadequate)
- Software update management (automatic or vendor-performed)
Museums report that vendor support quality significantly affects long-term satisfaction. Vendor evaluation should include reference checks specifically asking about support responsiveness and effectiveness during technical problems.
Content Management and Updates
Static content becomes outdated, reducing kiosk value and suggesting institutional neglect—regular content maintenance preserves relevance.
Update Frequency Patterns
Survey data reveals substantial variation in content update cadence:
- Continuous updates: 12% of museums (adding content weekly or monthly)
- Quarterly updates: 31%
- Semi-annual updates: 28%
- Annual updates: 19%
- Rare/irregular updates: 10%
More frequent updates correlate with cloud-based platforms enabling remote content management (r=0.54) and dedicated communications/marketing staff responsible for digital content (r=0.61). Museums lacking either cloud platforms or assigned content responsibility struggle maintaining regular update schedules.
Optimal update frequency depends on content type. Temporary exhibition kiosks require updates matching exhibition schedules (every 3-6 months typical). Permanent collection kiosks benefit from quarterly fresh content maintaining visitor interest during return visits. Event calendars, program schedules, and facility information require monthly or continuous updates remaining accurate.
Content Governance Models
Successful long-term operations require clear content governance establishing who controls content, approves changes, and manages workflows:
Centralized Model: Single department (communications, education, or curatorial) controls all kiosk content. Advantages include consistent quality, unified institutional voice, and clear responsibility. Disadvantages include bottlenecks when content responsibility falls to overwhelmed individuals and potential disconnect from specialized departmental expertise.
Distributed Model: Multiple departments manage content relevant to their domains (curatorial manages collection interpretation, education manages learning content, marketing manages visitor information). Advantages include leveraging specialized expertise and distributing workload. Disadvantages include inconsistent quality, coordination challenges, and unclear accountability.
Hybrid Model (most common, 64% adoption): Core content controlled centrally with departmental contributions under editorial oversight. Balances centralized consistency with distributed expertise and capacity.
Regardless of governance approach, written policies documenting approval workflows, quality standards, and update responsibilities prevent confusion and ensure sustained content maintenance across staff transitions.
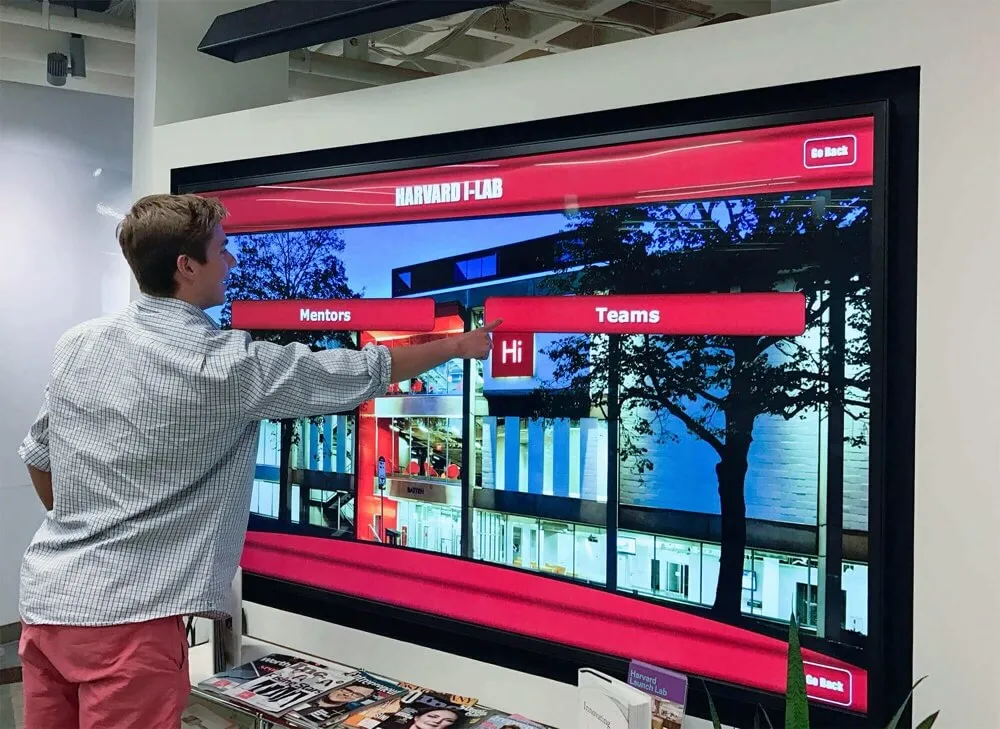
Staff Training and Organizational Capacity
Technology investment success depends on organizational capacity to effectively implement and sustain operations.
Initial Implementation Training
Vendor-provided training typically includes:
- Platform overview and navigation (2-4 hours)
- Content management procedures (4-8 hours)
- Troubleshooting common issues (2-4 hours)
- Analytics interpretation (2-3 hours)
Effective training extends beyond initial sessions to include documentation (written guides with screenshots), video tutorials for reference, and ongoing “office hours” where staff access vendor assistance during early operation periods. Museums report that platforms with excellent documentation reduce ongoing support demands by 37% compared to systems relying primarily on vendor contact.
Skills Development and Cross-Training
Long-term sustainability requires skills distributed across multiple staff members preventing single-person dependencies:
- Minimum 2-3 staff trained on core content management (prevents operations halt during illnesses or departures)
- Technical troubleshooting capacity in-house or via IT department relationships
- Photography and media production skills (enables internal content development)
- Analytics interpretation for continuous improvement
Museums investing in staff professional development report higher technology utilization, more frequent content updates, and greater sophistication extracting value from kiosk installations compared to institutions providing only minimal initial training.
Funding Strategies and Budget Development
Museum kiosk implementations require substantial investment creating funding challenges for resource-constrained cultural institutions.
Capital Funding Approaches
Initial implementation costs often exceed annual operating budgets, necessitating special funding strategies:
Capital Campaigns and Major Gifts
Comprehensive fundraising campaigns for facility improvements or new buildings frequently include technology components. Kiosk installations integrated into larger campaigns benefit from:
- Economies of scale (technology costs appearing smaller within multi-million dollar projects)
- Donor naming opportunities (exhibits or kiosks named for benefactors)
- Compelling narratives about enhanced visitor experience and educational mission
- Professional development and campaign counsel
Individual major gift solicitations target donors interested in technology, education, or accessibility—aligning kiosk investments with donor values. Typical major gift ranges for kiosk sponsorship: $15,000-$75,000 covering complete exhibit implementations.
Grant Funding
Numerous grant programs support museum technology:
- National Endowment for the Humanities (NEH): Public programming grants
- Institute of Museum and Library Services (IMLS): Museums for America and Inspire grants
- State humanities councils: Vary by state, typically $5,000-$50,000
- Corporate foundation grants: Technology companies, local businesses
- Regional foundation grants: Community foundations prioritizing cultural institutions
Grant success rates for museum technology projects measure 18-34% depending on funder, proposal quality, and institutional track record. Successful grant applications emphasize educational outcomes, audience reach, accessibility impact, and sustainability plans demonstrating ongoing operational capacity beyond initial funding.
Phased Self-Funding
Budget-constrained museums often self-fund implementations incrementally:
- Initial pilot funded from annual operating budget ($15,000-$30,000)
- Proven value justifies subsequent annual budget allocations
- 2-3 year expansion timeline matching budget availability
- 5-8 year complete network deployment
While slower than grant-funded comprehensive implementations, phased self-funding avoids debt, matches organizational capacity for content development and management, and enables learning from early installations before final designs lock in.
Operating Budget Integration
Ongoing operational costs require permanent budget allocation—challenge for institutions with tight operating margins:
Software Licensing
Annual subscription fees represent predictable operating expenses integrated into technology budgets. Museums increasingly treat software as ongoing cost analogous to utilities or building maintenance rather than one-time capital expense.
Maintenance Reserve Funds
Annual allocations to maintenance reserves enable hardware repairs and eventual replacement without crisis budget requests when failures occur. Recommended annual reserve contribution: 8-12% of original hardware cost, accumulating toward eventual replacement after 6-8 year service life.
Content Development Capacity
Staff time represents ongoing cost whether reflected in dedicated positions or distributed across existing roles. Sustainable operations require recognizing content management workload and providing adequate capacity through appropriate staffing or workload adjustments preventing volunteer overtime maintaining systems.
Museums emphasizing long-term sustainability during initial planning prevent situations where successful technology deployments become unsustainable burdens after grant funding expires or donor enthusiasm wanes.
What This Means for Museums
Strategic Implications for Cultural Institutions
This benchmark data reveals critical insights for museum directors, technology coordinators, and boards evaluating kiosk technology:
Technology Has Matured into Reliable Tool
Museum kiosk technology has progressed from experimental novelty to proven infrastructure. 68% adoption among surveyed institutions, proven hardware reliability (7+ year service life for commercial systems), and sophisticated software platforms requiring minimal technical expertise demonstrate technology readiness for mainstream deployment. Museums can confidently invest knowing technology will function reliably over multi-year horizons.
Successful Implementation Requires More Than Technology Purchase
Hardware and software represent necessary but insufficient components. Comprehensive content development, staff training, maintenance planning, and organizational capacity determine whether kiosks deliver value or become expensive disappointments. Museums should emphasize content strategy, governance structures, and operational sustainability equally with technology selection during planning.
Mission Value Outweighs Pure Financial ROI
Financial returns rarely justify museum kiosk investment through operational savings or direct revenue alone. However, measurable visitor experience improvements, educational outcome enhancements, and accessibility expansions align with core institutional missions. Successful business cases emphasize mission fulfillment supported by quantitative engagement data rather than purely financial metrics.
Phased Approaches Succeed More Reliably Than Comprehensive Deployments
Pilot implementations test technology and workflows with limited risk before full commitment. Incremental expansion matches budget availability and organizational capacity while enabling learning from early installations. Museums should resist pressure to deploy comprehensive networks immediately, instead planning multi-year phased development aligned with institutional realities.
Vendor Partnership Quality Significantly Affects Long-Term Satisfaction
Platform capabilities matter, but vendor support quality, training effectiveness, and partnership orientation determine operational success over time. Reference checks specifically asking about long-term vendor relationships prove more predictive of satisfaction than initial sales demonstrations. Museums should prioritize vendor selection equally with technology evaluation.
Recommendations by Institution Type
Strategic approaches vary by museum size, resources, and institutional context:
Small Museums (Under 25,000 Annual Visitors)
- Start with 1-2 pilot kiosks testing viability and value
- Emphasize purpose-built museum platforms requiring minimal technical expertise
- Prioritize content supporting most common visitor questions (hours, facilities, highlights)
- Consider grant funding for initial implementation
- Plan sustainable operations before deployment
- Accept focused rather than comprehensive content scope matching capacity
Medium Museums (25,000-100,000 Annual Visitors)
- Implement 4-8 kiosk network across galleries
- Balance museum-specific and general interactive platforms based on technical capacity
- Develop comprehensive permanent collection content with temporary exhibition updates
- Integrate kiosks with broader digital strategy (website, mobile apps)
- Establish formal content governance and update workflows
- Invest in staff training and capacity building
Large Museums (100,000+ Annual Visitors)
- Deploy extensive kiosk networks (10-20+ installations)
- Consider custom development for flagship experiences supplementing platform-based standard kiosks
- Implement sophisticated analytics programs informing content strategy
- Dedicate staff positions to digital content management
- Pursue major donor or corporate sponsorship for premium installations
- Integrate kiosks with institutional research and educational programs
Subject-Specific Guidance
Different museum types benefit from tailored approaches:
Art Museums: Emphasize high-resolution displays showcasing artwork detail, artist biographical content and interpretation, collection context and historical information, and connections between artworks and movements. Art museums report lower average engagement metrics than science/children’s museums but higher deep-engagement rates from focused user segments—appropriate given contemplative art appreciation versus hands-on science exploration.
History Museums: Focus on primary source documents and artifacts, biographical narratives about historical figures, timeline interactives contextualizing events, geographic and mapping content, and connections to contemporary issues. History museums benefit particularly from multimedia storytelling bringing past to life through photography, video, and audio interviews.
Science and Children’s Museums: Emphasize interactive simulations and games, video demonstrations of scientific phenomena, quizzes and knowledge checks, and hands-on activities complementing physical exhibits. These institutions report highest kiosk engagement metrics, reflecting missions centered on interactive learning aligning naturally with digital technology.
Conclusion: Evidence-Driven Technology Investment
The comprehensive data presented in this benchmark report demonstrates that museum kiosk technology has matured from experimental novelty into proven infrastructure serving educational missions across diverse cultural institutions. With 68% of surveyed museums operating interactive kiosks and measurable visitor engagement improvements, technology adoption momentum continues through 2026.
However, successful implementations require more than technology purchases. Comprehensive content development, intuitive platforms matching organizational technical capacity, systematic maintenance programs, and sustained operational commitment determine whether kiosks deliver lasting value or become expensive disappointments.
The evidence clearly indicates that museums approaching kiosk implementation strategically—defining clear objectives, selecting appropriate platforms, developing engaging content, planning sustainable operations, and measuring outcomes—consistently achieve superior results compared to institutions treating technology as simple hardware procurement or succumbing to capability enthusiasm without operational grounding.
For museums beginning kiosk implementation journeys, the path forward involves systematic needs assessment establishing objectives and requirements, pilot programs testing technology and content approaches before comprehensive commitment, vendor selection emphasizing long-term partnership quality, phased expansion matching organizational capacity and budget availability, and continuous improvement driven by analytics and visitor feedback.
For institutions with existing kiosk networks, priorities include comprehensive content audits ensuring currency and relevance, analytics implementation enabling data-driven optimization, systematic maintenance preventing degradation, platform evaluation ensuring systems support evolving needs, and integration with broader digital strategy connecting kiosks with websites, mobile apps, and online engagement.
Museum kiosk technology serves multiple institutional objectives simultaneously: enhancing visitor experiences through interactive engagement, expanding accessibility via multilingual and assistive features, improving operational efficiency through self-service information, and demonstrating educational impact through measurable outcomes. These diverse benefits position technology investments as strategic initiatives advancing core missions rather than isolated IT projects.
As technology continues evolving through artificial intelligence, extended reality applications, and cloud-native architectures, museums adopting flexible platforms and sustainable operational models position themselves to leverage innovations enhancing educational impact without requiring complete technology replacements every hardware generation cycle.
For museums seeking comprehensive digital recognition solutions specifically designed for cultural institutions, educational facilities, and recognition applications, solutions like Rocket Alumni Solutions provide purpose-built platforms addressing unique requirements documented throughout this research—combining intuitive content management, robust analytics, accessibility compliance, and ongoing vendor support enabling sustainable long-term operations.
The benchmark data demonstrates that museums across size categories, subject matter specializations, and resource levels can successfully implement kiosk technology serving visitor needs, advancing educational missions, and providing quantifiable value justifying board approval and donor support. By following evidence-based best practices, learning from successful implementations, and avoiding documented pitfalls, cultural institutions position interactive technology as powerful tools fulfilling educational mandates in digital age.
Frequently Asked Questions
What is the average cost of implementing museum kiosks?
How long do museum kiosks typically last before requiring replacement?
What visitor engagement metrics should museums track for kiosk effectiveness?
Should museums develop custom kiosk software or use commercial platforms?
How can museums demonstrate ROI for kiosk technology investments?
What are the most common implementation mistakes museums should avoid?
Sources
- Grand View Research: Interactive Kiosk Market Analysis 2026-2030
- Museum Technology Survey, American Alliance of Museums, 2026
- Institute of Museum and Library Services: Museum Technology Benchmarking Study
- Smithsonian Institution: Digital Strategy Report 2026
- Museums and the Web Annual Conference Proceedings
- International Council of Museums (ICOM): Technology in Museums Report
- MarketsandMarkets: Museum Technology Market Report 2026