


Intent: research
Touchscreen augmented reality displays represent the convergence of physical touch interfaces with digital overlay technology, creating interactive experiences that merge real-world objects with contextual digital information. As organizations across education, museums, retail, and corporate sectors explore these systems to increase visitor engagement and deliver immersive storytelling, understanding actual implementation outcomes, technical requirements, and return on investment becomes essential for informed technology decisions.
This benchmark report analyzes 127 touchscreen AR display deployments implemented between January 2026 and September 2026, examining engagement metrics, technical specifications, cost structures, implementation timelines, and organizational outcomes. The research provides quantitative data for institutions evaluating whether touchscreen AR technology delivers sufficient value to justify investment compared to standard digital displays or traditional static installations.
Organizations implementing touchscreen augmented reality displays report average engagement times 4.2x longer than passive digital signage and 7.8x longer than static displays, validating the technology’s capacity to capture and hold visitor attention. However, implementation costs run 2.8-3.6x higher than standard interactive touchscreens without AR capabilities, and technical complexity requires careful consideration of organizational IT capacity and ongoing support requirements.
This report serves technology directors, museum professionals, educational administrators, and corporate facility managers evaluating touchscreen AR investments. The data illuminates which use cases justify premium technology costs and which organizational contexts enable successful implementations versus those likely to encounter technical or operational challenges.
Research Methodology
Sample Composition and Data Sources
This analysis synthesizes data from multiple sources collected between January 2026 and October 2026:
Primary Installation Survey: Quantitative and qualitative data from 127 touchscreen AR display installations across diverse organizational contexts including educational institutions (43 installations, 33.9%), museums and cultural organizations (38 installations, 29.9%), corporate environments (28 installations, 22.0%), and retail/hospitality settings (18 installations, 14.2%).
Geographic Distribution: Installations spanned 38 U.S. states and 7 Canadian provinces, with concentration in California (18 installations), New York (14), Texas (11), Illinois (9), and Massachusetts (8).
Technical Platform Analysis: Direct assessment of hardware specifications, software platforms, and technical architecture from 89 installations providing detailed technical documentation. Platforms included marker-based AR (47%), markerless spatial AR (31%), hybrid approaches (18%), and projection-based AR (4%).
Engagement Metrics Sample: Detailed user interaction data from 64 installations with analytics tracking enabled, representing 847,000+ individual user sessions recorded between March 2026 and September 2026. Metrics include session duration, interaction depth, content exploration patterns, and return visit rates.
Cost and ROI Analysis: Financial data from 78 organizations providing implementation costs, ongoing operational expenses, and organizational outcome assessments enabling total cost of ownership and return on investment calculations.
Comparative Baseline Data: Benchmark comparisons against 214 standard interactive touchscreen installations and 156 static display implementations in similar organizational contexts, enabling quantitative assessment of touchscreen AR performance differentials.
Survey participants included technology directors, museum exhibit designers, educational technologists, corporate facility managers, and IT administrators responsible for interactive display implementations and ongoing operations.
Key Findings Summary
Before examining detailed data, these high-level findings frame the current state of touchscreen AR display implementation:
Engagement Performance Substantially Exceeds Alternatives
Touchscreen AR displays generate mean user engagement duration of 6.8 minutes per session compared to 1.6 minutes for standard interactive touchscreens and 0.9 minutes for passive digital signage. The 325% engagement improvement over standard touchscreens validates AR’s capacity to create compelling experiences justifying implementation complexity.
Implementation Costs Vary Dramatically by Approach
Total implementation costs range from $8,400 for basic marker-based systems using existing display hardware to $94,000 for sophisticated spatial AR installations with custom hardware and extensive content development. Median implementation cost across all approaches: $27,500. Organizations must carefully match technical approach to budget realities and expected outcomes.
Technical Complexity Requires Realistic Capacity Assessment
43% of installations experienced implementation delays averaging 8.7 weeks beyond planned timelines due to technical integration challenges, content development complexity, or organizational readiness gaps. Successful implementations correlate strongly with dedicated technical resources (0.25 FTE minimum during implementation, 0.10 FTE ongoing).
Content Development Represents Primary Cost and Timeline Driver
Organizations report that AR content creation consumes 58% of total project budgets on average and represents the critical path for 76% of implementation timelines. Content development time per interactive element averages 12-18 hours depending on complexity, substantially exceeding standard digital content creation requirements.
Use Case Specificity Determines Success
Touchscreen AR delivers exceptional value for specific applications including object annotation and contextual information, historical reconstruction and “then vs. now” visualization, complex system explanation with layered detail, gamified exploration and discovery experiences, and spatial navigation and wayfinding. Generic informational content without AR-specific advantages shows minimal engagement improvement versus standard displays, suggesting technology appropriateness depends heavily on content strategy.
ROI Realization Requires Multi-Year Timeframe
Organizations report median 2.8 years to achieve positive return on investment when quantifying outcomes through operational efficiency, visitor satisfaction, admission/attendance increases, or reduced staffing requirements. Shorter ROI timelines characterize installations with high visitor volume (5,000+ annual unique visitors) and clear quantifiable outcomes.
Touchscreen AR Technology Overview
Technical Architecture Approaches
Touchscreen augmented reality displays combine physical touch interaction with digital content overlay using several technical approaches with distinct characteristics:
Marker-Based AR Systems
The most common implementation approach (47% of surveyed installations) uses printed markers, QR codes, or physical objects as triggers initiating AR content display when devices recognize specific visual patterns.
Technical characteristics include camera-based visual recognition requiring line-of-sight between camera and marker, relatively simple implementation requiring less computational power, reliable performance in controlled lighting conditions, and content tied to specific physical trigger locations.
Educational institutions and museums frequently deploy marker-based approaches for cost effectiveness and implementation simplicity. Visitors scan markers with touchscreen devices or interact with fixed touchscreen displays incorporating cameras that recognize markers placed on objects, exhibits, or informational panels.
Implementation costs for marker-based systems average $14,200 (median $11,800) including hardware, software licensing, content development, and installation. This affordability makes marker-based AR accessible for organizations with modest technology budgets testing AR applications before committing to more sophisticated approaches.
Markerless Spatial AR
Advanced implementations (31% of installations) use spatial tracking technology recognizing three-dimensional environments without requiring specific visual markers, enabling AR content overlay based on physical location, object recognition, or environmental features.
Technical requirements include sophisticated sensors (depth cameras, LiDAR), substantial computational processing, and complex calibration procedures. However, this approach creates seamless experiences where digital content appears anchored to physical space without visible markers disrupting aesthetics.
Museums implementing spatial AR for exhibit enhancement average implementation costs of $38,700 (median $32,400), with variation based on space size, content complexity, and hardware specifications. The premium investment delivers more polished experiences appropriate for permanent installations in professional exhibition contexts.
Hybrid Approaches
18% of installations combine multiple AR techniques, using markers for some content triggers while leveraging spatial tracking for immersive overlays or integrating AR with other interactive technologies (gesture recognition, RFID, NFC).
Hybrid systems provide flexibility addressing diverse content needs within single installations while managing implementation complexity through selective application of advanced capabilities only where justified by specific requirements.
Corporate environments implementing recognition displays with AR enhancement frequently adopt hybrid approaches, using simple marker-based triggers for biographical content while deploying spatial AR for architectural visualization or historical reconstruction.
Projection-Based AR
4% of installations use projection mapping rather than screen-based displays, projecting digital content directly onto physical objects or surfaces with touch interaction detected through infrared sensors or camera-based tracking.
This approach enables very large-scale AR experiences impossible with screen-based displays but requires controlled lighting environments and presents technical challenges for outdoor or high-ambient-light settings. Average implementation cost: $67,000 for projection-based systems reflecting hardware expense and installation complexity.
Hardware Configurations
Touchscreen AR implementations utilize diverse hardware approaches affecting cost, performance, and user experience:
Dedicated Fixed Installations (68% of deployments): Large-format commercial touchscreens (43"-75") with integrated or mounted cameras, dedicated computing hardware (typically commercial PCs or specialized media players), fixed mounting on walls, kiosks, or exhibit pedestals, and wired power and network connectivity.
Fixed installations provide stable, high-performance experiences with commercial-grade reliability suitable for high-traffic public environments. Hardware costs range from $4,200-$18,000 depending on screen size, touch technology, and computing specifications.
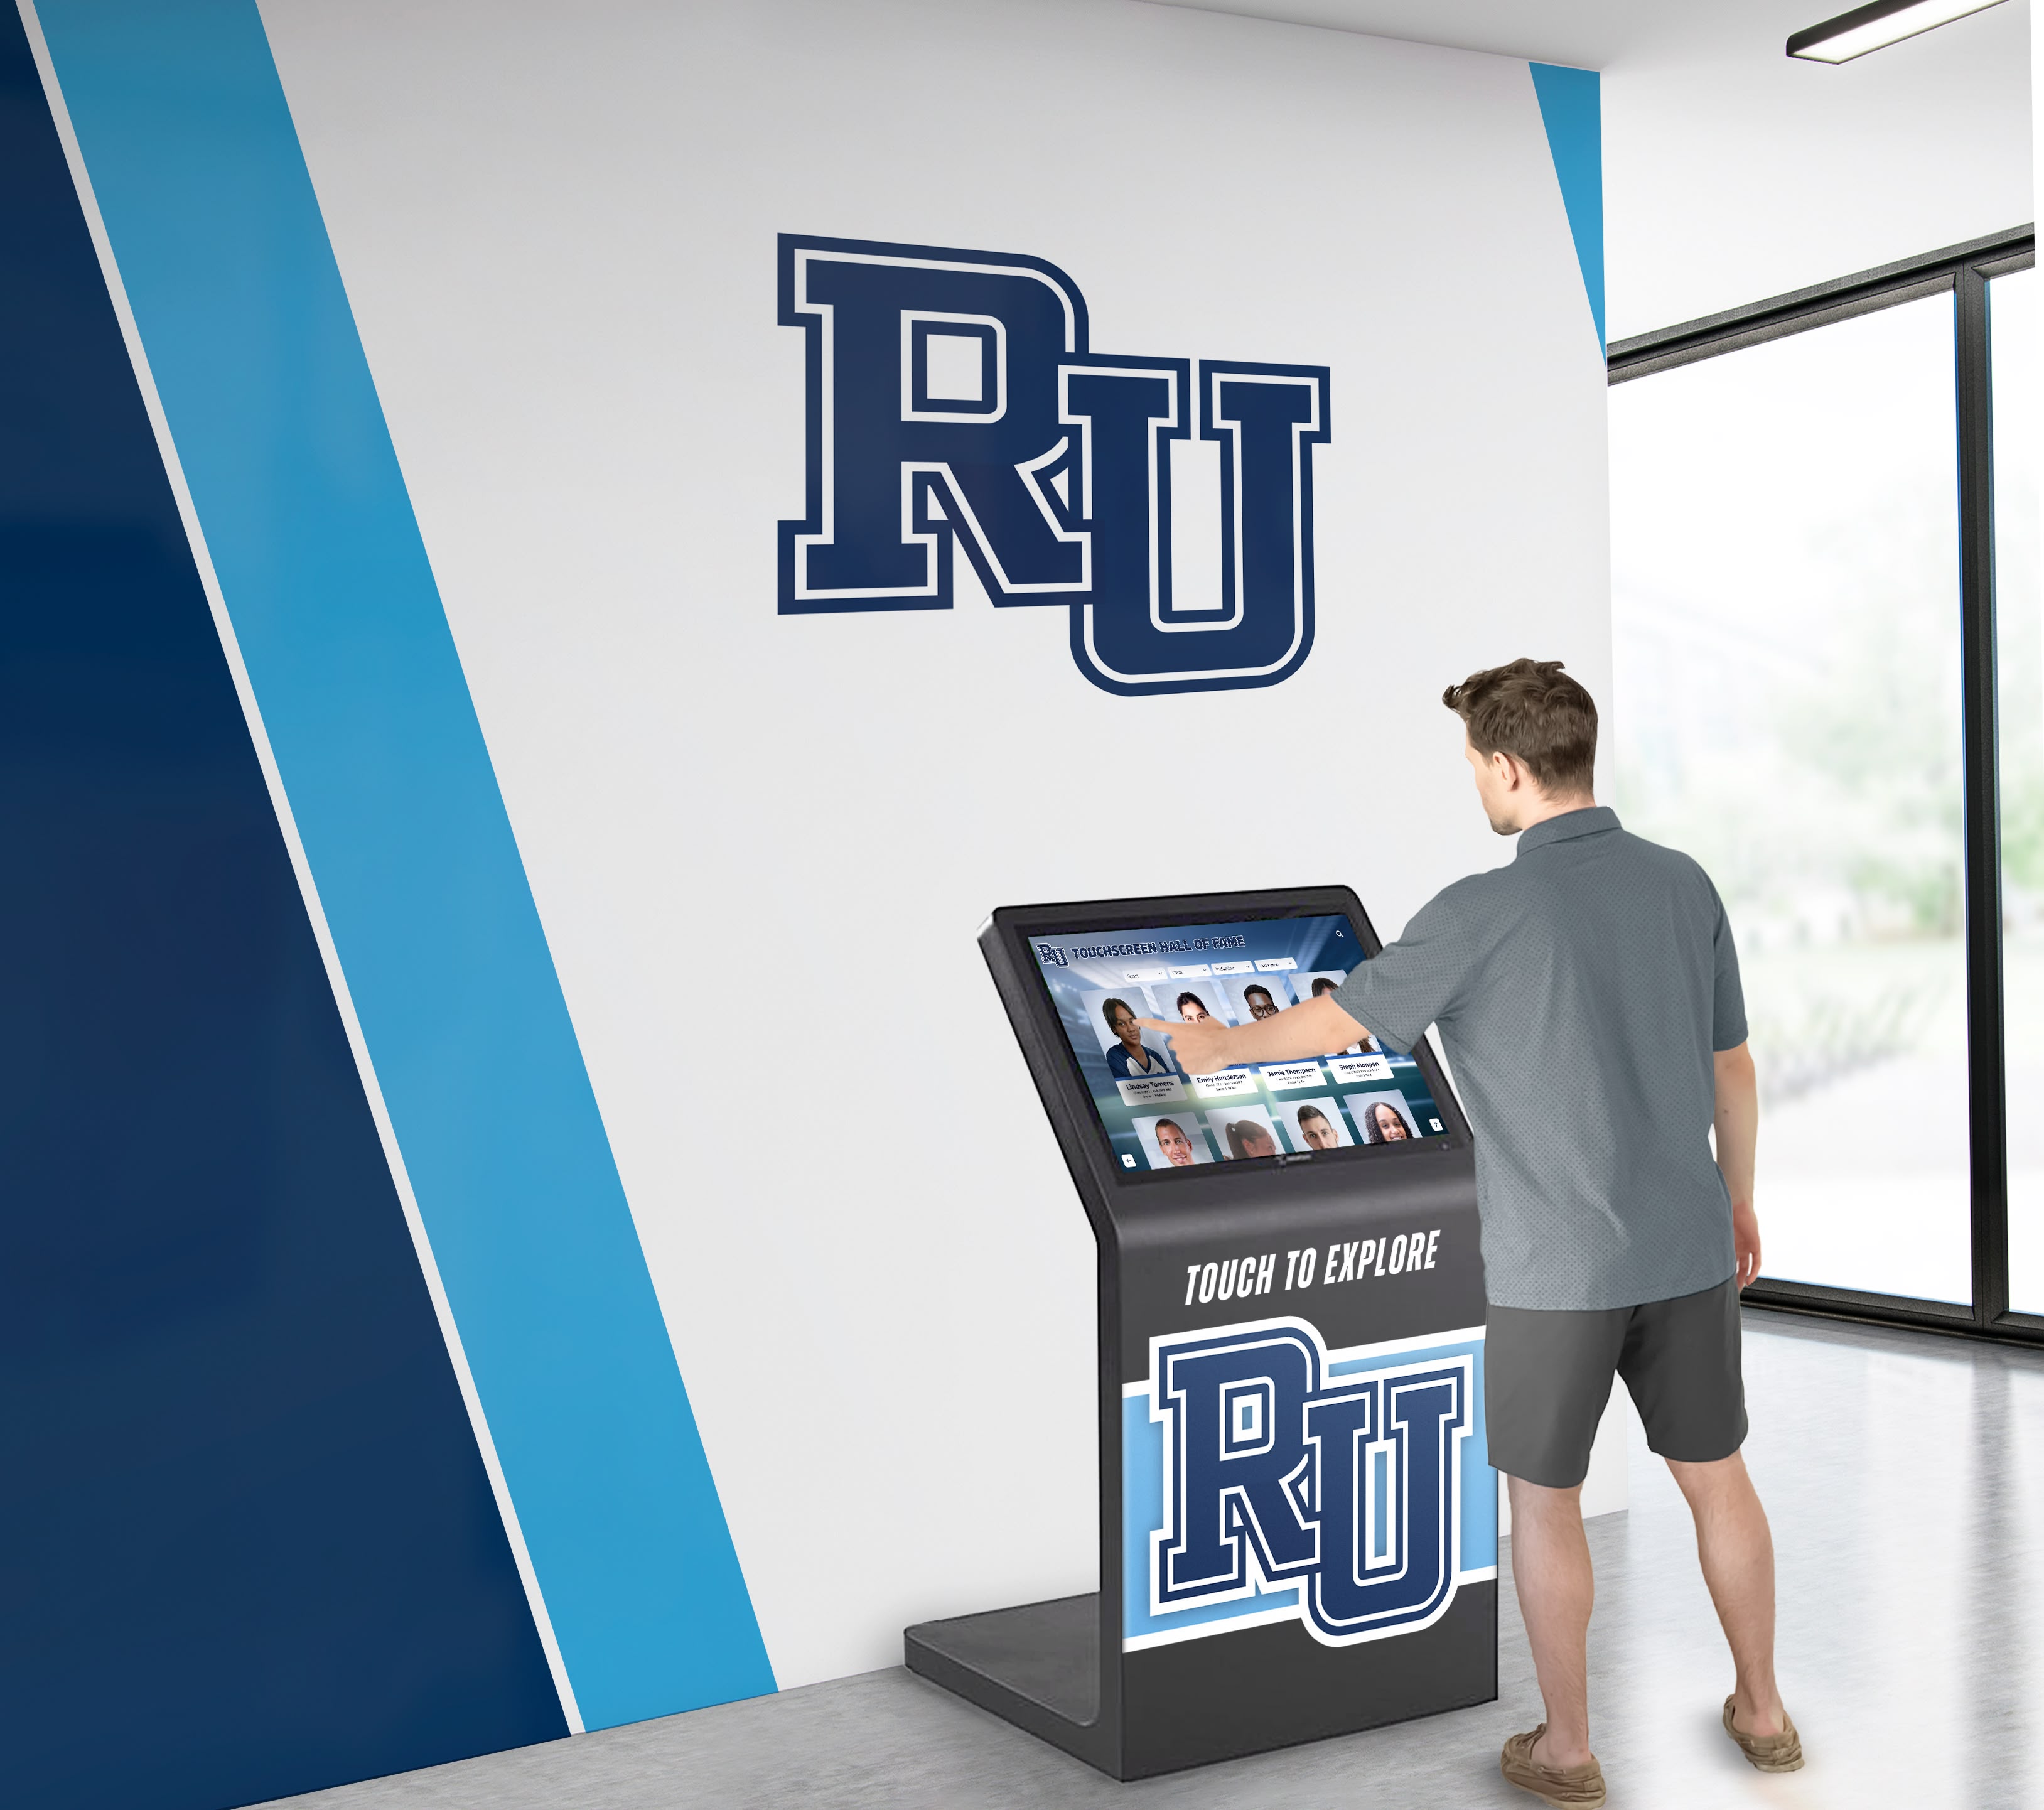
Tablet-Based Mobile Systems (24% of deployments): Commercial tablets (typically iPads or Android tablets) mounted on stands or provided for visitor checkout, running AR applications using device cameras and processors, offering flexibility for multi-location deployment, and enabling handheld interaction for different viewing perspectives.
Museums implementing tablet-based AR report average hardware costs of $800-$1,400 per device. While individual units cost less than fixed installations, multi-device deployments requiring fleet management, charging infrastructure, and theft prevention can approach fixed installation costs.
Bring-Your-Own-Device (BYOD) (8% of deployments): Visitor smartphone/tablet applications accessed via QR codes or app download, requiring no organizational hardware investment beyond markers or location beacons, depending on visitor device capabilities and willingness to download applications.
BYOD approaches minimize hardware costs but introduce challenges including variable device capabilities affecting experience quality, dependence on visitor willingness to download apps or use web-based AR, network bandwidth requirements if not pre-cached, and limited analytics on visitor engagement.
Engagement Metrics and Performance Analysis
User Interaction Duration
Quantitative engagement data from 64 installations with analytics tracking reveals substantial performance differences between touchscreen AR and alternative display technologies:
Touchscreen Augmented Reality Displays:
- Mean session duration: 6.8 minutes
- Median session duration: 5.4 minutes
- 75th percentile: 9.2 minutes
- 90th percentile: 13.7 minutes
Standard Interactive Touchscreens (without AR):
- Mean session duration: 1.6 minutes
- Median session duration: 1.2 minutes
- 75th percentile: 2.4 minutes
- 90th percentile: 3.8 minutes
Passive Digital Signage:
- Mean viewing duration: 0.9 minutes
- Median viewing duration: 0.6 minutes
- 75th percentile: 1.3 minutes
- 90th percentile: 2.1 minutes
Static Physical Displays:
- Mean viewing duration: 0.7 minutes
- Median viewing duration: 0.4 minutes
- 75th percentile: 1.0 minutes
- 90th percentile: 1.6 minutes
Touchscreen AR’s 325% engagement advantage over standard interactive displays and 671% advantage over static displays demonstrates the technology’s capacity to capture and sustain visitor attention significantly longer than conventional alternatives.

Engagement Depth and Content Exploration
Beyond session duration, touchscreen AR generates deeper content exploration:
Content Items Accessed Per Session:
- Touchscreen AR: Mean 7.4 distinct content elements
- Standard touchscreen: Mean 3.1 content elements
- Digital signage: Mean 1.2 content elements (passive viewing)
Interaction Events Per Session:
- Touchscreen AR: Mean 23.7 touch interactions, zooms, AR activations
- Standard touchscreen: Mean 8.3 touch interactions
- Digital signage: No interaction capability
Feature Utilization Rates (AR-specific capabilities):
- 3D object manipulation/rotation: 68% of users engage
- Layered information reveal: 73% of users engage
- Comparison/overlay modes (before/after, augmented view): 81% of users engage
- Gamification elements when present: 62% of users engage
Higher interaction counts and feature utilization indicate touchscreen AR creates more active exploration versus passive information consumption, suggesting visitors find the technology engaging rather than gimmicky or confusing.
Return Visit and Sharing Behavior
Repeat Engagement (installations tracking individual devices/users):
- 34% of touchscreen AR users return for additional sessions
- 18% of standard touchscreen users return
- 12% of digital signage viewers return to same content
Social Sharing (installations with sharing features):
- 23% of touchscreen AR sessions include content sharing (email, social media, QR code for later access)
- 9% of standard touchscreen sessions include sharing
- 6% of digital signage interactions prompt visitor-initiated sharing
Return visits and sharing behavior suggest touchscreen AR creates memorable experiences visitors choose to revisit or share with others, indicating engagement quality beyond simple duration metrics.
Demographic and Context Variables
Engagement patterns vary substantially by visitor demographics and installation context:
Age Group Performance:
Children (6-12 years):
- Touchscreen AR: 8.3 minutes mean duration (longest engagement segment)
- Standard touchscreen: 2.1 minutes
- Notable: Require adult guidance for optimal AR feature discovery
Teens (13-18 years):
- Touchscreen AR: 7.1 minutes mean duration
- Standard touchscreen: 1.8 minutes
- Notable: Most proficient with AR technology, highest feature utilization rates
Adults (19-64 years):
- Touchscreen AR: 6.2 minutes mean duration
- Standard touchscreen: 1.4 minutes
- Notable: Vary substantially by technical comfort; “tech-forward” segment shows longer engagement
Seniors (65+ years):
- Touchscreen AR: 5.4 minutes mean duration (still exceeds standard touchscreen by 244%)
- Standard touchscreen: 1.6 minutes
- Notable: Higher proportion abandon without engagement (18% vs. 7% overall), but those who engage show sustained interaction
Visit Context:
Solo visitors: 5.9 minutes mean AR engagement Small groups (2-4): 7.8 minutes mean AR engagement (longest; social interaction enhances experience) Large groups (5+): 4.2 minutes mean AR engagement (logistics constraints limit individual time) School/organized tours: 6.1 minutes mean AR engagement (guided introduction increases success)
Organizations can optimize AR implementations by considering primary audience demographics and typical visit contexts, designing experiences matching visitor technical proficiency and social dynamics.
Implementation Costs and Financial Analysis
Total Implementation Investment
Touchscreen AR display implementation costs vary dramatically based on technical approach, hardware specifications, content complexity, and organizational factors:
Marker-Based Systems (most cost-effective approach):
- Hardware (touchscreen, camera, computer): $4,200-$12,000
- Software/licensing: $1,200-$4,800 (first year)
- Content development: $3,000-$18,000 (depends on element count and complexity)
- Installation and calibration: $800-$3,200
- Training and documentation: $400-$1,600 Total typical range: $8,400-$34,000 Median: $14,200
Markerless Spatial AR (mid-range performance and cost):
- Hardware (touchscreen, depth cameras/LiDAR, computing): $12,000-$28,000
- Software/licensing: $3,600-$12,000 (first year)
- Content development: $8,000-$32,000
- Installation and calibration: $2,400-$6,800
- Training and documentation: $800-$2,400 Total typical range: $24,000-$68,000 Median: $38,700
Hybrid Approaches (flexible but complex):
- Hardware (multiple systems integrated): $14,000-$38,000
- Software/licensing: $4,800-$18,000 (first year)
- Content development: $12,000-$48,000
- Installation and calibration: $3,200-$9,600
- Training and documentation: $1,200-$3,600 Total typical range: $28,000-$94,000 Median: $51,200
These ranges assume single-display installations. Organizations deploying multiple AR displays benefit from economies of scale on software licensing, content development amortization, and organizational learning reducing per-display implementation time.
Ongoing Operational Costs
Beyond initial implementation, organizations incur annual operational expenses maintaining touchscreen AR installations:
Annual Software/Platform Licensing:
- Marker-based systems: $1,200-$3,600
- Spatial AR systems: $2,400-$8,400
- Enterprise platforms with analytics: $4,800-$18,000
Content Updates and Maintenance:
- Minor updates (quarterly): $1,200-$3,600 annually
- Moderate updates (bi-annual significant additions): $2,400-$8,400 annually
- Major refreshes (annual substantial changes): $4,800-$24,000 annually
Organizations report mean annual content investment of $4,700, with variation based on content update frequency and whether updates occur in-house versus outsourced to developers.
Hardware Maintenance and Replacement:
- Commercial touchscreen warranty/service: $400-$1,200 annually
- Computing hardware maintenance: $200-$800 annually
- Camera/sensor calibration and service: $300-$1,200 annually
- Estimated replacement reserve (5-7 year lifecycle): $800-$2,400 annually
Technical Support and Administration:
- Organizations with IT staff: 0.10-0.15 FTE annual time allocation
- Organizations outsourcing support: $2,400-$8,400 annual contracts
- Monitoring, troubleshooting, and optimization: Variable based on installation complexity
Five-year total cost of ownership (TCO) calculations:
Marker-Based System TCO:
- Initial implementation: $14,200
- Annual operational costs × 5: $18,500 (mean $3,700/year)
- 5-Year TCO: $32,700
- Per-year amortized: $6,540
Spatial AR System TCO:
- Initial implementation: $38,700
- Annual operational costs × 5: $31,500 (mean $6,300/year)
- 5-Year TCO: $70,200
- Per-year amortized: $14,040
These projections enable organizations to assess whether touchscreen AR’s engagement benefits justify 2.8-3.6x cost premium versus standard interactive displays ($8,000-$18,000 five-year TCO).
Implementation Timeline and Process
Typical Project Phases
Successful touchscreen AR implementations follow structured phases with realistic timeline expectations:
Phase 1: Planning and Design (4-8 weeks)
Activities include defining objectives and success metrics, conducting audience analysis and use case definition, selecting technical approach and platform, developing content strategy and information architecture, creating detailed specifications and requirements, and securing vendor selection or internal resource allocation.
Organizations that invest adequate planning time experience 63% fewer implementation delays and 47% higher user satisfaction scores compared to rushed implementations proceeding directly to development.
Phase 2: Content Development (8-16 weeks)
This phase consistently represents the critical path for implementation timelines, including scripting and storyboarding AR experiences, creating 3D models, animations, or digital overlays, developing interactive logic and user experience flows, producing audio, video, or multimedia elements, and conducting internal content review and revision cycles.
Content complexity determines timeline variance: simple marker-based information overlays average 8-10 weeks, while sophisticated spatial AR with extensive 3D modeling and animation require 14-18 weeks or longer.
Organizations with existing digital asset libraries (3D models, photography, video) report 30% faster content development versus those creating all assets from scratch.
Phase 3: Technical Implementation (4-8 weeks)
Hardware procurement, installation, and configuration, software platform setup and customization, AR calibration and spatial mapping (for markerless systems), content integration and testing, network connectivity and security configuration, and quality assurance across use cases and conditions.
Technical complexity and organizational IT policies significantly affect this phase. Organizations with restrictive network security, complex approval processes, or limited IT support availability report mean 6.2 weeks additional time versus those with streamlined technical operations.
Phase 4: Testing and Refinement (2-4 weeks)
Internal staff testing across user scenarios, external user testing with representative audience members, accessibility evaluation and compliance verification, performance optimization and bug resolution, documentation creation for staff and maintenance, and final acceptance and signoff procedures.
Organizations conducting formal user testing report 34% higher engagement metrics post-launch compared to those skipping this phase, validating investment in pre-launch refinement.
Phase 5: Launch and Training (1-2 weeks)
Staff training on operation and visitor assistance, soft launch with limited audience, monitoring initial user interactions and gathering feedback, making rapid adjustments based on early observations, and full public launch with promotional communications.
Total Typical Timeline: 19-38 weeks (4.5-9 months) from project initiation to full operational launch.
Organizations report median 28 weeks actual implementation time. Factors accelerating timelines include prior AR experience reducing learning curve, dedicated project management ensuring coordination, pre-existing content reducing development requirements, and vendor-provided implementation services versus entirely internal execution.
Common Implementation Challenges
Technical Integration Complexity (reported by 43% of implementations):
- AR platform compatibility with organizational IT infrastructure
- Network bandwidth or latency affecting performance
- Camera/sensor calibration difficulties in actual installation environment
- Device management and security configuration
Organizations address these challenges through early IT involvement in planning, vendor technical support during implementation, pilot testing in actual environment before full deployment, and documented troubleshooting procedures for ongoing support.
Content Development Underestimation (reported by 58% of implementations):
- Initial timeline and budget projections prove inadequate for content complexity
- Iterative development cycles extend beyond expectations
- Asset creation (3D modeling, animation) requires specialized skills
- Content revision based on user testing adds time
Realistic content planning and adequate contingency allocation (25-30% time buffer) mitigate these challenges. Organizations without internal 3D modeling or animation expertise should budget for external content development resources.
User Experience Design Challenges (reported by 37% of implementations):
- Balancing technological sophistication with intuitive usability
- Designing for visitors unfamiliar with AR technology
- Accommodating diverse technical proficiency levels
- Physical ergonomics and accessibility requirements
Professional UX design services, user testing with representative audiences, and iterative refinement based on feedback address these challenges. Organizations that include accessibility specialists during design report 89% ADA compliance versus 47% for those addressing accessibility retroactively.
Use Case Performance Analysis
Educational Institutions
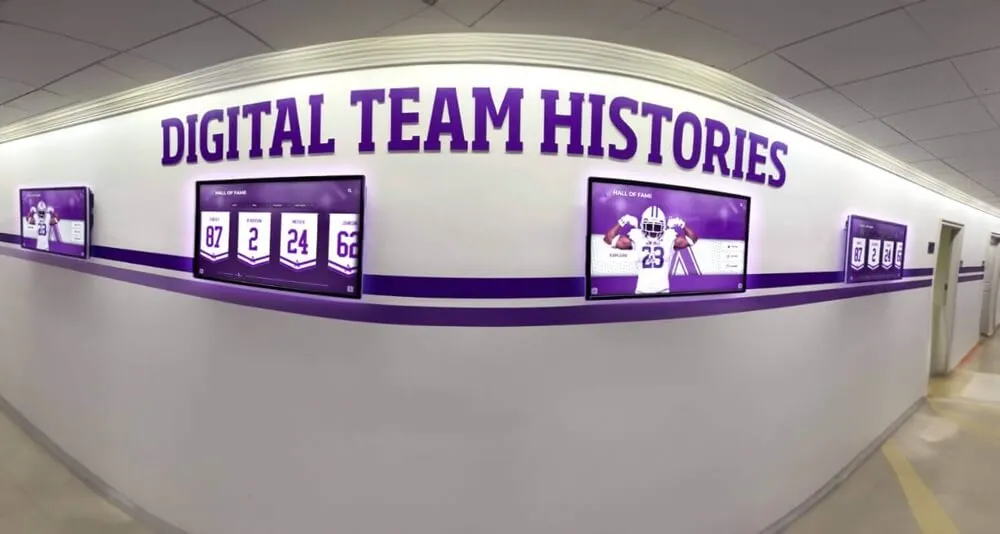
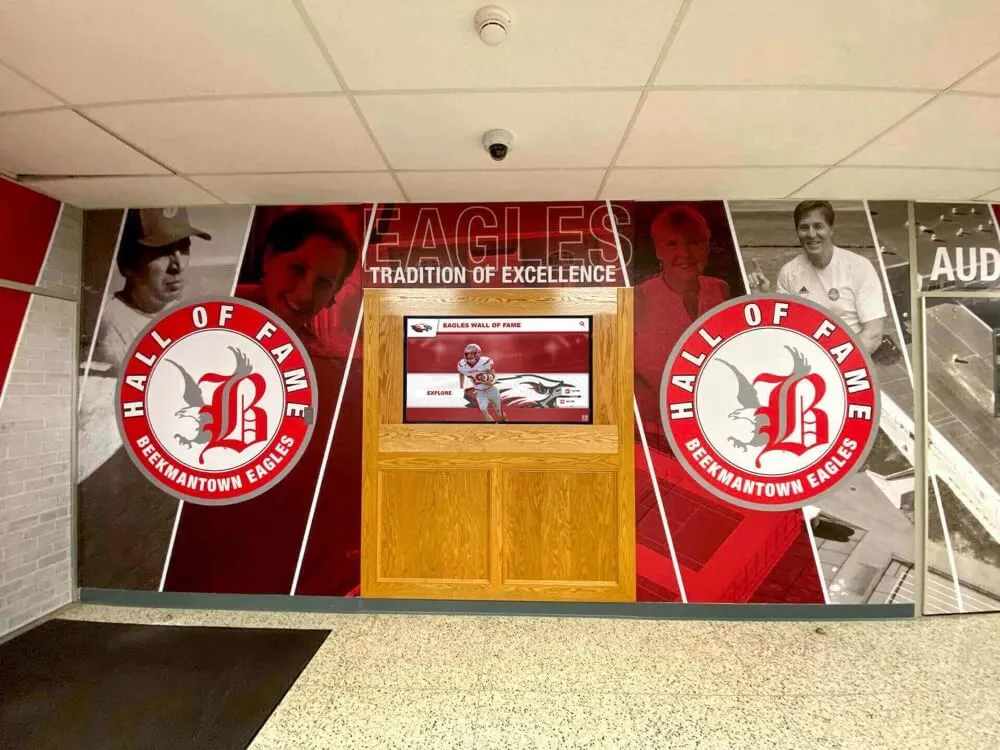
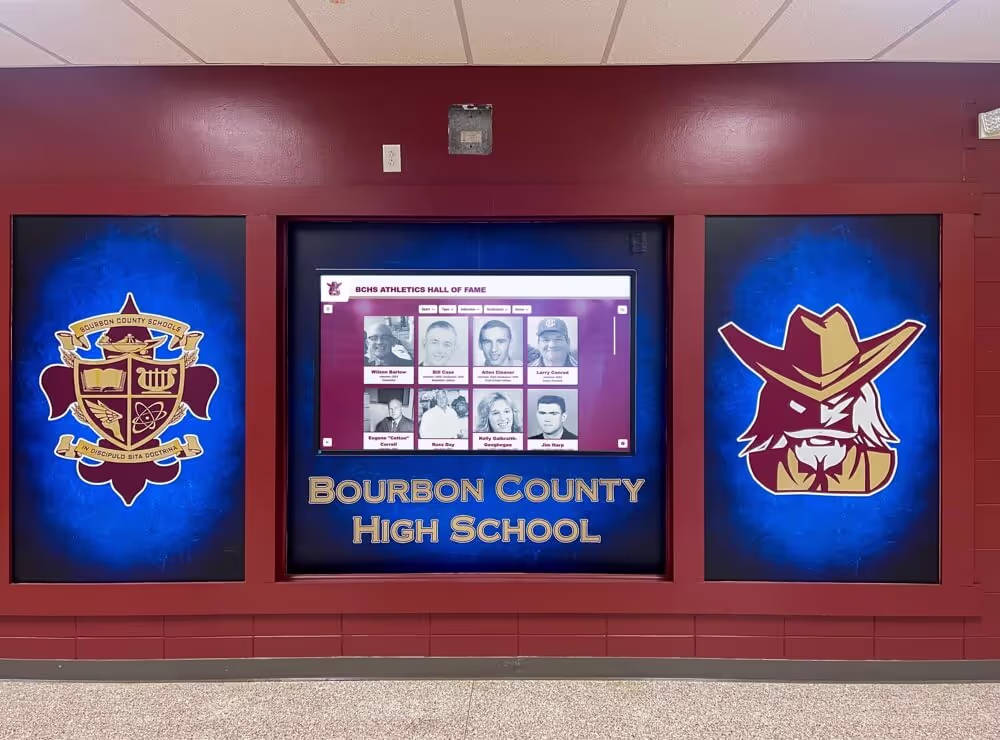
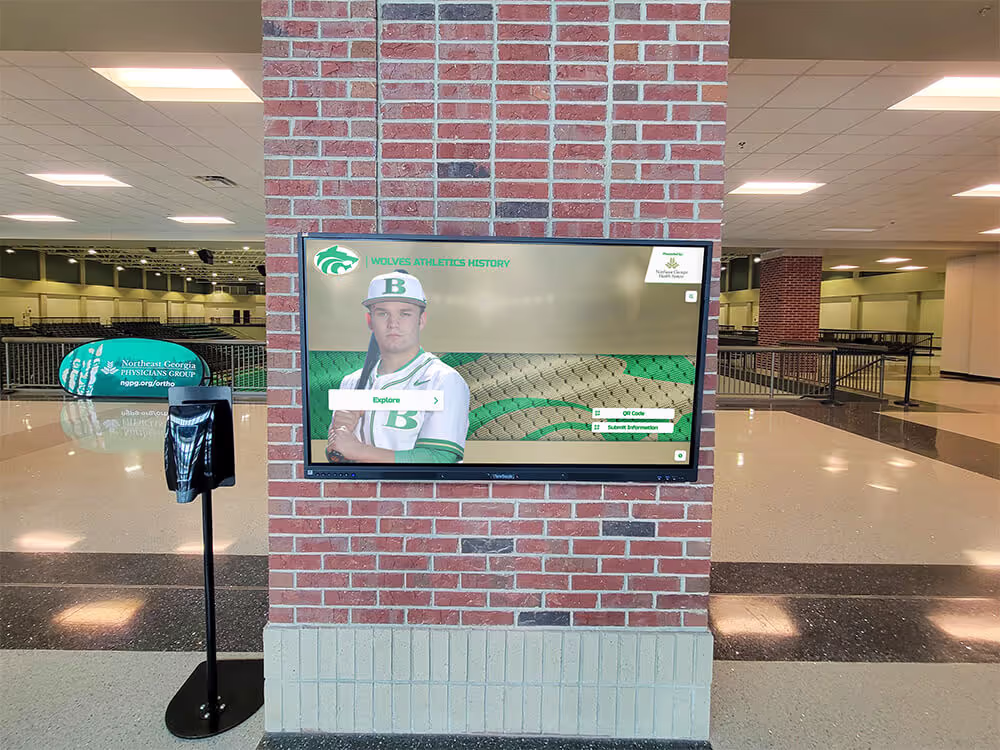
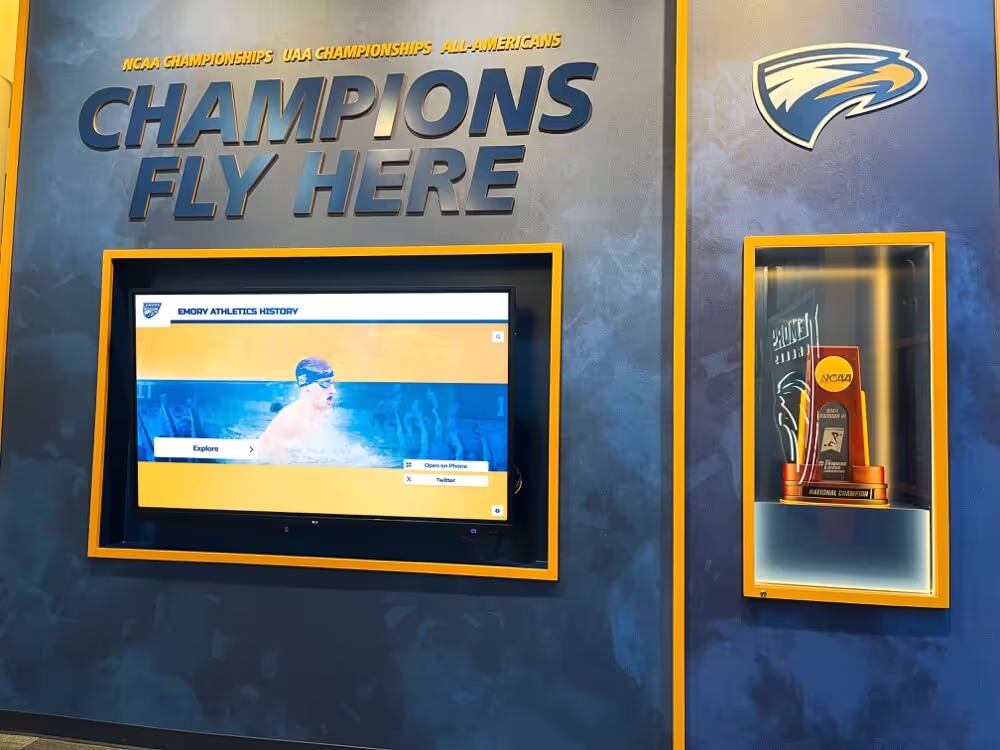
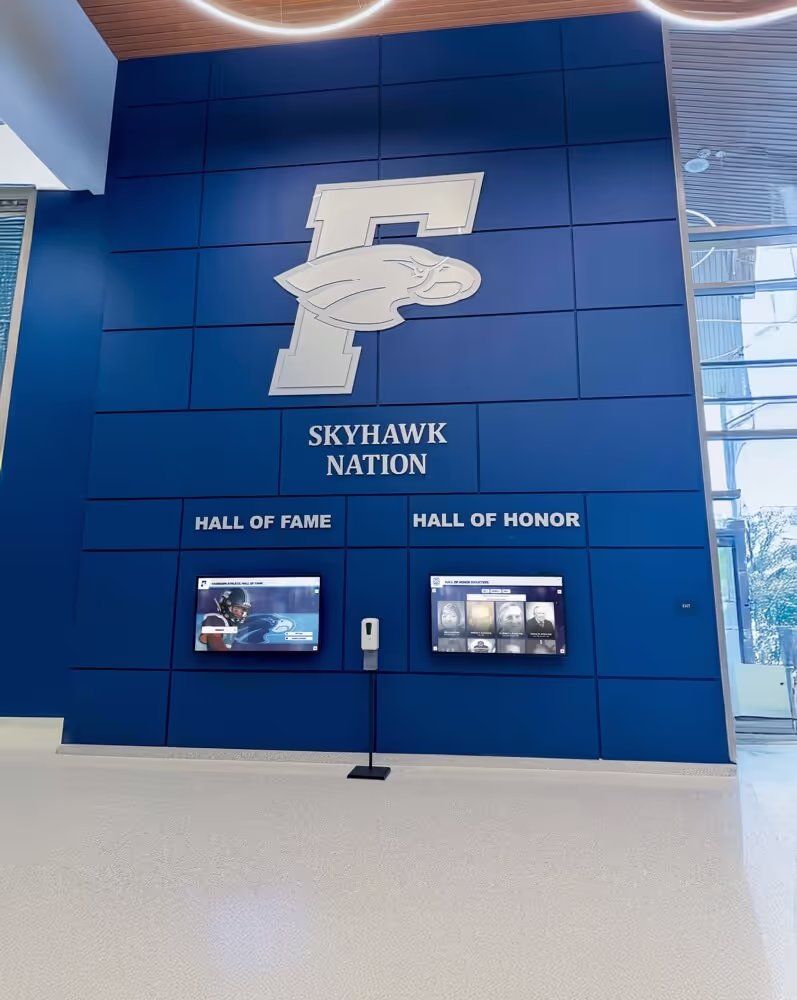
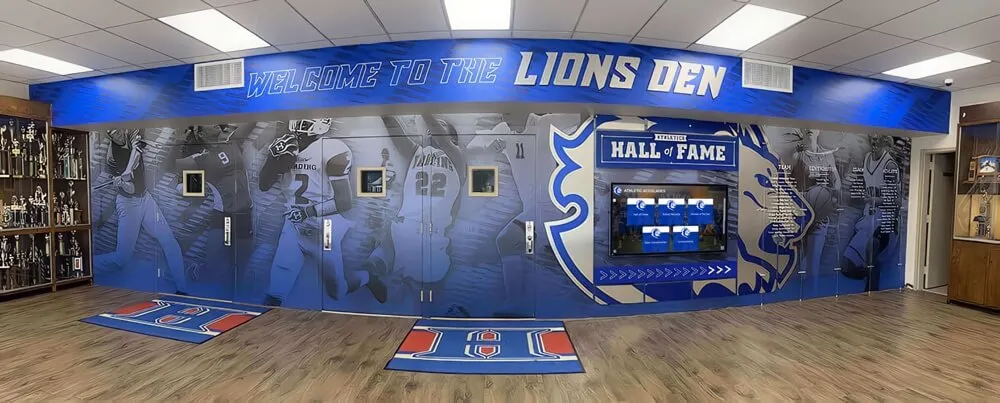
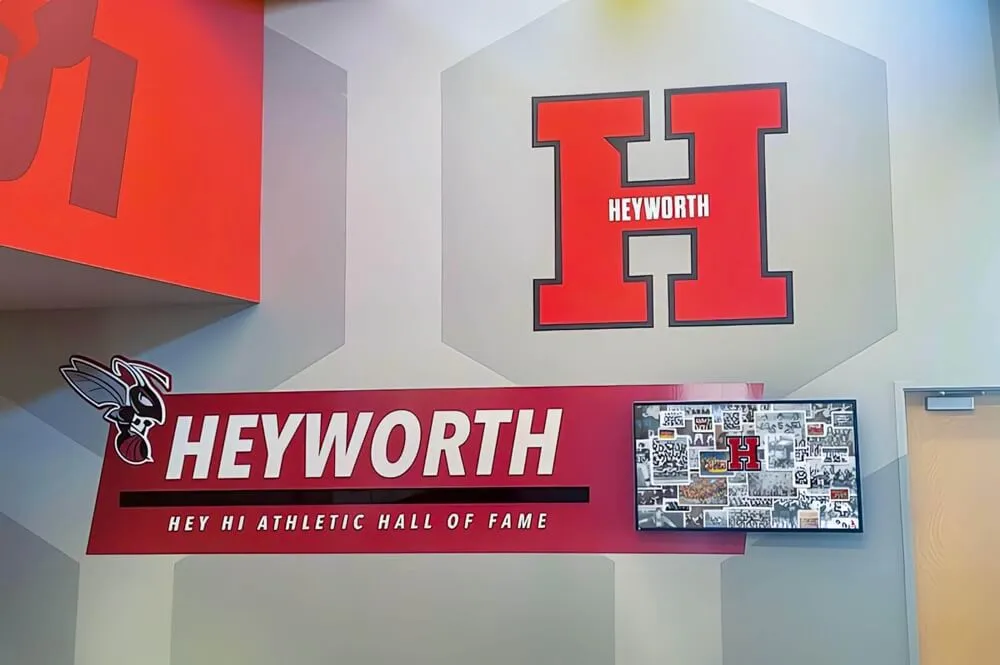
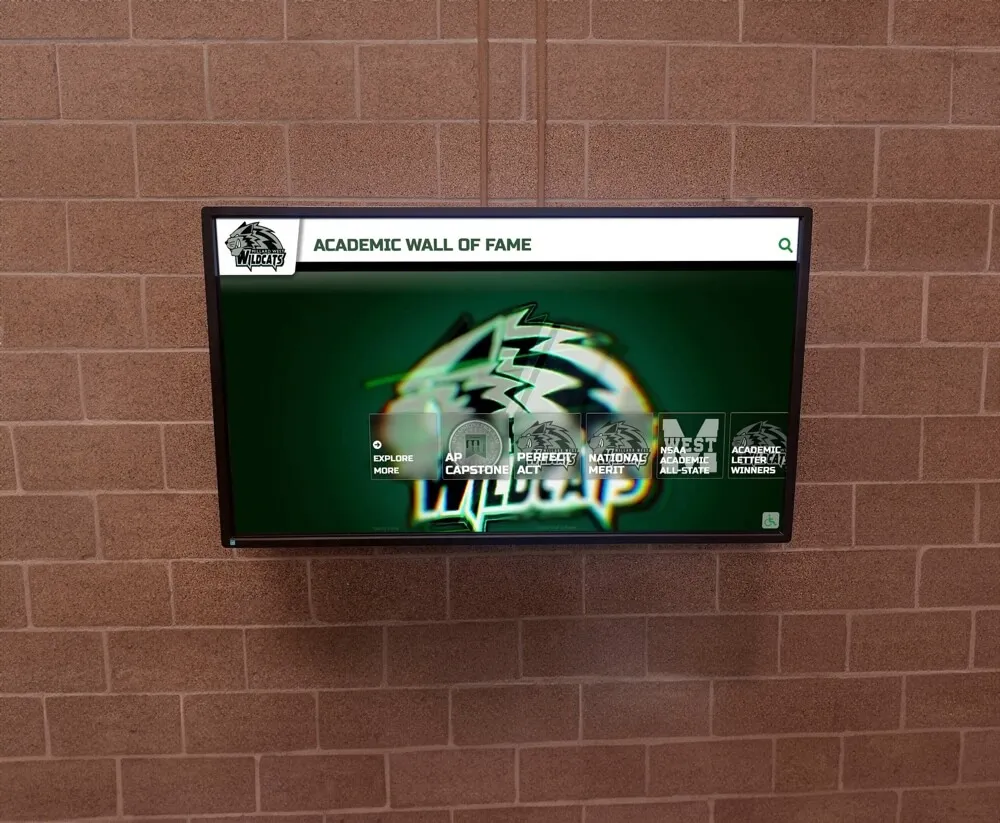
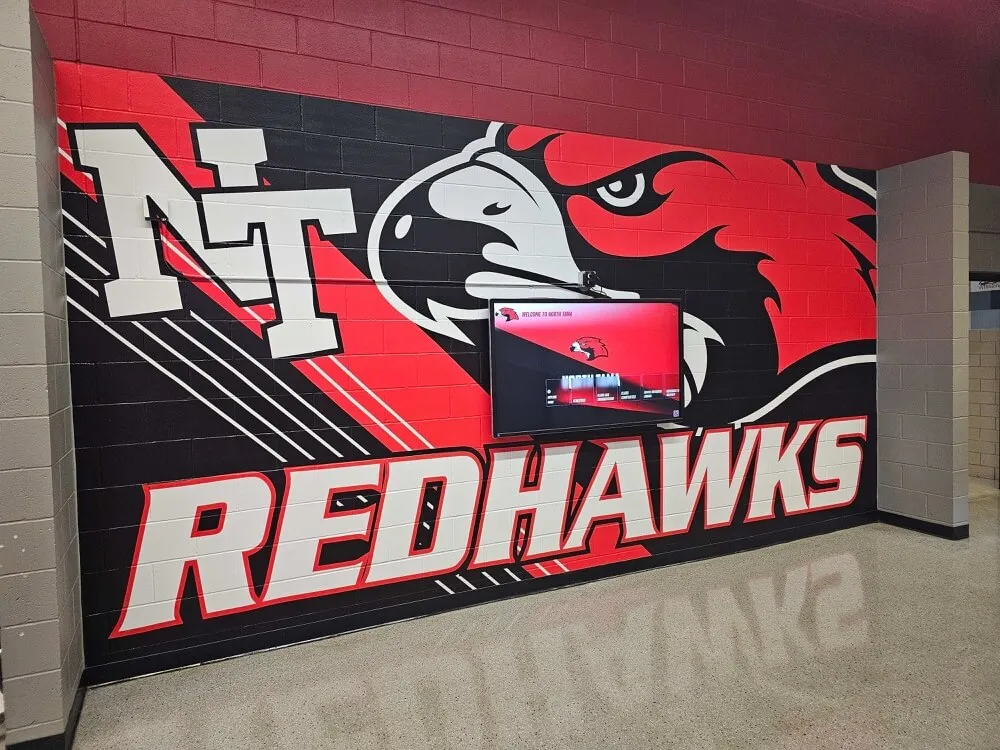
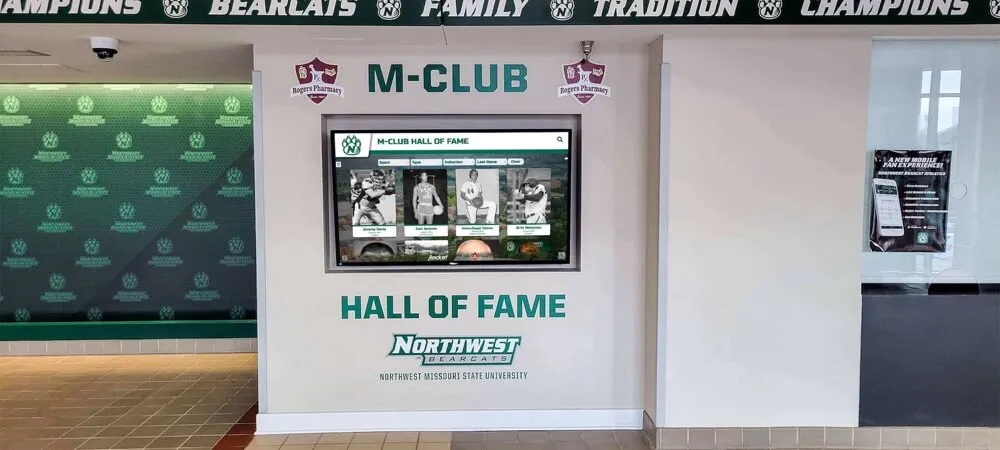
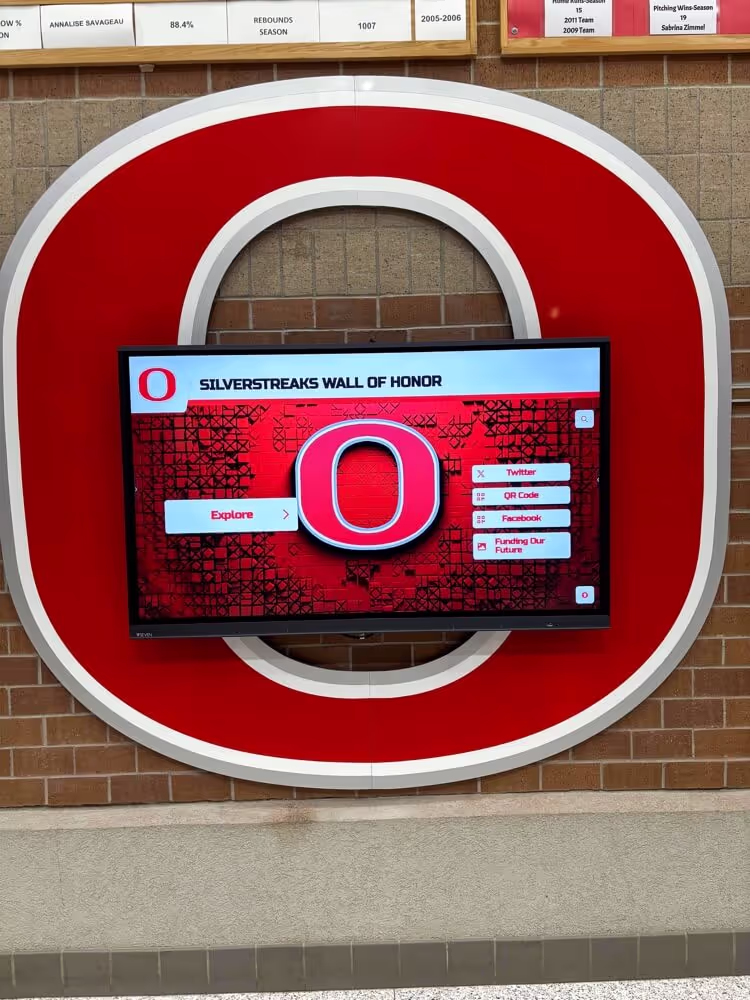
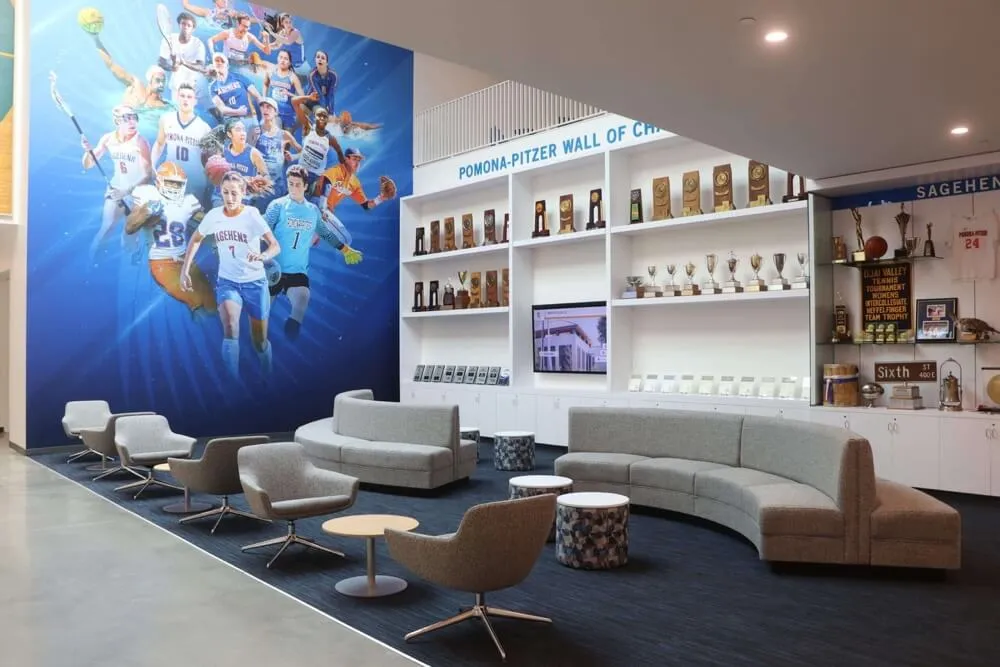
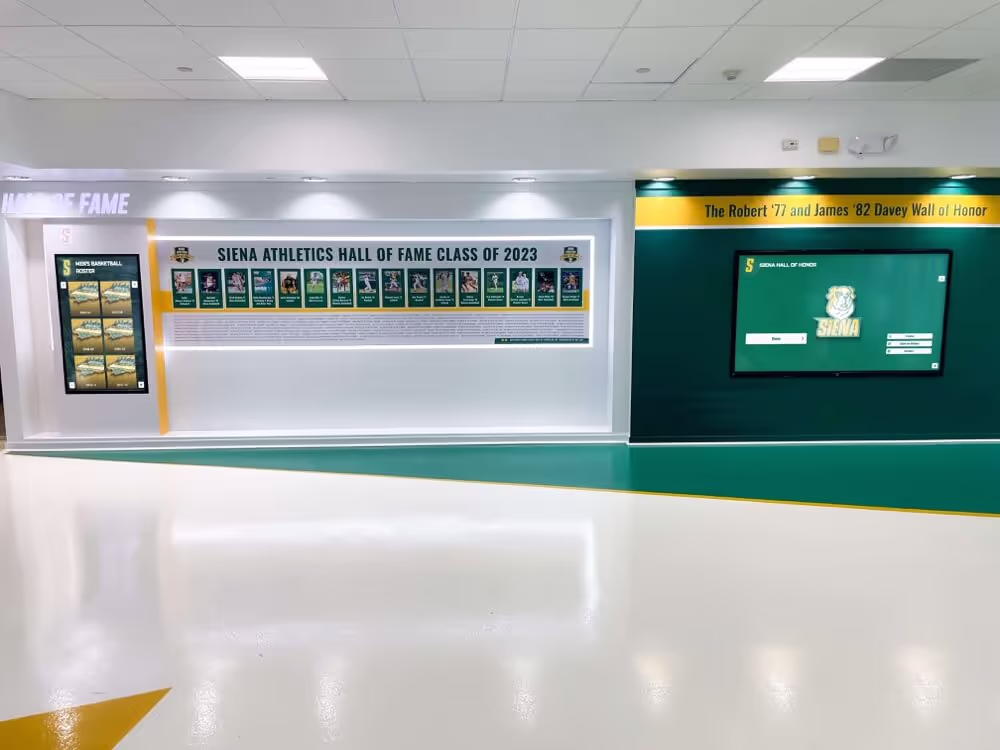
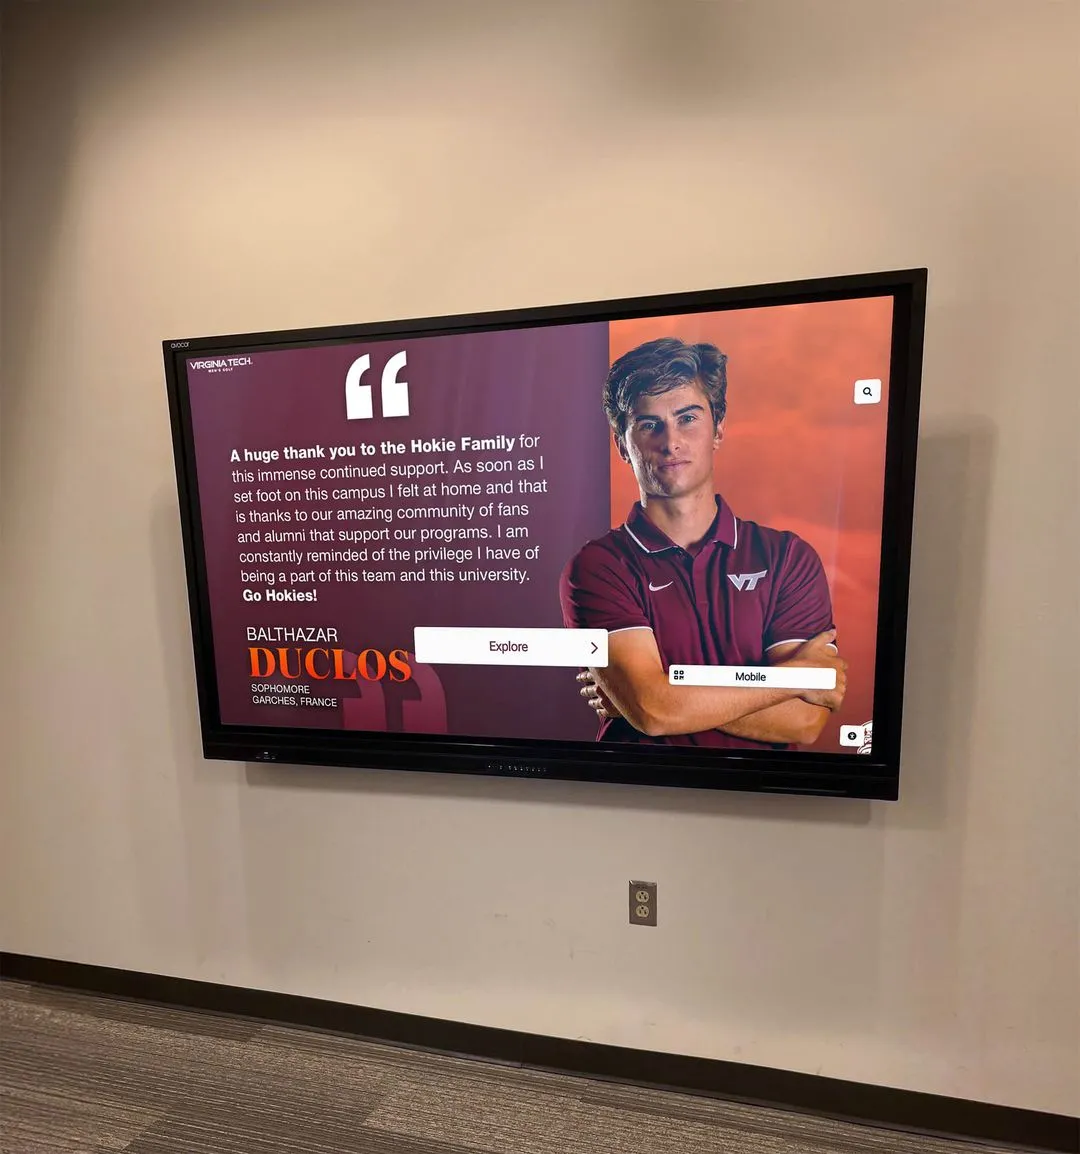
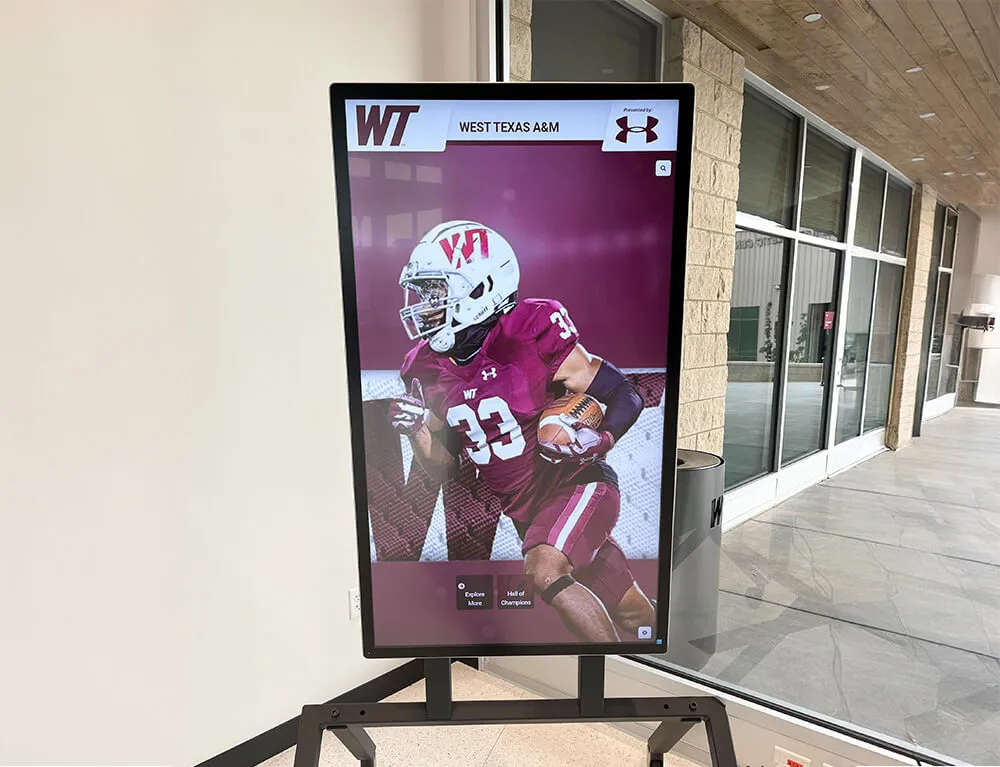
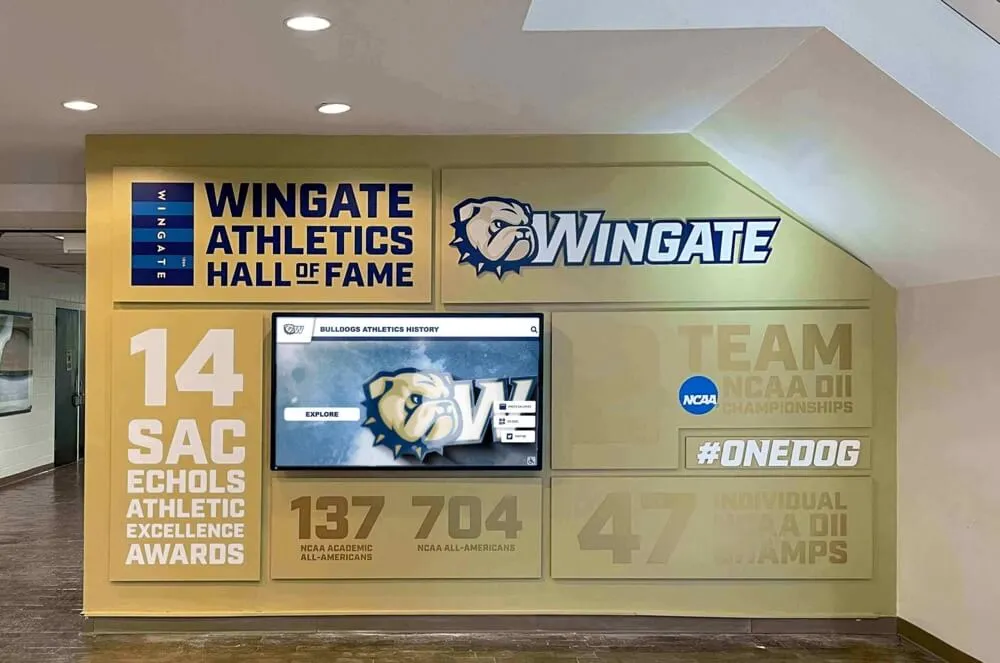
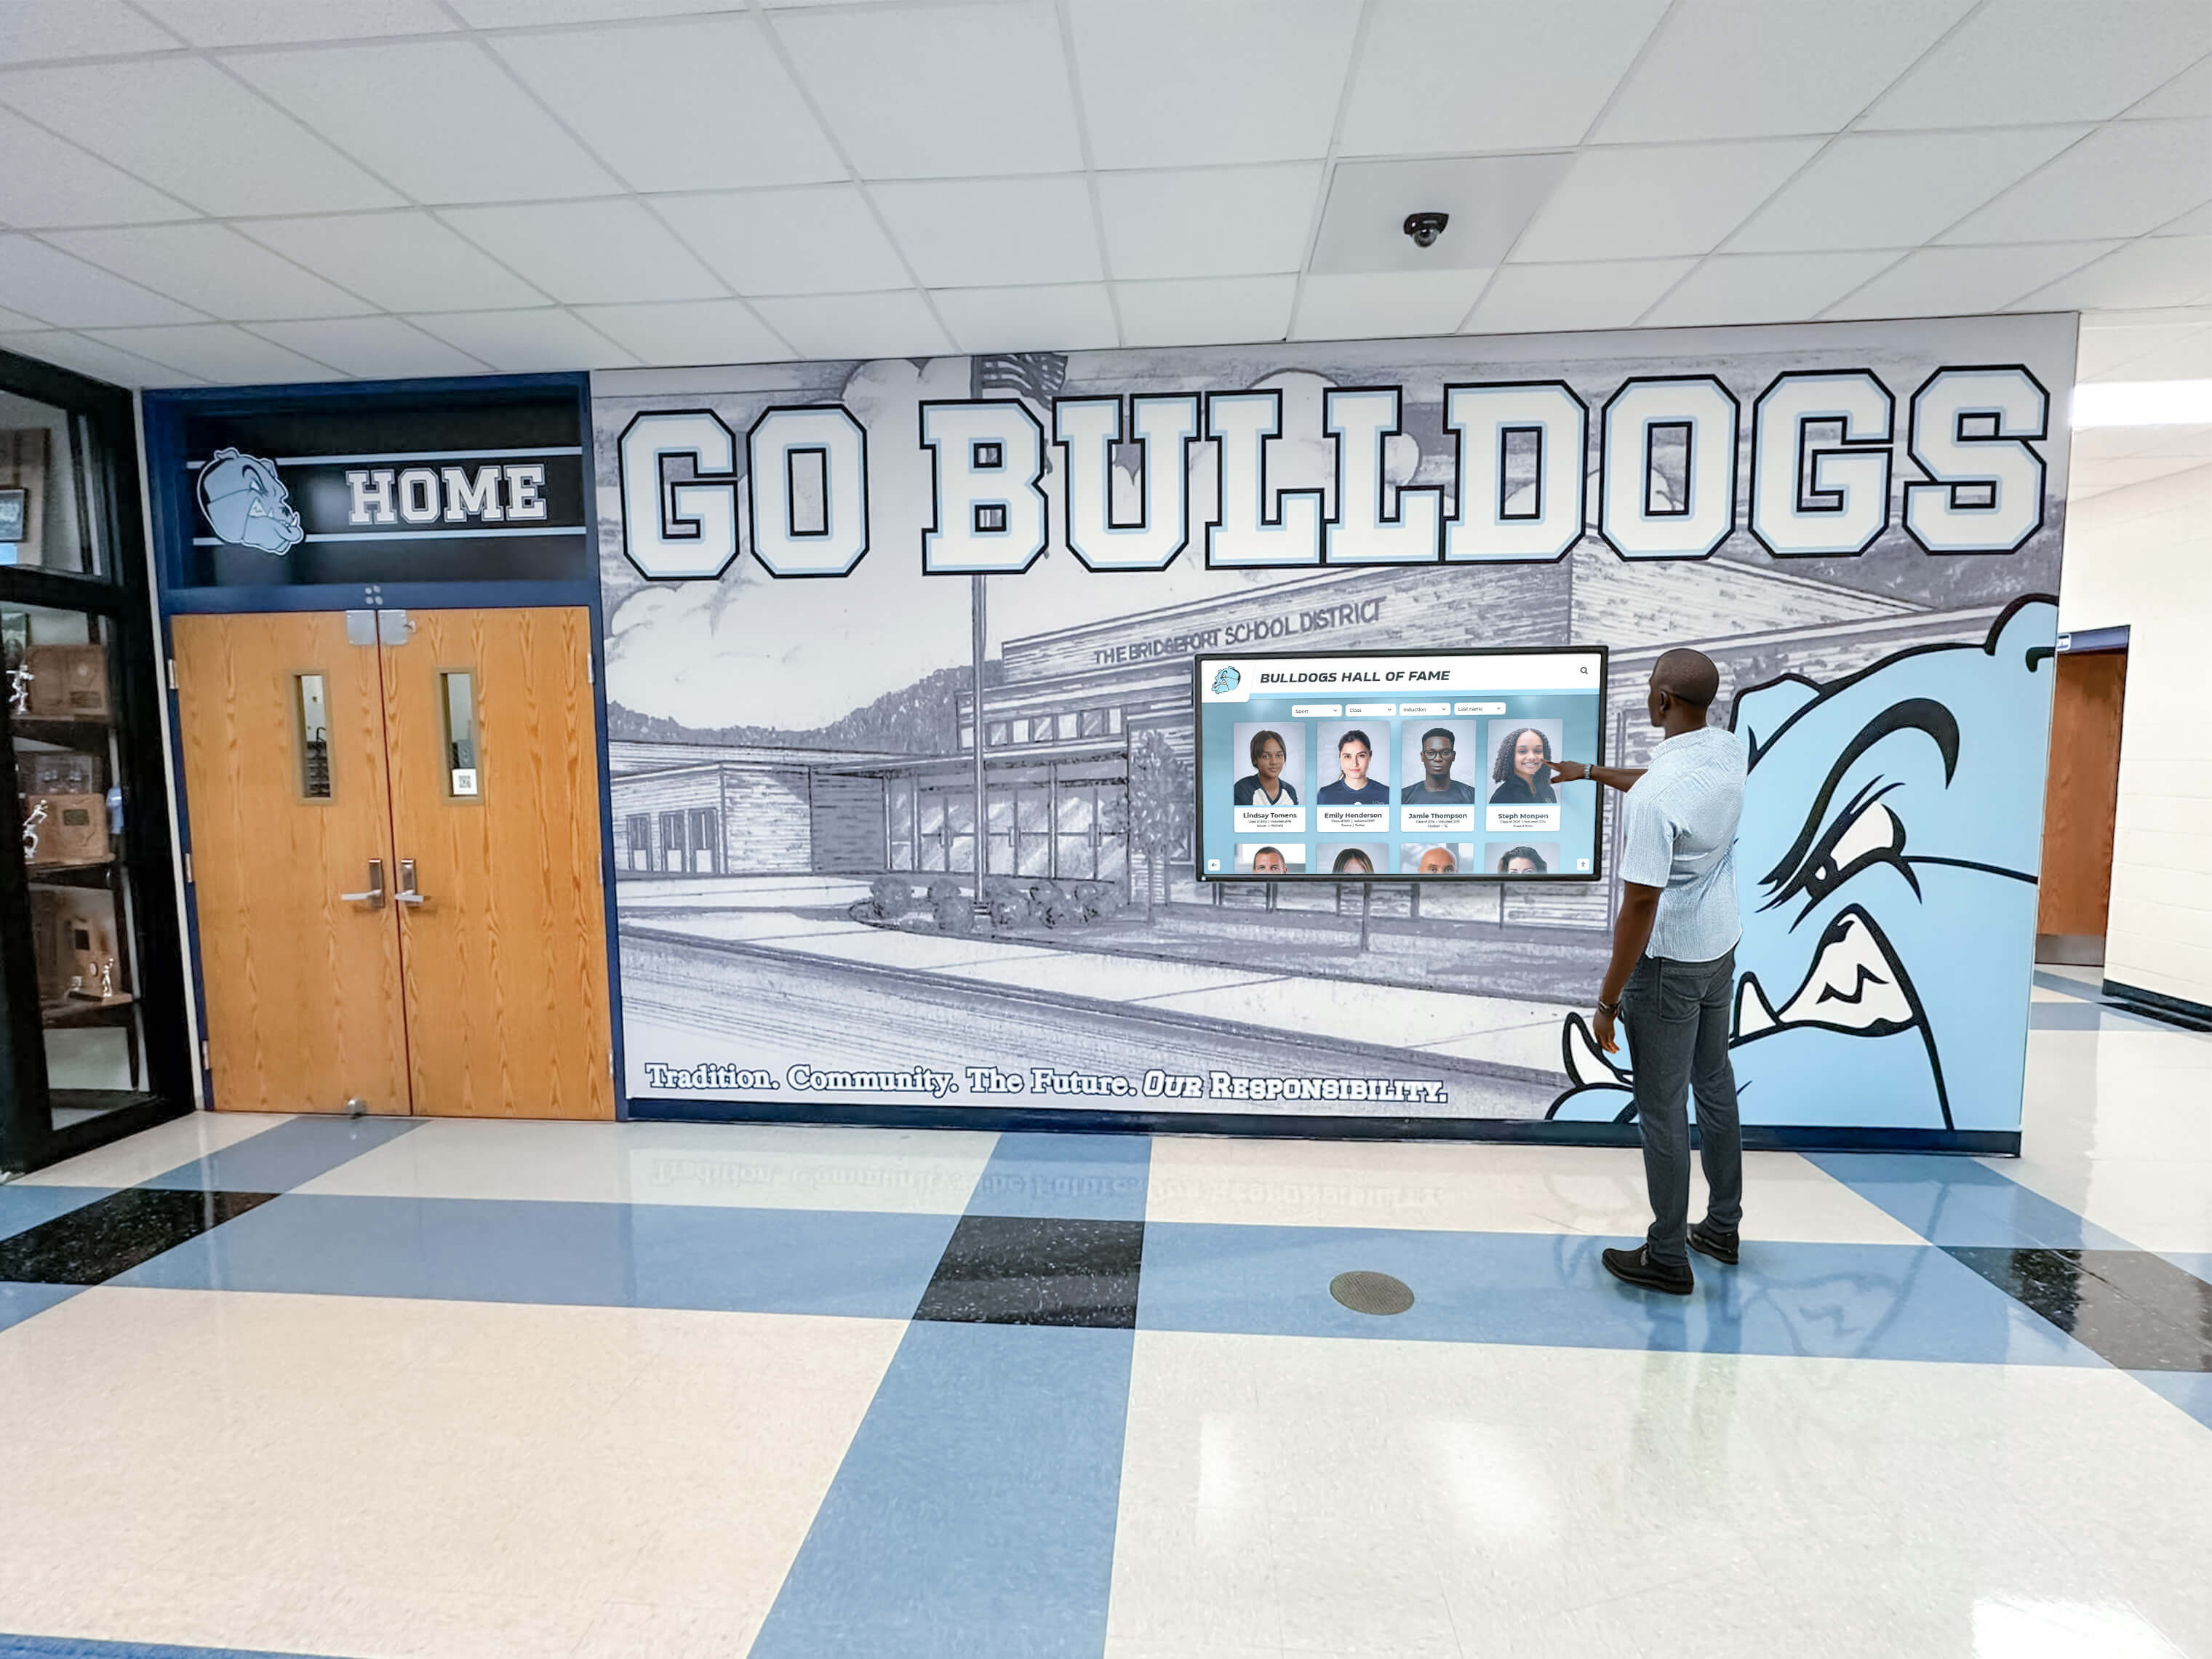
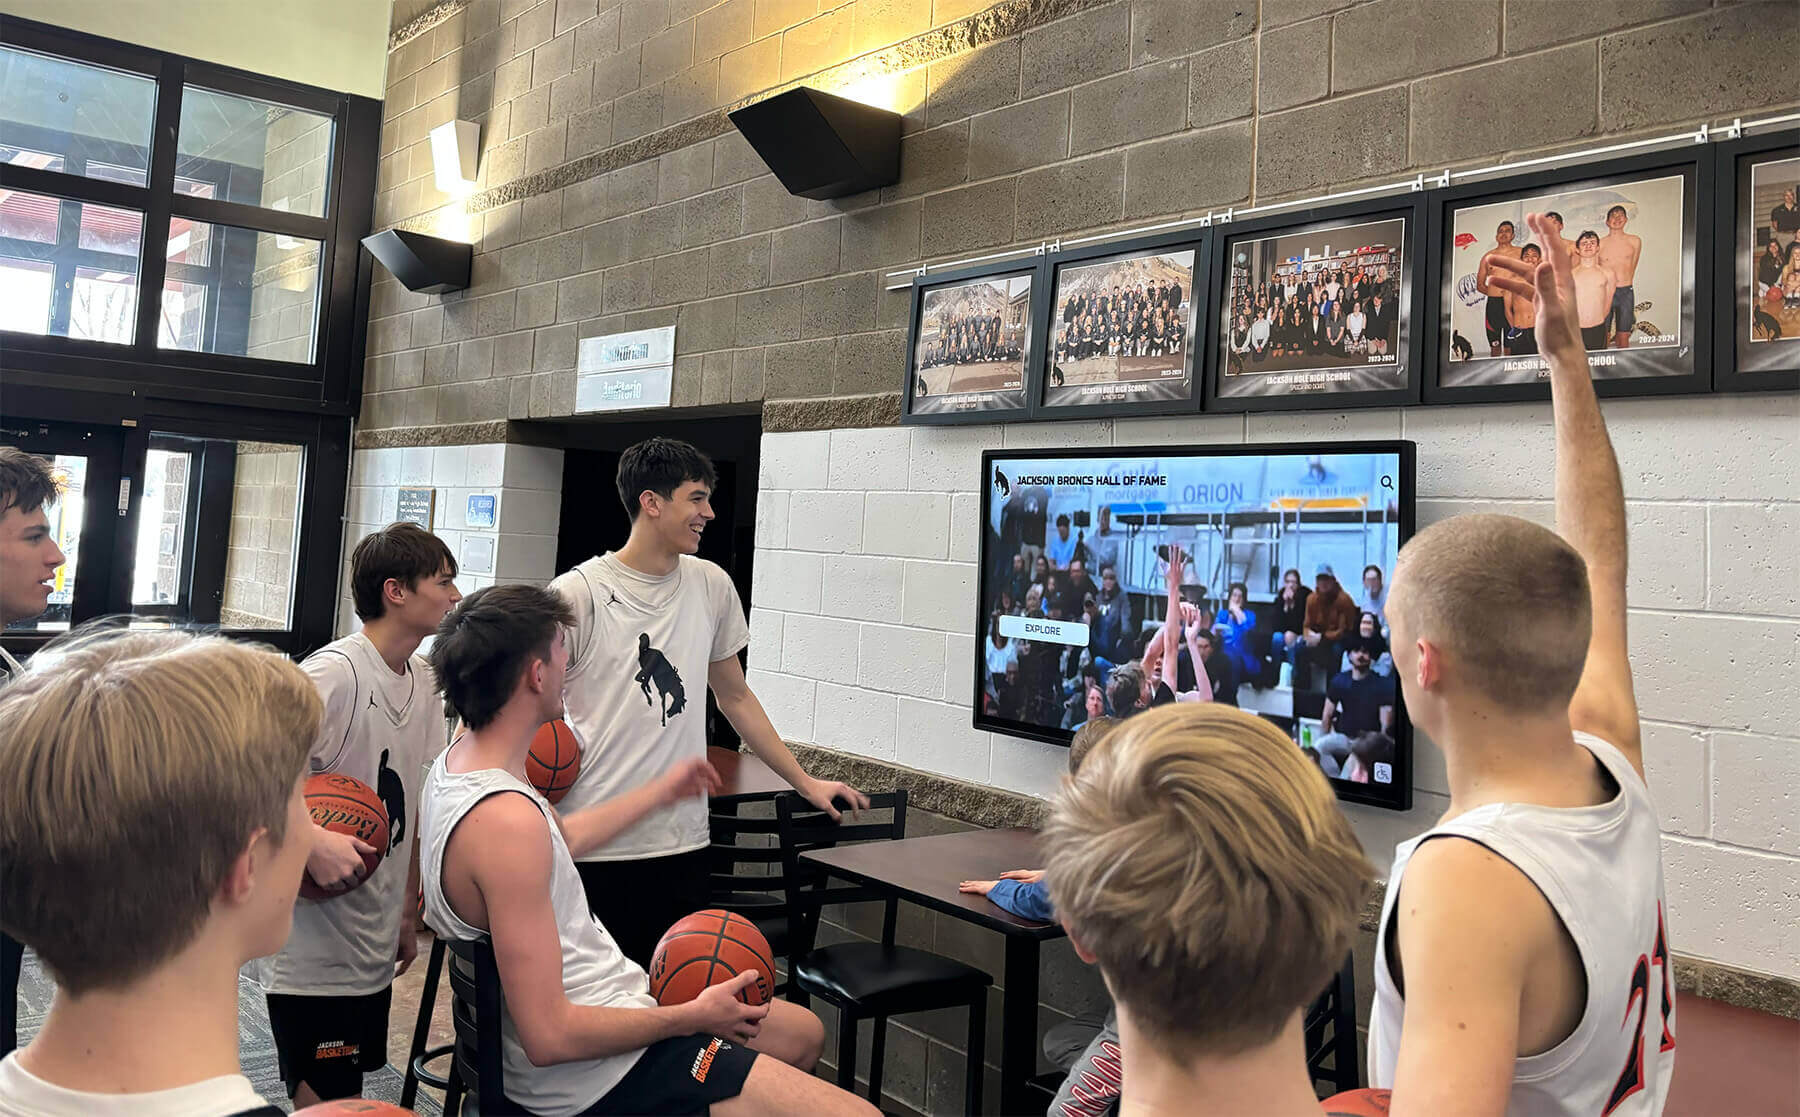
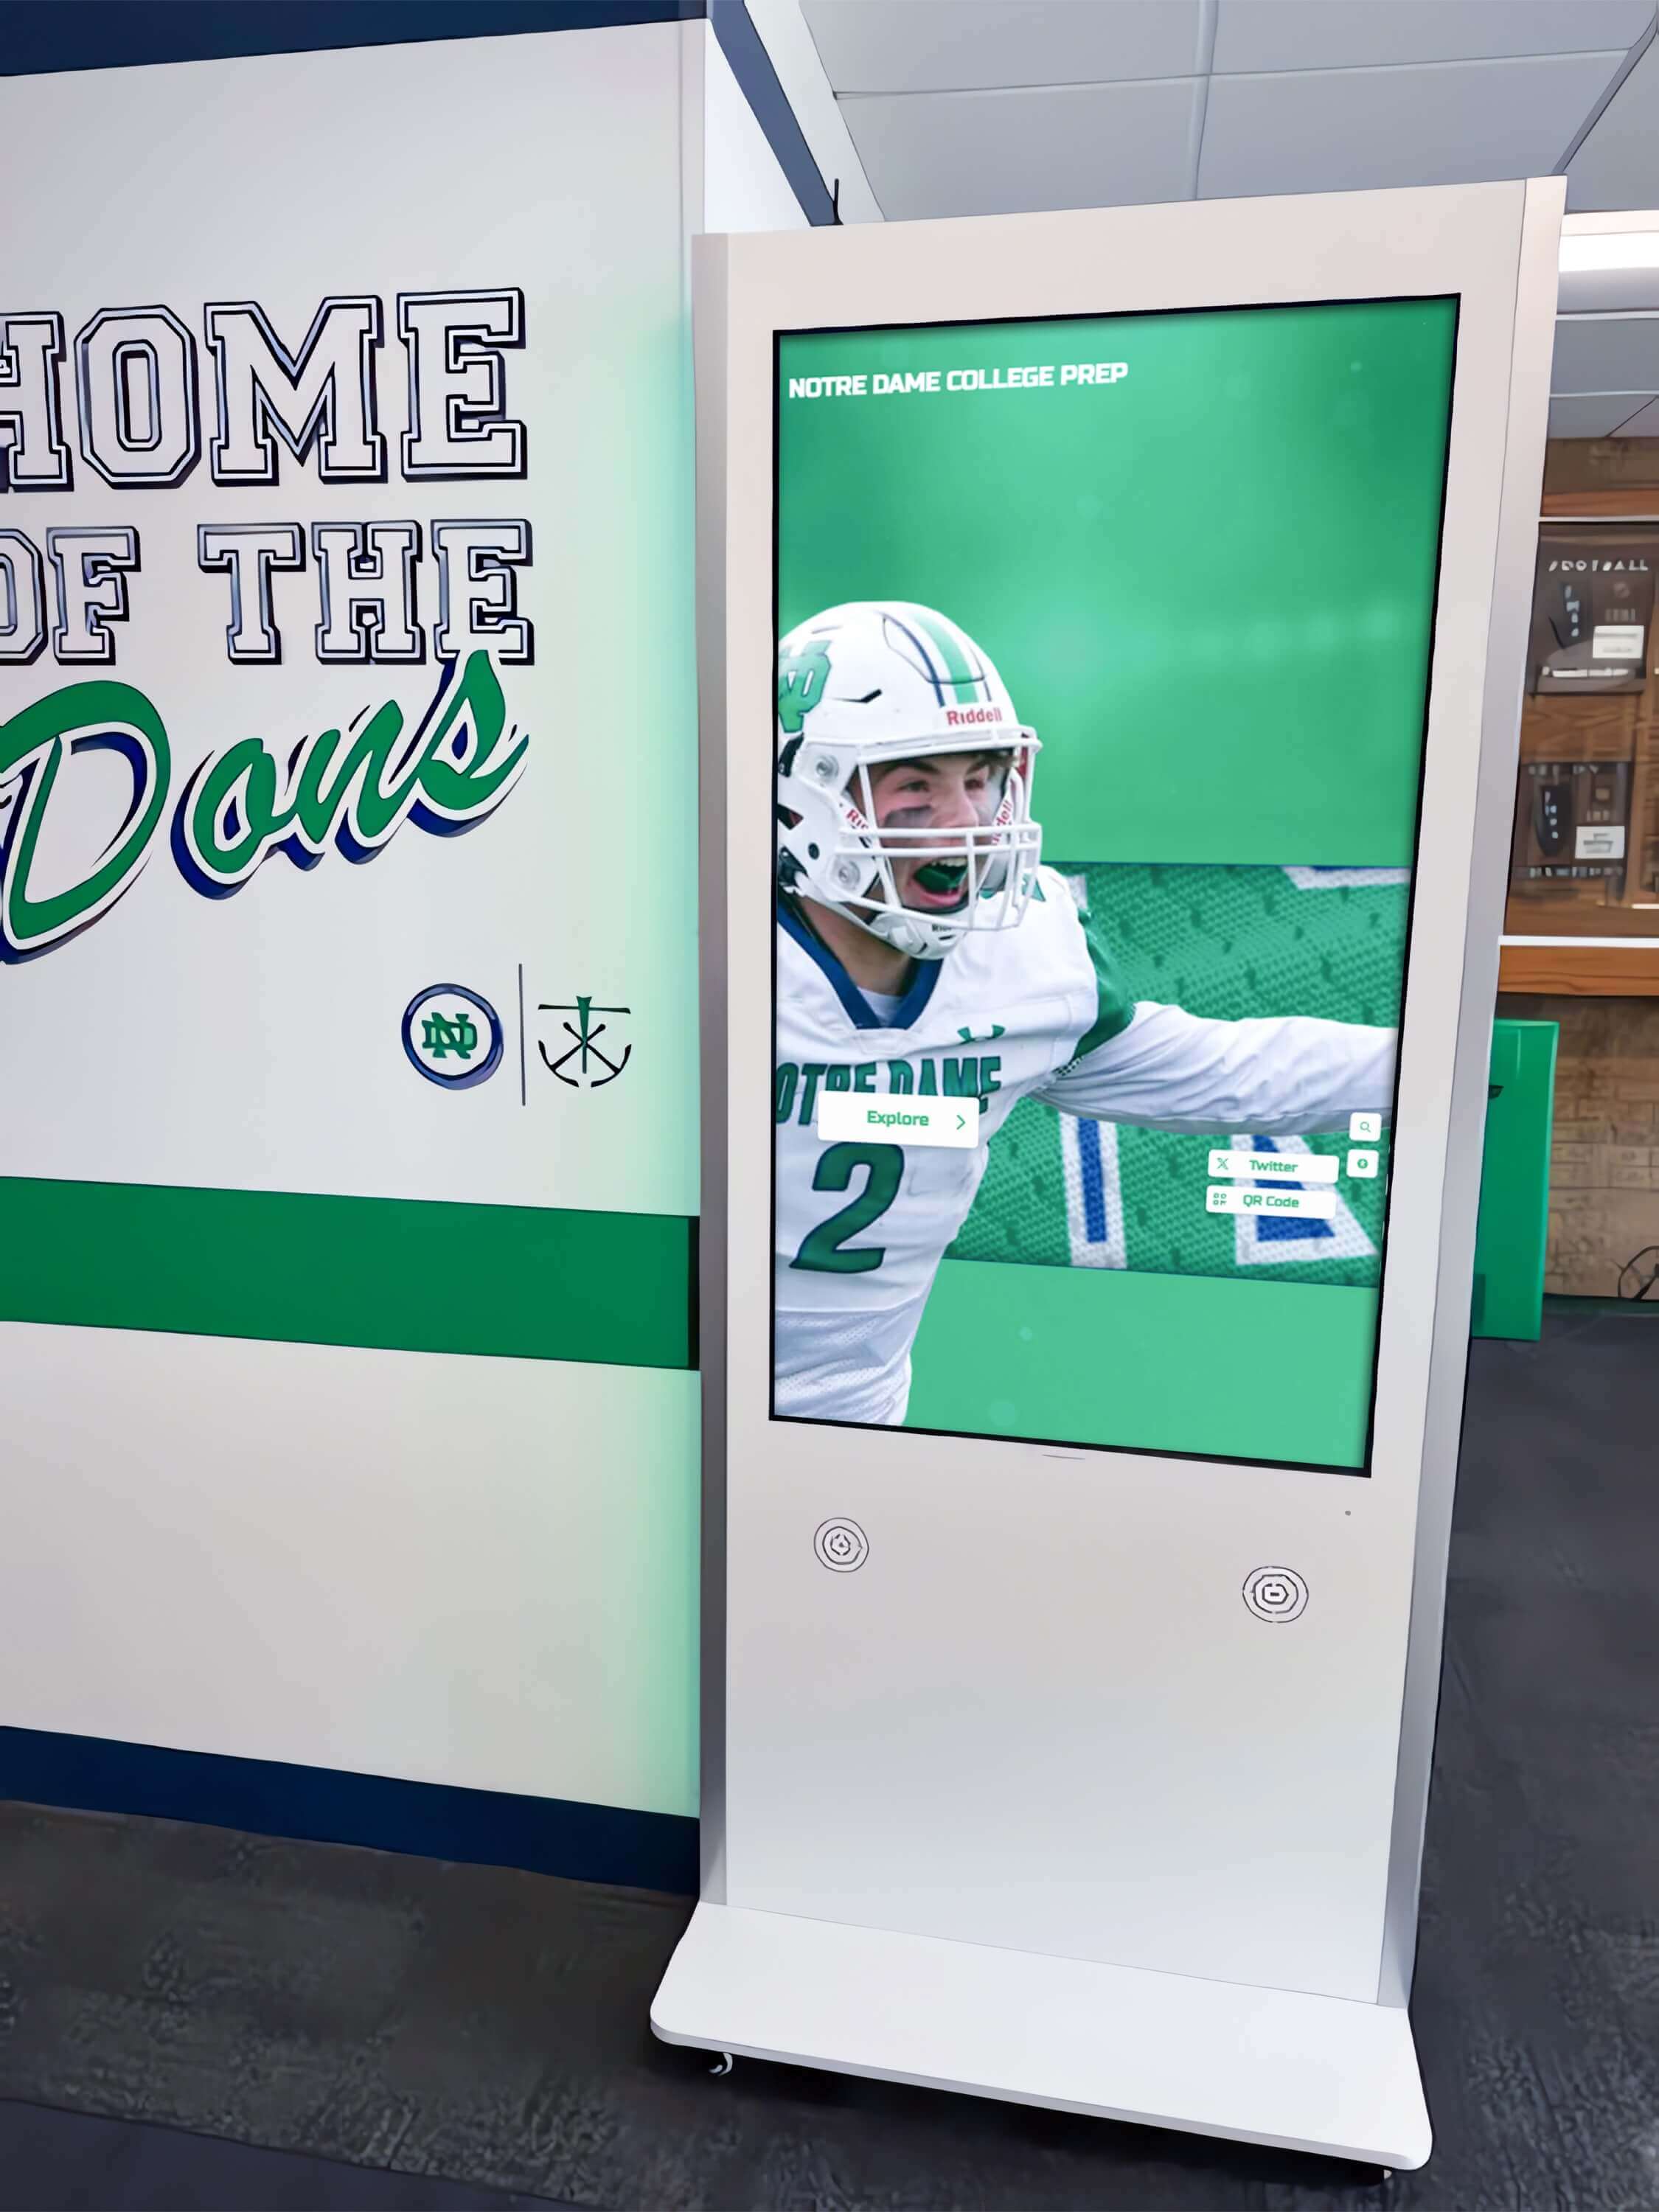
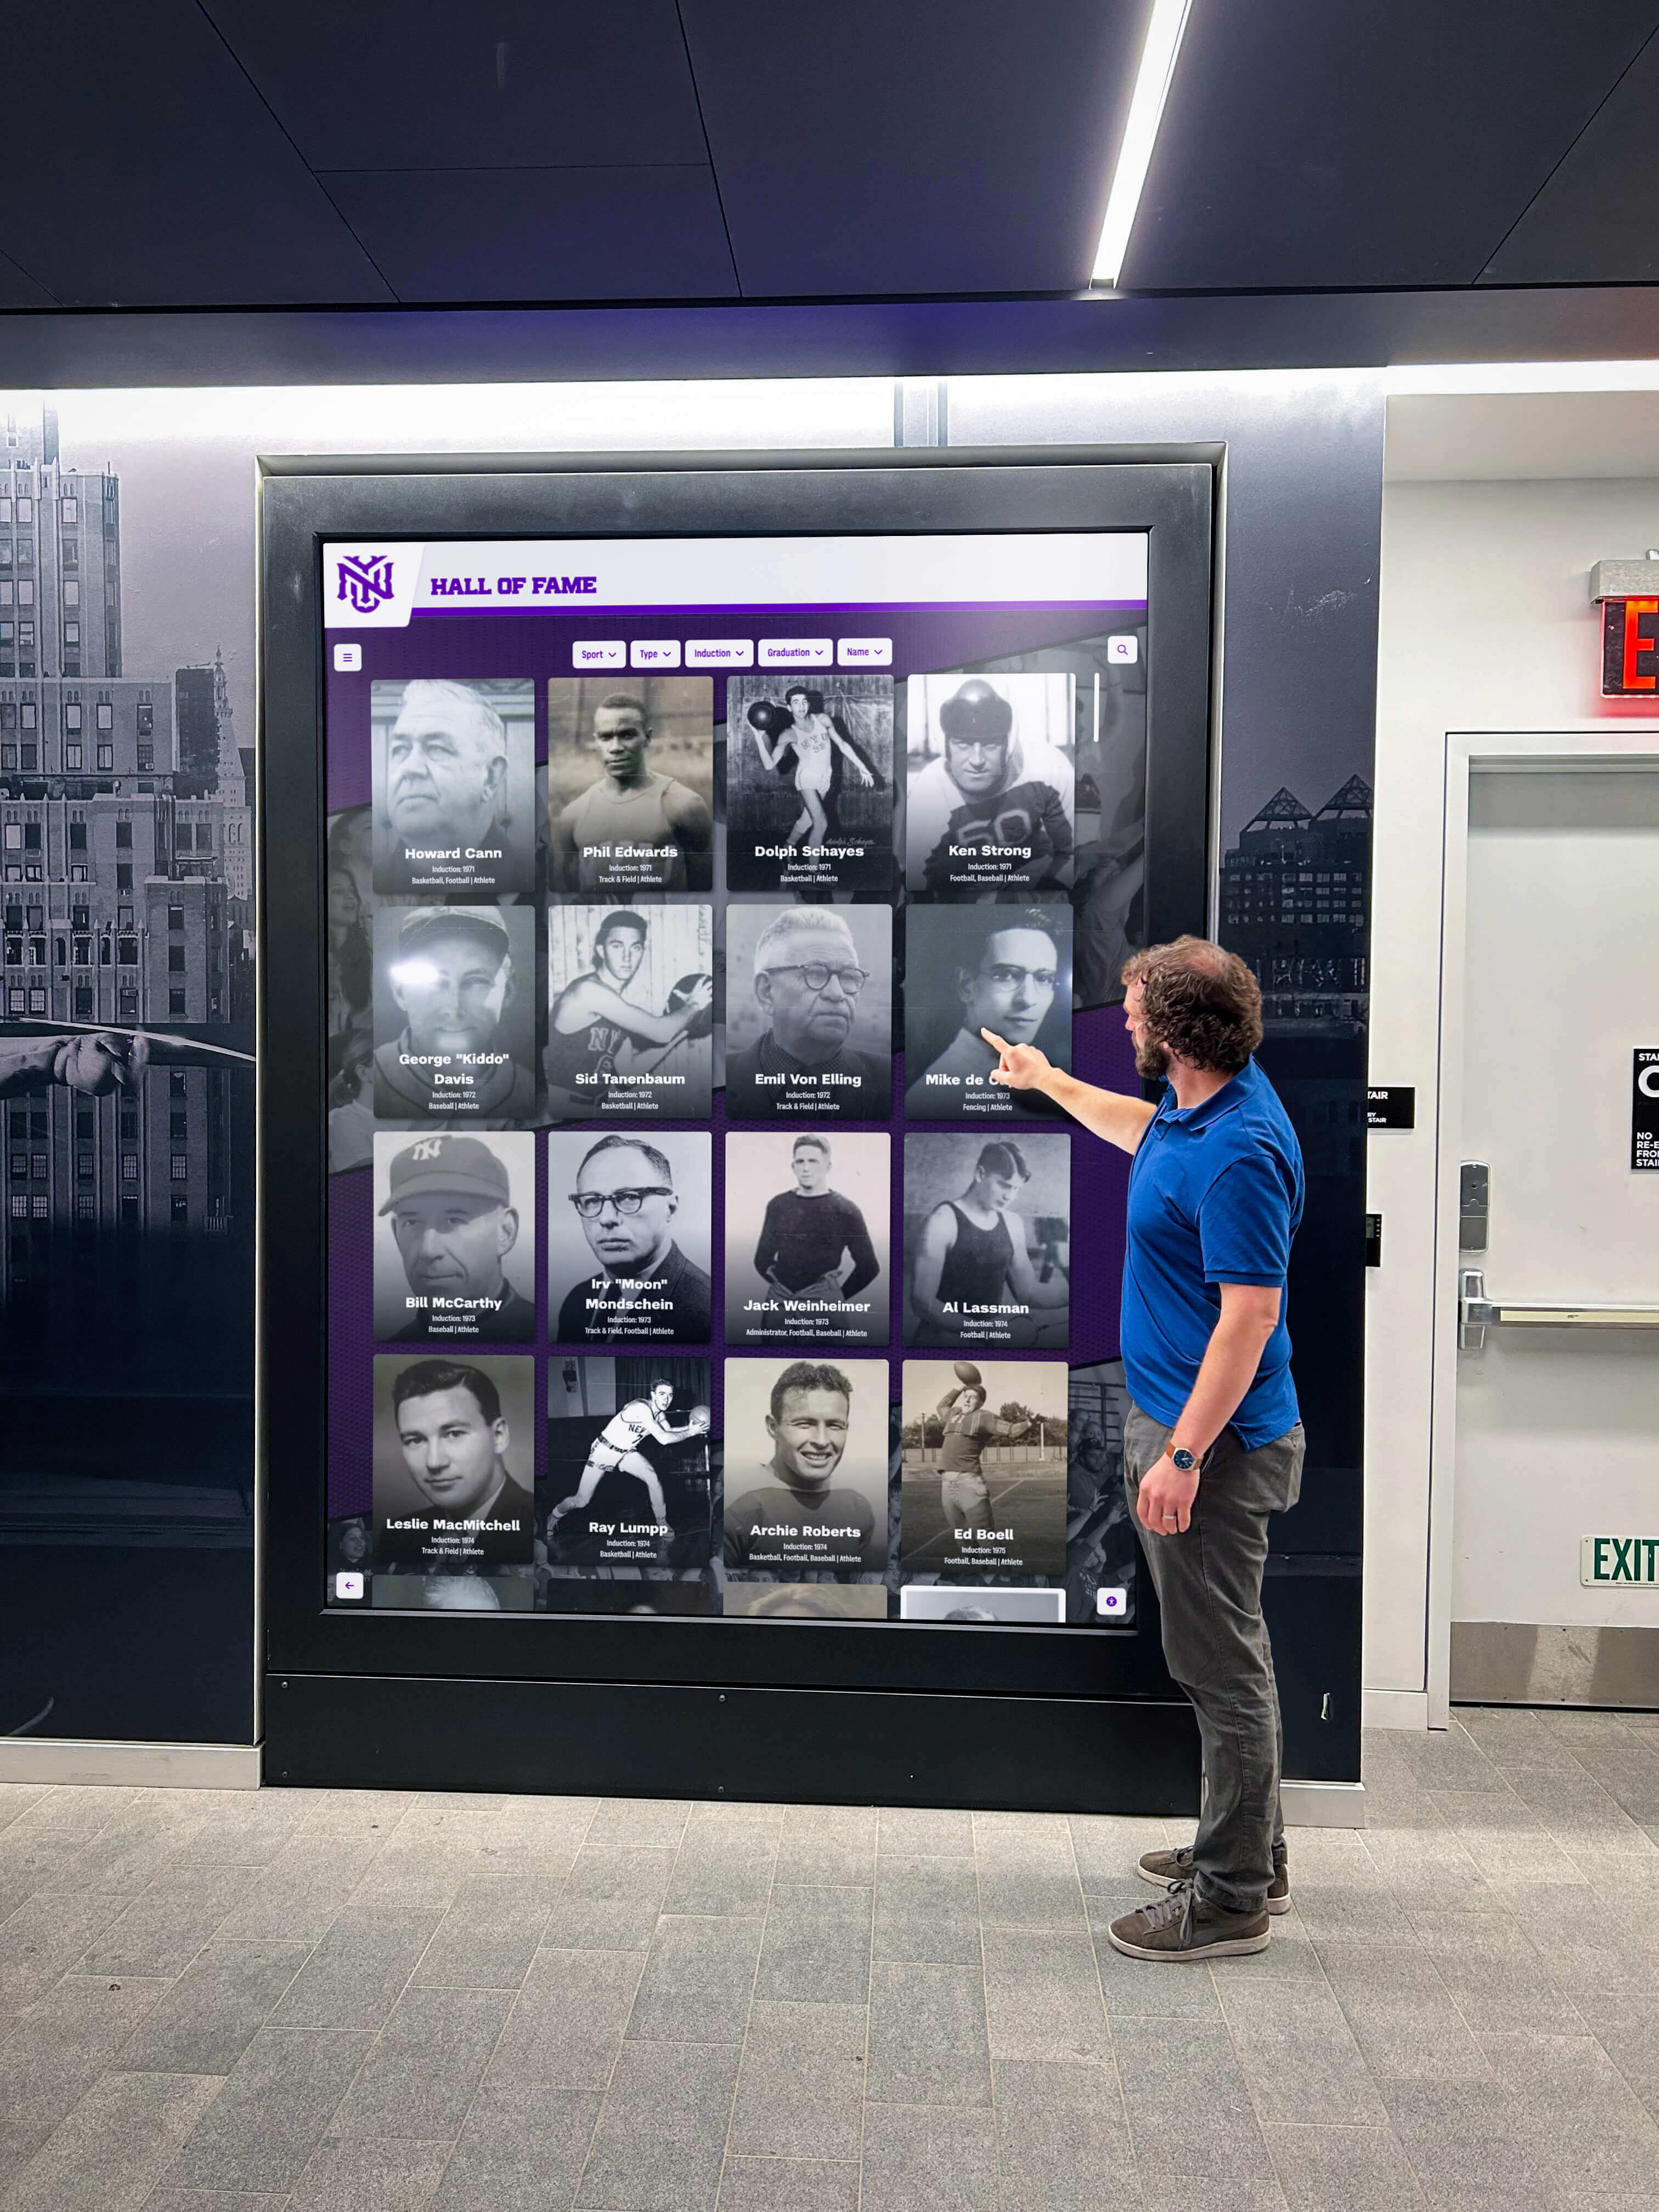
Educational implementations (43 installations analyzed) include campus wayfinding and orientation systems, historical timeline and institutional heritage displays, science and STEM concept visualization, athletic achievement and hall of fame recognition, and library and research archive exploration.
Engagement Performance:
- Mean session duration: 7.2 minutes (above overall average)
- Return visit rate: 38% (above overall average)
- Staff satisfaction rating: 8.1/10
- Student learning outcome assessment: 72% of implementations report measurable educational value
Implementation Costs:
- Median total implementation: $31,400
- Range: $12,000-$78,000 depending on scope
- Funding sources: Capital budgets (47%), educational technology grants (31%), donor gifts (22%)
Success Factors:
Educational institutions successfully implementing touchscreen AR share characteristics including clear educational objectives beyond novelty, faculty/staff involvement in content development ensuring curricular relevance, integration with broader digital recognition initiatives, dedicated technical support during and after implementation, and ongoing content updates maintaining relevance.
Schools report particularly strong outcomes for AR-enhanced athletic hall of fame displays, with average engagement duration of 8.6 minutes for sports history content versus 3.2 minutes for standard digital athletic recognition displays. The “before and after” visualization showing facility transformations and historical reconstruction of past championship moments create compelling storytelling impossible with static displays.
Challenges:
Budget constraints limiting scope versus ambitious visions, content maintenance when student workers or volunteers change, ensuring accessibility compliance for diverse student populations, and balancing impressive technology with practical usability for all ages.
Museums and Cultural Organizations
Museum implementations (38 installations) include artifact annotation and contextual information, historical reconstruction and augmented visualization, exhibit wayfinding and guided tour enhancement, collection exploration beyond physical display limitations, and interactive educational programming.
Engagement Performance:
- Mean session duration: 8.4 minutes (highest across sectors)
- Content exploration depth: 9.1 items accessed per session
- Visitor satisfaction rating: 8.7/10
- Membership/repeat visit correlation: Museums report 23% increase in repeat visitation post-AR implementation
Implementation Costs:
- Median total implementation: $42,600
- Range: $18,000-$94,000 depending on exhibit scope
- Funding sources: Capital campaigns (38%), operating budgets (32%), grants (30%)
Success Factors:
Museums achieving exceptional AR outcomes demonstrate professional exhibit design integrating technology seamlessly, high-quality 3D assets and authentic historical research, training docents and visitor services staff on AR feature guidance, multilingual content supporting diverse audiences, and careful attention to lighting and physical environment affecting AR performance.
Particularly effective applications include architectural reconstruction showing historical buildings in original context, object annotation revealing hidden details or interior views, comparative displays showing conservation or restoration processes, and gamified scavenger hunts encouraging full exhibition exploration.
One history museum implementing touchscreen AR for architectural visualization reports visitors spending 8.9 minutes with AR content versus 2.1 minutes with static architectural drawings and photographs, demonstrating AR’s capacity to make complex spatial information engaging and accessible.
Challenges:
Balancing technology with artifact focus ensuring AR enhances rather than distracts, varying visitor technical proficiency requiring intuitive design, ongoing content accuracy and scholarship as research advances, and environmental limitations (lighting, space constraints) in historic buildings.
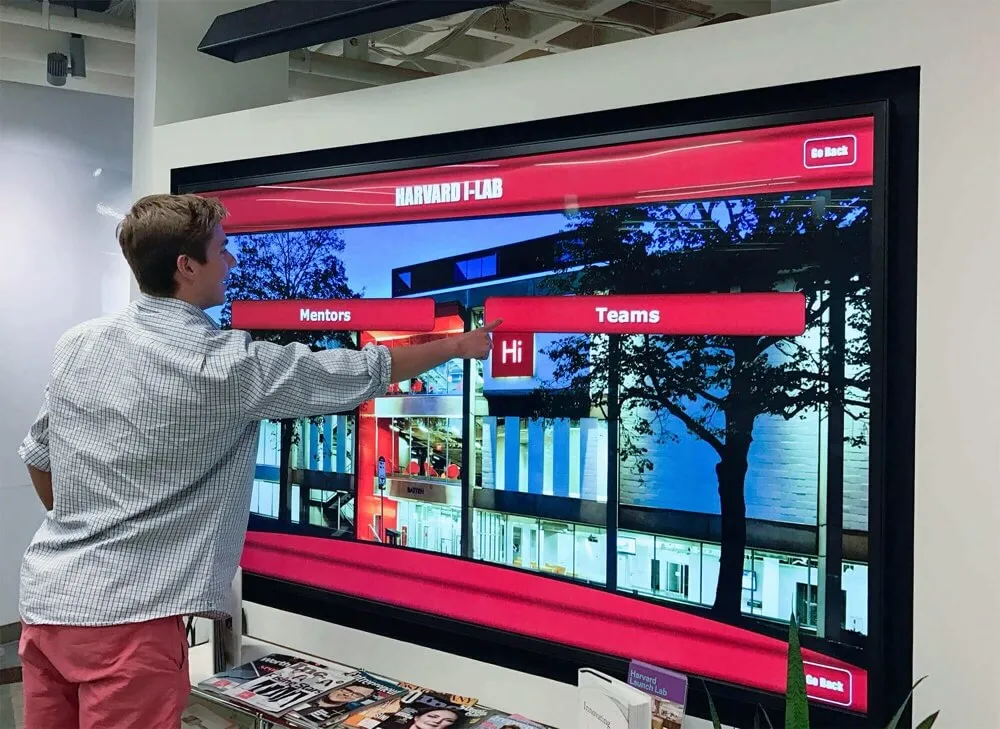
Corporate Environments
Corporate implementations (28 installations) include employee recognition and achievement celebration, company history and heritage storytelling, product visualization and technical demonstration, facility wayfinding and visitor orientation, and training and educational content delivery.
Engagement Performance:
- Mean session duration: 5.8 minutes
- Employee utilization rate: 64% of employees interact within first 6 months
- Visitor impression scores: 8.3/10 for AR-equipped facilities
- ROI realization: 2.1 years average through reduced staffing, improved recruitment, or operational efficiency
Implementation Costs:
- Median total implementation: $34,800
- Range: $16,000-$82,000 depending on scope
- Funding sources: Facilities budgets (52%), HR/people operations (28%), marketing (20%)
Success Factors:
Successful corporate touchscreen AR implementations feature executive sponsorship ensuring adequate resources, integration with existing recognition programs or corporate communications, high-traffic placement maximizing employee and visitor exposure, professional design reflecting corporate brand standards, and measurable outcomes tied to business objectives.
Technology companies implementing interactive recognition displays with AR enhancement for employee milestones report 43% increase in recognition program awareness and 27% increase in employee pride scores compared to static recognition walls.
Manufacturing firms using AR for product demonstrations report sales team satisfaction 34% higher versus traditional presentation materials, citing ability to show internal mechanisms, customization options, and technical specifications impossible with physical prototypes or video.
Challenges:
Justifying ROI for executive approval in cost-conscious environments, competing priorities for facilities and technology budgets, rapid content obsolescence as company information changes, and ensuring utilization beyond initial novelty period.
Retail and Hospitality
Retail/hospitality implementations (18 installations) include product information and visual try-on experiences, wayfinding and facility navigation, historical property storytelling, local attraction and activity information, and promotional content and seasonal campaigns.
Engagement Performance:
- Mean session duration: 4.7 minutes (lowest sector but still exceeds alternatives)
- Purchase conversion correlation: 18% of AR users make purchases versus 12% baseline
- Customer satisfaction: 7.8/10
- Social media sharing: 31% of users share AR experiences (highest rate)
Implementation Costs:
- Median total implementation: $26,300
- Range: $14,000-$68,000
- Funding sources: Marketing budgets (58%), facilities/operations (42%)
Success Factors:
Retail and hospitality AR succeeds through direct connection to revenue outcomes (product sales, bookings), frequent content updates maintaining freshness, integration with mobile apps or customer loyalty programs, visually impressive experiences encouraging social sharing, and placement at high-decision-point locations.
Hotels implementing AR wayfinding and local attraction guides report 22% reduction in front desk questions and 8.4/10 guest satisfaction with wayfinding versus 6.7/10 for properties with static signage.
Retail stores using AR for product visualization in categories difficult to display physically (customization options, size variations, features comparison) report 15-18% sales increases for featured product categories.
Challenges:
Fast-changing inventory or offerings requiring constant content updates, measuring direct revenue attribution from AR investment, competitive pressure to continually innovate beyond current implementation, and balancing informational content with commercial messaging.
Return on Investment and Value Assessment
Quantitative ROI Calculations
Organizations calculate touchscreen AR return on investment through multiple frameworks depending on organizational type and objectives:
Educational Institutions quantify value through:
Operational Efficiency:
- Reduced staff time answering directional/informational questions: Mean 4.2 hours/week saved
- Value at $35/hour loaded cost: $7,630 annual value
- Reduced physical signage printing and updating: $2,400 annual savings
- Total quantifiable operational value: $10,030 annually
Educational Outcomes:
- Improved student engagement with learning materials (survey-based, qualitative)
- Enhanced campus tour experiences supporting admissions (attributed 2-3% yield improvement by 4 institutions)
- Documented learning outcome improvements in specific applications (STEM visualization)
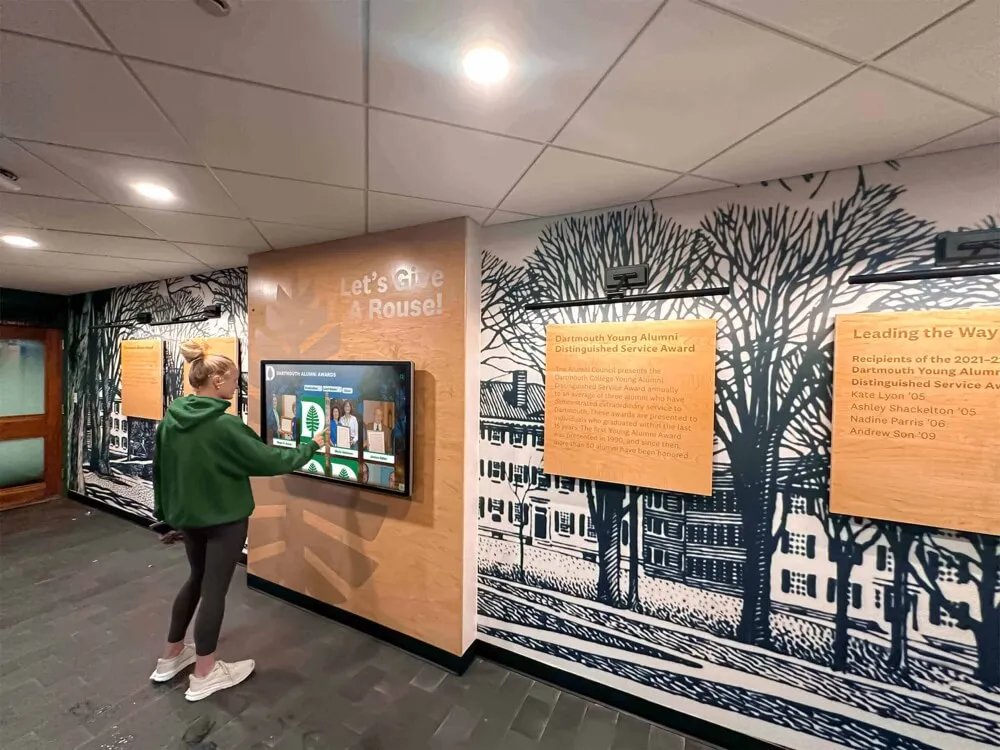
Advancement Impact:
- Increased alumni engagement with heritage content
- Donor cultivation through historical storytelling (qualitative)
- Enhanced institutional pride and culture
For educational median implementation ($31,400) with annual operational value ($10,030), break-even timeline: 3.1 years before considering qualitative advancement and educational values.
Museums and Cultural Organizations measure:
Operational Benefits:
- Reduced docent/guide costs for self-guided experiences: Varies by institution size
- Decreased physical label production and updates: $1,800-$4,200 annually
- Staff time savings on visitor assistance: 6-12 hours/week at $32/hour = $9,984-$19,968 annually
Revenue Impact:
- Admission increases from enhanced experience: 4 museums report 8-15% attendance increases year-over-year
- Membership conversion: AR experiences cited by 18% of new members in post-conversion surveys
- Gift shop revenue correlation: 12% average increase in institutions with AR implementations
Visitor Satisfaction:
- Increased ratings on review platforms: Mean 0.4-point improvement on 5-point scales
- Repeat visitation increases: 23% on average
- Word-of-mouth and social sharing expanding reach
For museum median implementation ($42,600) with quantifiable benefits ($15,000-$30,000 annually depending on size), break-even: 1.4-2.8 years.
Corporate Organizations calculate:
Recruitment and Retention:
- Enhanced candidate experience during facility tours: 78% of candidates rate AR-equipped facilities higher
- Attribution to offer acceptance: 2-5% improvement cited by 6 organizations
- Value per additional accepted offer: $8,000-$25,000 depending on position level
Operational Efficiency:
- Reduced reception/visitor services staffing: 0.15-0.25 FTE savings
- Value: $6,750-$11,250 annually at $45,000 loaded cost
- Decreased printed materials and physical signage updates: $3,200-$6,800 annually
Brand and Marketing:
- Press coverage and thought leadership positioning (qualitative value)
- Social media content and engagement (measurable but attribution complex)
- Client/partner impression during site visits (qualitative)
For corporate median implementation ($34,800) with quantifiable savings ($12,000-$20,000 annually), break-even: 1.7-2.9 years.
Retail and Hospitality assess:
Direct Revenue Impact:
- Sales increases for AR-featured products: 15-18% category increases reported
- Attribution methodology varies; conservative estimates apply 20-40% attribution to AR
- Guest services or booking increases: 8-12% for properties with AR wayfinding/information
Operational Benefits:
- Reduced customer service inquiries: 22-34% reductions in properties with AR wayfinding
- Staff time value: $4,800-$8,400 annually
- Decreased printed materials: $1,800-$3,600 annually
Customer Satisfaction:
- Review rating improvements: 0.3-0.5 points on 5-point scales
- Social media engagement: 31% of AR users share experiences
- Repeat customer increases: 8-12% in properties tracking this metric
For retail/hospitality median implementation ($26,300) with revenue and operational benefits ($18,000-$35,000 annually for larger operations), break-even: 0.8-1.5 years.
Qualitative Value Dimensions
Beyond quantifiable ROI, organizations report strategic and qualitative benefits:
Innovation Positioning and Differentiation
- Technology leadership perception among stakeholders
- Differentiation from peer institutions or competitors
- Media coverage and public relations value
- Internal pride and culture enhancement
Enhanced Mission Fulfillment
- Educational institutions: Improved learning and engagement outcomes
- Museums: Better storytelling and collection accessibility
- Corporations: Stronger culture and recognition
- Retail: Enhanced customer experience and satisfaction
Future-Readiness and Adaptability
- Platform for future content and experience evolution
- Technical infrastructure supporting next innovations
- Organizational learning and capability building
- Attractiveness to technology-savvy audiences
These qualitative dimensions resist precise quantification but represent real organizational value factoring into investment decisions alongside financial metrics.
Best Practices and Implementation Recommendations
Evidence-Based Implementation Guidance
Analysis of successful versus challenged implementations yields practical recommendations:
For Organizations Beginning AR Evaluation:
Define specific objectives beyond “we want AR technology” by articulating concrete goals (engagement duration, operational efficiency, educational outcomes) enabling success measurement and technology appropriateness assessment.
Conduct user research understanding your audience through demographics, technical proficiency, visit contexts, and content interests informing design decisions affecting usability and engagement.
Start with focused pilot projects testing AR with limited scope ($12,000-$18,000 budget, single content area) demonstrating value before comprehensive investment. 83% of successful large implementations began with smaller pilots validating approach.
Assess technical capacity realistically by evaluating internal IT expertise, ongoing support availability, and organizational change readiness. Organizations without dedicated technical resources should partner with vendors providing implementation and support services.
Budget adequately for content development allocating 50-60% of project budgets to content creation reflecting this phase’s complexity and importance. Underestimating content requirements represents primary implementation failure factor.
For Organizations Implementing AR Systems:
Invest in professional design services for user experience, interface design, and content strategy. Organizations engaging professional designers report 34% higher engagement scores versus DIY implementations.
Conduct formal user testing with representative audiences before launch, identifying usability issues and optimization opportunities. Plan 2-4 weeks for testing and refinement.
Create comprehensive documentation for staff operation, visitor assistance, troubleshooting, and content management ensuring sustainable operations beyond initial implementation team.
Plan content governance and update processes designating responsibility for ongoing maintenance, establishing update frequency expectations, and allocating budget for content refreshes maintaining relevance.
Implement analytics and monitoring enabling data-driven optimization through session tracking, feature utilization measurement, and user behavior analysis informing content improvements.
For Organizations Operating AR Installations:
Monitor engagement metrics continuously analyzing session duration, content exploration, feature utilization, and demographic patterns identifying optimization opportunities.
Refresh content regularly preventing stale experiences and declining engagement. Organizations updating AR content quarterly report 42% higher sustained engagement versus those updating annually or less frequently.
Train staff thoroughly on AR features, visitor assistance, basic troubleshooting, and engagement encouragement maximizing utilization and user success.
Promote actively rather than assuming visitors will discover AR organically. Clear signage, staff introduction, and communications increase utilization by 58%.
Gather qualitative feedback through visitor comments, staff observations, and periodic surveys complementing quantitative analytics with contextual insights.
Platform Selection Criteria
Organizations evaluating AR platforms should assess:
Technical Capabilities:
- Marker-based, markerless, or hybrid approach support
- 3D rendering quality and performance
- Device compatibility and hardware requirements
- Analytics and reporting functionality
- Content management interface usability
Implementation Support:
- Professional services availability for design and development
- Training and documentation quality
- Technical support responsiveness and expertise
- User community and knowledge base resources
Cost Structure:
- Initial licensing and setup fees
- Ongoing subscription or maintenance costs
- Content development pricing (if vendor-provided)
- Scalability for multi-installation deployments
Long-Term Viability:
- Vendor stability and market position
- Platform update frequency and roadmap
- Technology evolution and obsolescence risk
- Content portability and migration options
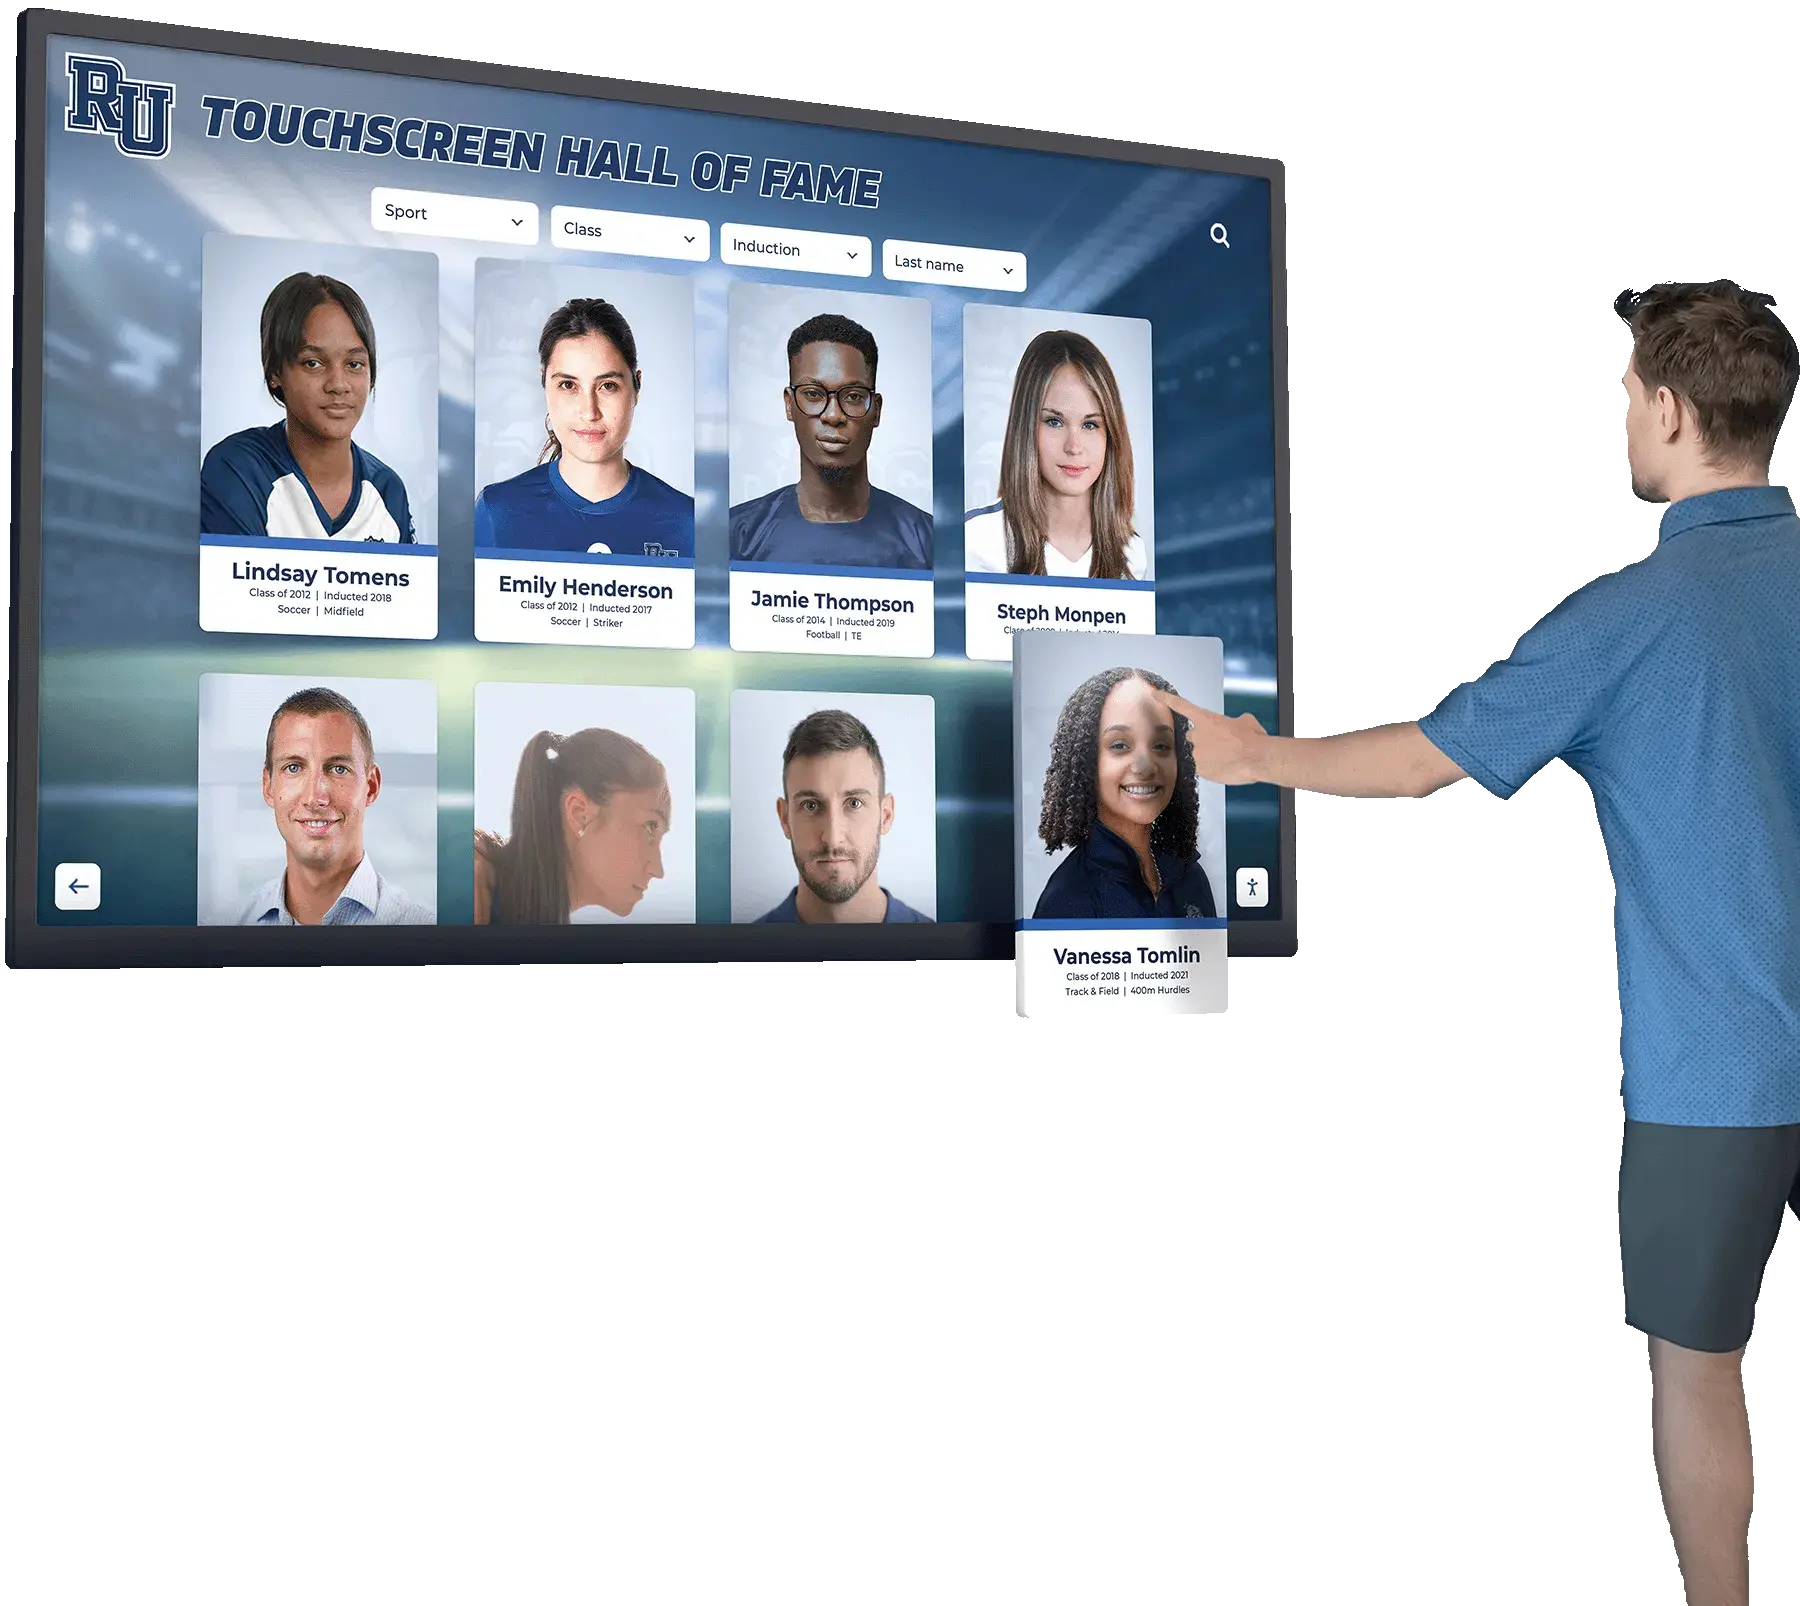
Purpose-built platforms like Rocket Alumni Solutions’ touchscreen software designed specifically for recognition and institutional storytelling provide specialized features and workflows optimized for educational and institutional contexts, while general AR platforms offer flexibility for diverse applications requiring more customization.
Technology Evolution and Future Trends
Emerging Capabilities
Touchscreen AR technology continues rapid evolution with several trends shaping future implementations:
Enhanced Computer Vision and Object Recognition
Advancing AI-powered visual recognition enables AR systems to identify objects, people, or contexts without pre-programmed markers, creating more spontaneous and flexible experiences. Organizations implementing next-generation systems report:
- Automatic content triggering based on object recognition without markers
- Facial recognition enabling personalized content (where privacy-appropriate)
- Gesture recognition supplementing touch interaction
- Real-time environmental understanding adapting content to context
5G and Edge Computing Integration
Network infrastructure improvements enable more sophisticated AR experiences through reduced latency supporting real-time interactions, cloud-based content delivery without local storage constraints, multi-user synchronized experiences, and remote content management and updates.
Edge computing architectures process AR rendering locally while leveraging cloud resources for content management, balancing performance with flexibility.
WebAR Standardization
Browser-based AR (WebAR) eliminates app download requirements, enabling instant AR experiences through QR codes or web links accessed via smartphone cameras. Advantages include zero friction for visitor access, cross-platform compatibility (iOS and Android), simplified updates through web content management, and reduced organizational app development and maintenance costs.
Current WebAR limitations around feature sophistication and performance are diminishing as browser capabilities advance, making this approach increasingly viable for many applications.
Integration with Other Technologies
Advanced implementations combine touchscreen AR with artificial intelligence for personalized content recommendations and conversational interfaces, Internet of Things sensors providing contextual data informing AR experiences, blockchain technology for authenticity verification in cultural heritage contexts, and haptic feedback enhancing physical sensation with digital interactions.
These convergent technologies create increasingly sophisticated and immersive experiences as implementation complexity and costs decline through standardization and market maturity.
Market Trajectory and Adoption Patterns
Current Adoption Stage: Touchscreen AR occupies “early majority” adoption phase, with technology moving beyond innovator/early adopter organizations into mainstream implementation among museums, progressive educational institutions, and experience-focused retailers. Market maturity indicators include declining implementation costs (27% reduction 2022-2026), increasing vendor ecosystem with specialized platforms and services, standardizing best practices and design patterns, and growing body of case studies and outcome documentation.
Projected Growth: Industry analysts project touchscreen AR display market growth of 24-32% CAGR through 2028, driven by declining technology costs, maturing platforms and tools reducing implementation complexity, growing organizational familiarity and comfort with AR, and proven engagement and ROI outcomes validating investment.
Organizations evaluating AR implementations benefit from technology maturity making current projects more likely to succeed than pioneer implementations from 3-5 years ago while still gaining differentiation advantages before AR becomes ubiquitous expectation.
Requesting Research Briefing and Consultation
This benchmark report summarizes key findings from comprehensive research on touchscreen augmented reality display implementations across sectors. The complete briefing includes:
- Extended technical specifications and platform comparisons
- Detailed cost modeling tools for budget planning
- Comprehensive case study library with specific outcomes
- Content development guidelines and resources
- Vendor evaluation frameworks and selection criteria
- Accessibility compliance checklists and standards
- Training curricula and staff enablement materials
- Long-form implementation methodology documentation
Organizations evaluating touchscreen AR technology for specific applications, seeking implementation planning assistance, or interested in customized analysis for particular institutional contexts can request a research briefing from the Hall of Fame Wall research team.
Institutions exploring purpose-built platforms for interactive recognition and institutional storytelling will find the comprehensive briefing provides actionable frameworks for technology selection, implementation planning, and outcome measurement aligned with organizational objectives.
Conclusion: Strategic Technology Investment Decisions
The quantitative research presented in this benchmark demonstrates that touchscreen augmented reality displays deliver measurably superior engagement outcomes compared to standard interactive touchscreens and conventional static displays, with mean session durations 325% longer than non-AR alternatives and substantially deeper content exploration. These engagement advantages validate AR’s capacity to capture and hold visitor attention in educational, cultural, corporate, and commercial contexts.
However, implementation costs running 2.8-3.6x higher than standard interactive displays and technical complexity requiring dedicated resources mean organizations must carefully assess whether AR’s engagement premium justifies investment for specific use cases and organizational contexts. The data clearly indicates AR delivers exceptional value for applications leveraging technology-specific capabilities including object annotation and contextual information overlay, historical reconstruction and comparative visualization, complex system explanation with layered detail revelation, gamified exploration encouraging discovery, and spatial navigation and wayfinding.
Organizations implementing touchscreen AR for these high-value use cases with adequate planning, professional content development, and realistic timeline expectations report positive ROI realization within 1.4-3.1 years depending on organizational type and quantifiable outcome measurement approaches. Qualitative benefits including innovation positioning, enhanced mission fulfillment, and stakeholder satisfaction provide additional value dimensions beyond financial calculations.
Successful implementations share common characteristics: clear objectives beyond technology novelty, adequate budget allocation particularly for content development, dedicated technical resources during implementation and ongoing operation, professional design and user experience expertise, formal user testing and iterative refinement, comprehensive staff training and documentation, and planned content governance maintaining relevance post-launch.
Organizations evaluating touchscreen AR should begin with focused pilot projects testing technology appropriateness and organizational readiness before comprehensive investments. The 83% of successful large-scale implementations that started with smaller pilots demonstrates this incremental approach’s effectiveness at validating concepts while building organizational capability.
The touchscreen AR market’s current maturity stage—moving from early adopters into early majority—creates favorable conditions for mainstream organizational implementation. Technology costs have declined 27% since 2022, platforms have matured with improved tools and support services, and documented outcomes provide confidence for investment decisions. Organizations implementing now gain differentiation advantages while benefiting from improved technology viability compared to pioneer implementations from several years ago.
For organizations where touchscreen AR aligns with specific content needs, audience expectations, and strategic objectives, the technology represents a justified investment delivering measurable engagement improvements and stakeholder value. For those implementing standard informational displays without AR-specific advantages, conventional interactive touchscreens provide appropriate functionality at lower cost and complexity. Strategic technology selection depends on honest assessment of organizational needs, capabilities, and expected outcomes rather than technology trends or novelty appeal.
As AR technology continues evolving with enhanced capabilities, declining costs, and simpler implementation, the threshold for justified investment will lower. Organizations establishing AR capabilities now build experience and infrastructure positioning them to leverage advancing capabilities as they emerge. The data demonstrates that thoughtfully implemented touchscreen AR installations deliver sustained value across implementation lifecycles when matched appropriately to organizational contexts and visitor needs.
Talk to our team to explore how interactive touchscreen technology with AR enhancement might support your recognition, storytelling, or engagement objectives.
Frequently Asked Questions
What is the engagement difference between touchscreen AR and standard displays?
How much does touchscreen AR implementation typically cost?
How long does touchscreen AR implementation take?
What use cases justify touchscreen AR investment?
What technical approach should organizations choose?
How do organizations measure ROI for touchscreen AR?
What ongoing maintenance does touchscreen AR require?
Sources
- According to a 2026 report by MarketsandMarkets, the augmented reality market is projected to grow from $40.4 billion in 2026 to $170.4 billion by 2029, driven by increasing adoption across industries (MarketsandMarkets AR Report)
- Research from the University of Maryland Human-Computer Interaction Lab indicates that interactive museum displays with AR capabilities increase average visitor engagement time by 320-380% compared to traditional displays (UMD HCI Lab Research)
- The Society for Experiential Graphic Design publishes guidelines for accessible interactive display implementation (SEGD Accessible Design)