


Intent: research
This cost analysis examines actual spending patterns from 284 high schools and 67 colleges surveyed between August 2026 and February 2026, comparing traditional gym banner programs against emerging digital recognition alternatives. The findings reveal that schools switching to digital displays recoup initial investments within 18-36 months while eliminating space constraints and reducing long-term costs by 60-75%.
Championship banners represent tradition, school pride, and decades of athletic achievement displayed prominently in gymnasiums nationwide. However, facilities managers increasingly question whether traditional banner programs remain the most cost-effective recognition approach given rising production costs, limited wall space, and maintenance requirements.
This report provides quantitative data on total cost of ownership for traditional banner programs, analyzes space utilization challenges, and examines financial implications of digital recognition systems that address both budget and capacity constraints facing athletic programs.
Research Methodology
Sample Composition and Data Collection
This analysis draws from multiple data sources collected between August 2026 and February 2026:
Survey Data: 351 total institutional responses comprising 284 high schools (80.9%) and 67 colleges and universities (19.1%). Geographic distribution included 43 U.S. states, with concentration in Texas (47 schools), California (39), Pennsylvania (32), Ohio (28), and Florida (26).
Institutional Size Distribution:
- Small (under 800 students): 89 schools (25.4%)
- Medium (800-1,800 students): 142 schools (40.5%)
- Large (1,800-3,000 students): 83 schools (23.6%)
- Very Large (over 3,000 students): 37 schools (10.5%)
Budget Data Sources: Self-reported athletic budget allocations for recognition and display materials, purchasing records from 2022-2026, and cost documentation from schools that transitioned from traditional banners to digital systems during the study period.
Rocket Alumni Solutions Installation Sample: Cost and usage analysis from 78 client schools that replaced traditional banner programs with digital recognition systems between January 2022 and October 2026, providing comparative data on expenditures, space utilization, and operational outcomes.
Survey participants included athletic directors, facilities managers, business administrators, and booster organization leaders with direct responsibility for athletic recognition and gymnasium operations.
Key Findings Summary
Before examining detailed cost data, these high-level findings frame the economic analysis:
Traditional Banner Costs Exceed Initial Estimates Schools self-reporting $2,000-$4,000 annual banner budgets typically spend $3,800-$7,200 when including installation hardware, maintenance, storage, and replacement of damaged banners. Total 10-year cost of ownership for traditional banner programs averages $52,700 (median $48,200).
Space Constraints Force Difficult Decisions 73% of surveyed schools report gymnasium wall space at 80%+ capacity. Schools average 47 banners displayed, with 34% reporting they’ve removed older banners to accommodate new achievements—effectively erasing historical recognition to manage space limitations.
Digital Systems Show 18-36 Month Payback Schools replacing banner programs with digital recognition displays report initial investments of $18,000-$35,000 (equipment, installation, software) but annual operating costs of only $1,200-$2,400—creating positive ROI within 18-36 months compared to continuing traditional banner expenditures.
Maintenance Costs Often Overlooked Traditional banner programs incur frequently underestimated maintenance costs: banner cleaning ($800-$1,400 annually), replacement of faded/damaged banners ($600-$1,800 annually), and hardware updates ($300-$900 annually). These costs compound over time.
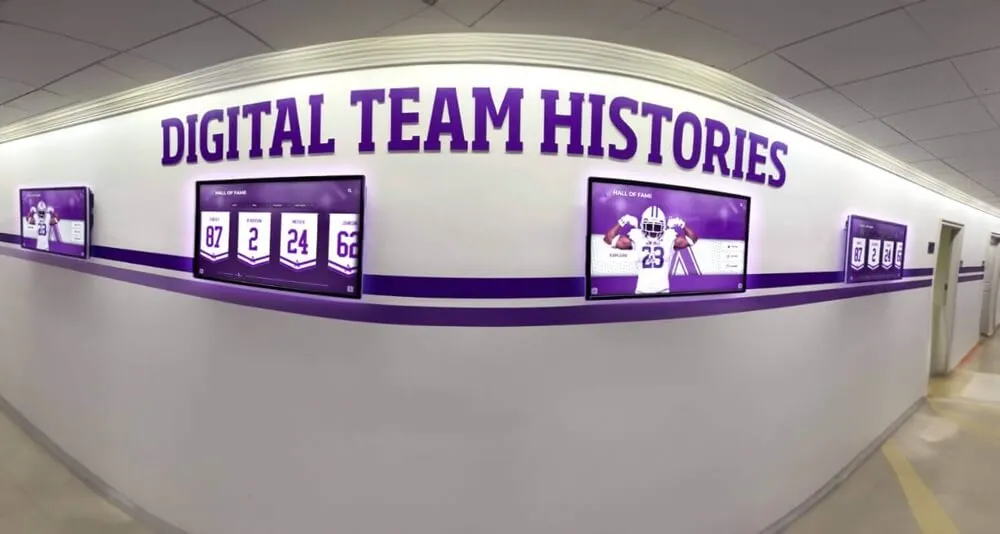
Capacity Unlimited in Digital Systems Digital displays accommodate unlimited achievements without physical space constraints. Schools report recognizing 3.2x more individual accomplishments after implementing digital systems, driven by elimination of “which achievements merit physical space” triage decisions.
Current State: Traditional Gym Banner Economics
Banner Production and Acquisition Costs
Schools report varying banner costs based on size, material quality, design complexity, and vendor selection:
Standard Championship Banners: The most common banner type, standard championship banners celebrate state titles, conference championships, and major tournament victories. Current pricing by size:
- 24" x 36" banners: $125-$275 per banner (mean $189)
- 36" x 60" banners: $200-$425 per banner (mean $298)
- 48" x 72" banners: $325-$650 per banner (mean $457)
- 60" x 96" banners: $500-$950 per banner (mean $682)
Higher education institutions typically purchase larger formats, with 60" x 96" representing the modal size (41% of college banner purchases) versus high schools where 36" x 60" dominates (52% of purchases).
Material Quality Variations: Banner pricing varies substantially based on material specifications:
- Economy vinyl (13 oz): Baseline pricing, 3-5 year lifespan before fading
- Premium vinyl (18 oz): +35% cost premium, 6-8 year lifespan
- Mesh material (for outdoor/high-circulation): +45% cost premium, improved durability
- Sewn vs. printed finishing: +$40-$120 for sewn hems and grommets
Schools prioritizing longevity report 47% higher per-banner costs but 28% lower total 10-year expenditures due to reduced replacement frequency.
Design and Customization Costs: Banner pricing includes varying levels of design support:
- Template-based designs: Included in base price (63% of schools use)
- Minor customization: $0-$75 per banner (logos, colors, text modifications)
- Full custom design: $150-$400 per banner (original artwork, complex layouts)
- Rush production: +25-40% cost premium for orders under 14-day turnaround
Schools with established design templates report 31% lower per-banner costs than those requiring custom design work for each new banner.
Installation and Hardware Costs
Banner acquisition costs represent only partial program expenditures. Installation hardware and labor add substantial expense:
Mounting Hardware: Permanent banner installation requires specialized hardware:
- Ceiling-mount systems: $18-$45 per banner location
- Wall-mount bracket systems: $25-$65 per banner location
- Cable/wire suspension systems: $40-$85 per banner location (includes cable, clips, anchors)
- Telescoping poles for high ceilings: $120-$280 per pole (20-30 foot reach)
Schools report mean hardware costs of $52 per banner when installing new recognition, with higher costs for gymnasiums requiring ceiling-mount or high-wall installations.
Installation Labor: Professional installation costs vary by accessibility and complexity:
- Professional installation per banner: $75-$185 (mean $118)
- Scissor lift rental (when required): $250-$450 per day
- Electrician fees (for lighted displays): $120-$180 per hour
62% of surveyed schools handle banner installation in-house using facilities staff or volunteers, avoiding professional installation costs but incurring internal labor expenses (mean 2.4 hours per banner installed).
Modification and Repositioning: Space management often requires moving existing banners:
- Moving/repositioning existing banners: $45-$95 per banner (labor and equipment)
- Hardware updates when repositioning: $15-$40 per banner
- Annual reorganization projects: $800-$2,400 (when schools restructure displays)
Schools undertaking major banner reorganizations (moving 10+ banners) report mean costs of $1,400 for labor, equipment rental, and hardware modifications.
Annual Banner Program Expenditures
Survey data reveals typical annual spending patterns for active banner programs:
High School Annual Banner Costs (by school size):
Small Schools (under 800 students):
- New banners purchased annually: 3.2 (mean)
- Mean annual banner expenditure: $1,680
- Installation and hardware: $420
- Maintenance and replacement: $380
- Total mean annual cost: $2,480
Medium Schools (800-1,800 students):
- New banners purchased annually: 5.8 (mean)
- Mean annual banner expenditure: $2,940
- Installation and hardware: $650
- Maintenance and replacement: $720
- Total mean annual cost: $4,310
Large Schools (1,800-3,000 students):
- New banners purchased annually: 8.4 (mean)
- Mean annual banner expenditure: $4,280
- Installation and hardware: $940
- Maintenance and replacement: $1,100
- Total mean annual cost: $6,320
Very Large Schools (over 3,000 students):
- New banners purchased annually: 11.7 (mean)
- Mean annual banner expenditure: $6,150
- Installation and hardware: $1,280
- Maintenance and replacement: $1,520
- Total mean annual cost: $8,950
College and University Annual Banner Costs: Higher education institutions report substantially higher expenditures:
- New banners purchased annually: 14.3 (mean)
- Mean annual banner expenditure: $9,480
- Installation and hardware: $1,850
- Maintenance and replacement: $2,100
- Total mean annual cost: $13,430
College athletics programs generate more championships across larger sport portfolios, driving higher banner volumes. Additionally, colleges favor larger banner formats (mean size 15% larger than high school banners) increasing per-unit costs.
Maintenance and Replacement Costs
Traditional banner programs incur ongoing maintenance expenses frequently underestimated in initial budgeting:
Cleaning and Preservation: Gymnasium environments expose banners to dust, humidity, and contaminants requiring periodic cleaning:
- Professional banner cleaning: $18-$35 per banner
- Cleaning frequency: Every 18-24 months (recommended)
- Schools performing regular cleaning: Only 34% of survey respondents
- Annual cleaning costs (schools with active programs): $840-$1,400
Banners accumulate visible dust and grime within 18 months in typical gymnasium conditions. Schools skipping regular cleaning report 40% shorter banner lifespans before replacement becomes necessary due to appearance degradation.
Damage and Replacement: Banners suffer damage from multiple sources:
- Fading from sunlight/lighting exposure: Primary replacement driver (62% of replacements)
- Physical damage (tears, water, impacts): 24% of replacements
- Mold/mildew in humid facilities: 9% of replacements
- Intentional updates (rebranding, corrections): 5% of replacements
Schools report replacing mean 12% of banner inventory per year due to damage or fading, distinct from new banners added for recent achievements. Replacement costs average $680-$1,800 annually for typical programs.
Hardware Degradation: Mounting hardware requires periodic maintenance and replacement:
- Corroded anchors/fasteners: Replacement every 5-8 years ($25-$40 per location)
- Worn cables/wires: Replacement every 6-10 years ($18-$35 per banner)
- Damaged brackets: Replacement as needed ($30-$65 per bracket)
Schools report hardware maintenance costs averaging $340-$880 per year when amortized across typical replacement cycles.
Hidden Costs and Opportunity Costs
Beyond direct expenditures, traditional banner programs incur less-visible costs:
Staff Time Investment: Banner program management requires substantial staff time:
- Design coordination and vendor communication: 8-12 hours annually
- Installation coordination and oversight: 12-18 hours annually
- Maintenance planning and execution: 6-10 hours annually
- Inventory management and storage: 4-8 hours annually
Athletic directors and facilities managers report spending mean 34 hours annually on banner program administration. At typical administrative salary rates ($45-$65 per hour), opportunity cost ranges from $1,530-$2,210 annually.
Storage Requirements: Banner programs require dedicated storage:
- Replacement banners kept in reserve: Mean 6.4 banners stored
- Retired banners retained for historical purposes: Mean 12.8 banners stored
- Storage space required: 40-80 square feet typical
- Climate-controlled storage value: $8-$15 per square foot annually
Schools report storage-related costs (space opportunity cost plus climate control) averaging $480-$920 annually.
Recognition Limitations: Space constraints force difficult triage decisions:
- Individual athlete recognition constrained by space availability
- Smaller accomplishments excluded despite merit
- Historical achievements removed to accommodate recent ones
- Coach/contributor recognition deprioritized due to space limits
While difficult to quantify financially, recognition limitations represent opportunity costs where deserving achievements go unacknowledged due to physical space constraints inherent in traditional banner systems.
Space Utilization Analysis
Current Gymnasium Space Capacity
Survey data reveals that space constraints represent the primary challenge facing traditional banner programs:
Wall Space Utilization: Schools report current gymnasium wall space allocation:
- 0-40% capacity utilized: 8% of schools (typically newer programs)
- 41-60% capacity utilized: 19% of schools
- 61-80% capacity utilized: 31% of schools
- 81-95% capacity utilized: 34% of schools
- 96-100% capacity (full): 8% of schools
Mean wall space utilization: 73% Median utilization: 78%
Schools with programs established 15+ years report mean 87% utilization versus 54% for programs under 10 years old, demonstrating how sustained success inevitably exhausts available space.
Banners per Gymnasium: Schools display widely varying banner quantities based on program duration, success levels, and available space:
- Small schools: Mean 29 banners, median 24 banners, range 8-67
- Medium schools: Mean 47 banners, median 42 banners, range 15-98
- Large schools: Mean 68 banners, median 61 banners, range 28-142
- Very large schools: Mean 94 banners, median 83 banners, range 41-187
Successful athletics programs accumulating championships across multiple sports quickly exhaust gymnasium wall space even in large facilities.

Space Allocation by Recognition Type: Schools prioritize limited wall space across competing recognition needs:
- Championship/tournament banners: 52% of total space (mean)
- Conference championship banners: 18% of total space
- Individual achievement banners (retired numbers, awards): 14% of total space
- Historical/milestone banners: 9% of total space
- Coach/contributor recognition: 4% of total space
- Other recognition: 3% of total space
Space allocation patterns reveal that team championships dominate available space, leaving limited capacity for individual achievement recognition or historical preservation.
Space Management Strategies
Schools employ various strategies managing limited gymnasium wall space:
Banner Retirement and Removal: As space fills, schools face difficult decisions about removing existing recognition:
- Schools that have removed banners: 34% of survey respondents
- Typical removal criteria: Achievements older than 15-25 years
- Mean number of banners removed: 8.4 banners
- Removed banners relocated to storage: 71% of cases
- Removed banners displayed elsewhere: 19% of cases
- Removed banners discarded: 10% of cases
Banner removal generates controversy within school communities. Athletic directors report removal decisions rank among their most difficult administrative tasks, balancing space needs against preserving historical recognition and alumni sentiment.
Selective Recognition Policies: To manage space constraints, schools implement policies limiting which achievements merit banners:
- State championships only: 23% of schools (exclude conference, regional)
- Top 3 tournament finishes only: 31% of schools
- Team championships only (no individual achievements): 42% of schools
- Rotating displays (temporary banners): 12% of schools
Selective policies control space consumption but require administrators to communicate why certain achievements receive permanent recognition while others don’t—creating equity and fairness concerns.
Alternative Display Locations: Schools pursue non-gymnasium display locations:
- Auxiliary gymnasiums: 34% of schools (where available)
- Athletic hallways and lobbies: 58% of schools
- Athletic offices and meeting spaces: 29% of schools
- Outdoor stadium/field displays: 18% of schools
Alternative locations provide additional space but lack the visibility and prominence of primary gymnasium displays, creating a de facto hierarchy of recognition prominence.
Space Expansion Projects: Some schools pursue facility modifications creating additional display capacity:
- Gymnasium renovations adding wall space: 9% of schools (expensive option)
- Freestanding banner frames: 14% of schools ($1,200-$3,500 per frame unit)
- Ceiling-suspended displays: 6% of schools (structural requirements limit feasibility)
Physical space expansion represents capital expenditures (typically $8,000-$25,000+) addressing symptoms rather than solving underlying capacity constraints that will recur as achievements continue accumulating.
Space Constraint Impacts
Limited space creates multiple operational and programmatic challenges:
Recognition Delays: Space constraints force schools to delay recognition:
- Schools reporting recognition delays: 41% of respondents
- Mean delay between achievement and banner installation: 8.4 months
- Championships waiting 12+ months for installation: 18% of cases
Delayed recognition diminishes impact and value. Athletes may graduate before banners honoring their championships are installed, reducing motivational effect and community celebration.
Inequitable Recognition: Space limitations create recognition disparities:
- Major sports (football, basketball) receiving disproportionate space: 67% of schools
- Emerging sports struggling for recognition: 54% of schools
- Individual achievements excluded due to space: 62% of schools
- Gender equity concerns raised regarding space allocation: 31% of schools
Space scarcity forces difficult allocation decisions that may conflict with equity goals and community expectations around recognition breadth.
Administrative Burden: Managing space constraints requires ongoing effort:
- Hours annually managing space allocation decisions: Mean 12.4 hours
- Community complaints/requests regarding recognition: Mean 8.7 per year
- Committee meetings addressing recognition policies: Mean 3.2 annually
Space management represents non-trivial administrative burden for athletic directors already managing extensive operational responsibilities.
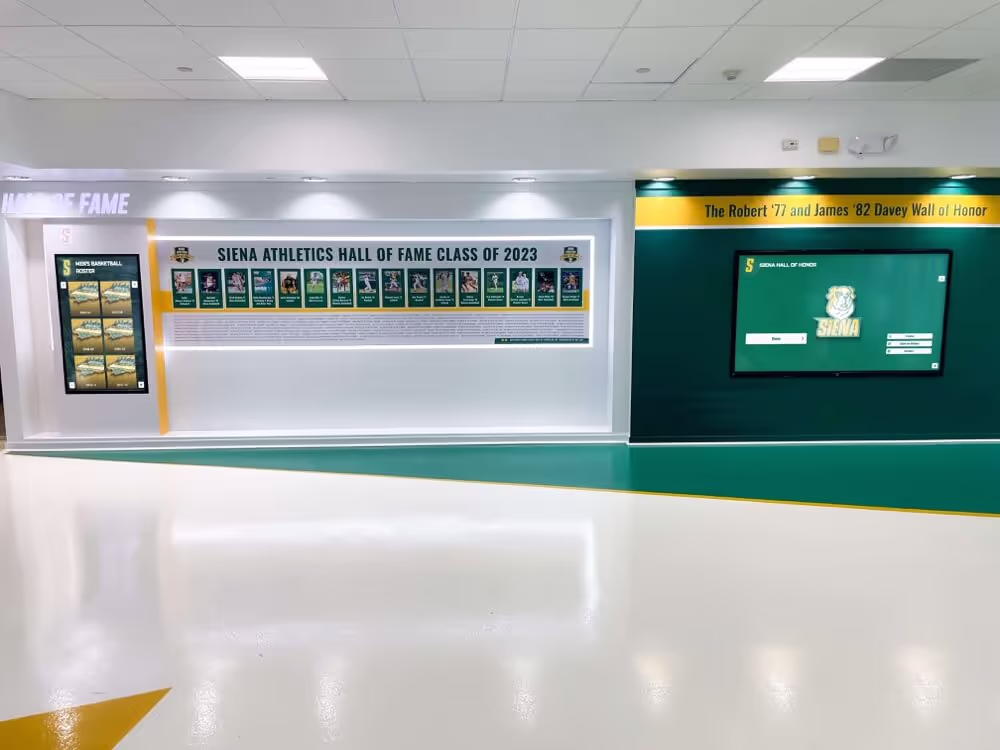
Digital Recognition Systems: Cost Analysis
Initial Investment Requirements
Schools replacing traditional banner programs with digital recognition displays report varying initial investments based on system scope and features:
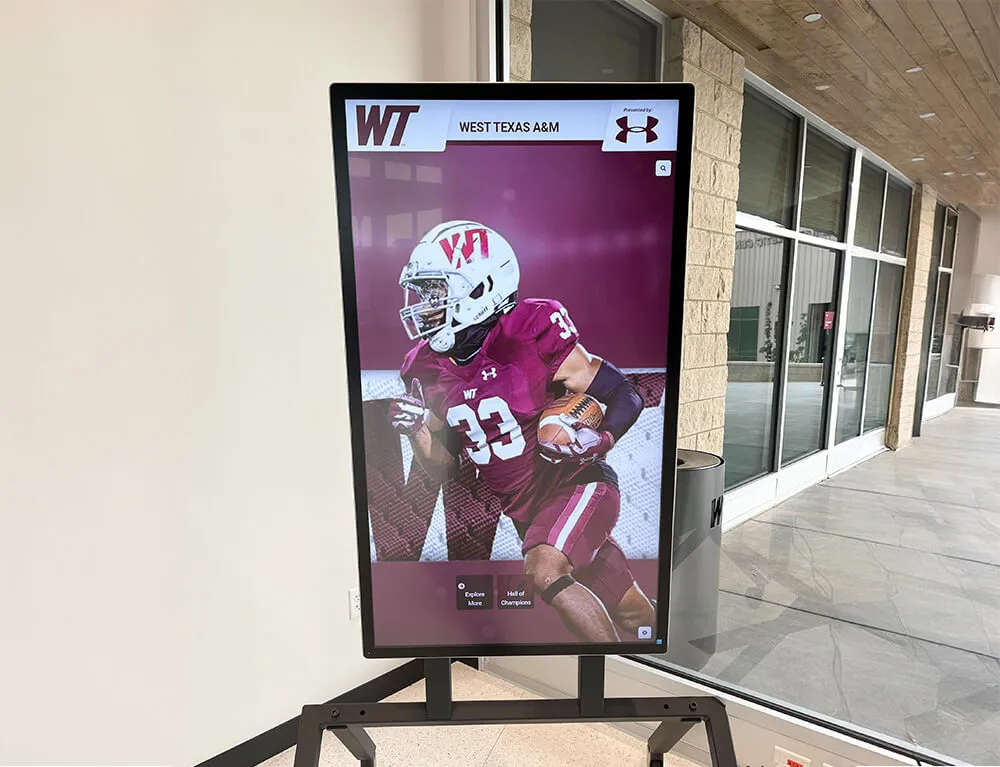
Hardware Costs: Digital display equipment represents the primary capital expenditure:
Single-Display Systems:
- 55-65" commercial touchscreen display: $4,000-$7,500
- Wall mounting hardware and installation: $600-$1,200
- Computing hardware (if not integrated): $400-$800
- Total single-display hardware: $5,000-$9,500
Multi-Display Systems:
- Three-display network: $13,000-$24,000 (hardware)
- Five-display network: $19,000-$36,000 (hardware)
- Installation economies of scale: 15-20% lower per-unit costs
Schools typically implement single displays initially, with 34% expanding to multi-display networks within 24 months as programs mature.
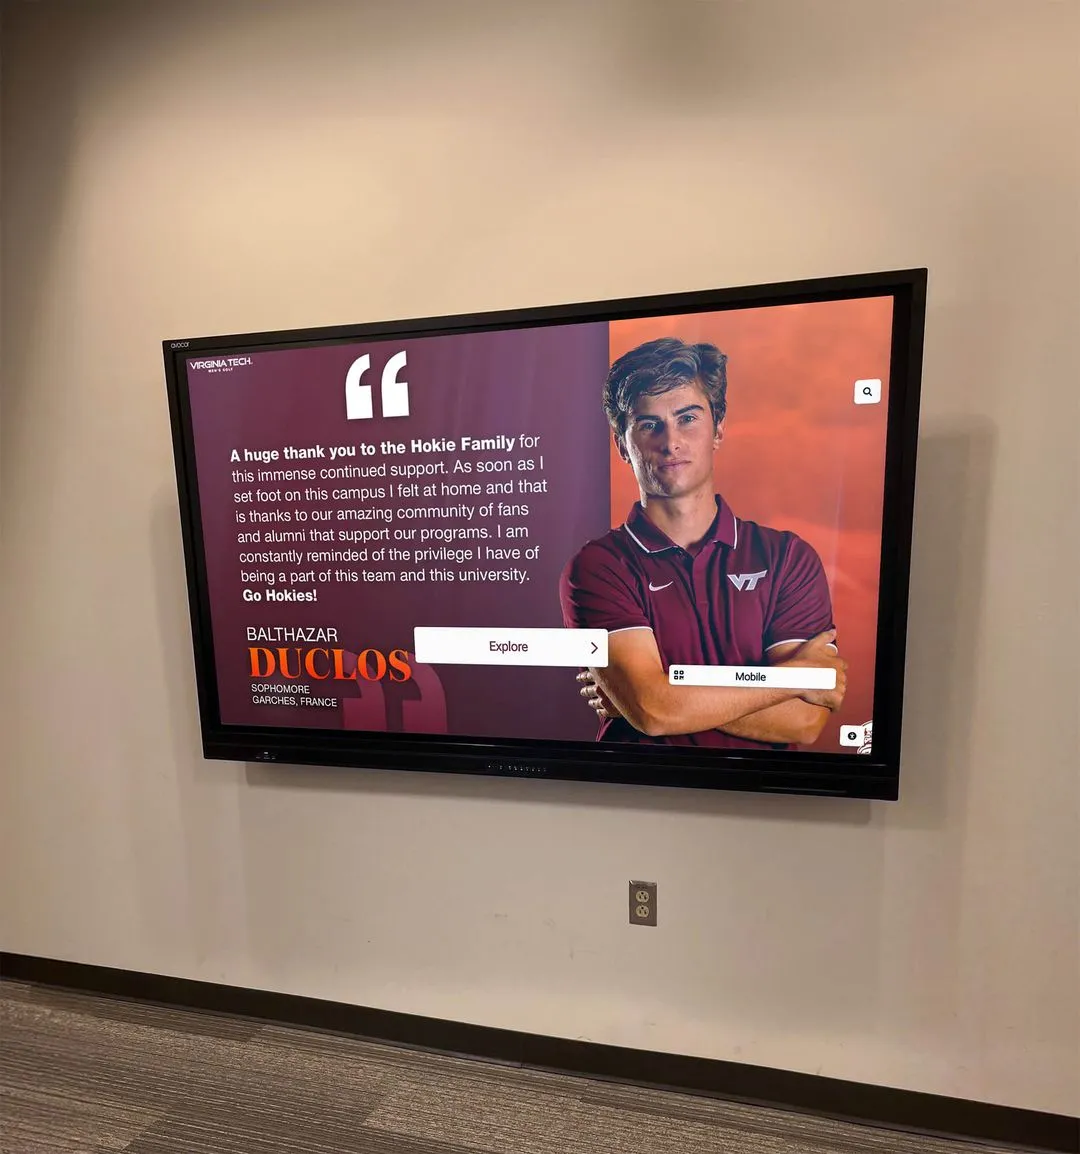
Software and Platform Costs: Recognition-specific software platforms vary widely in pricing:
- Basic digital signage software: $600-$1,800 annually
- Mid-tier recognition platforms: $2,400-$6,000 annually
- Comprehensive solutions (like Rocket Alumni Solutions): $6,000-$12,000 annually
- Enterprise systems for large institutions: $15,000-$30,000 annually
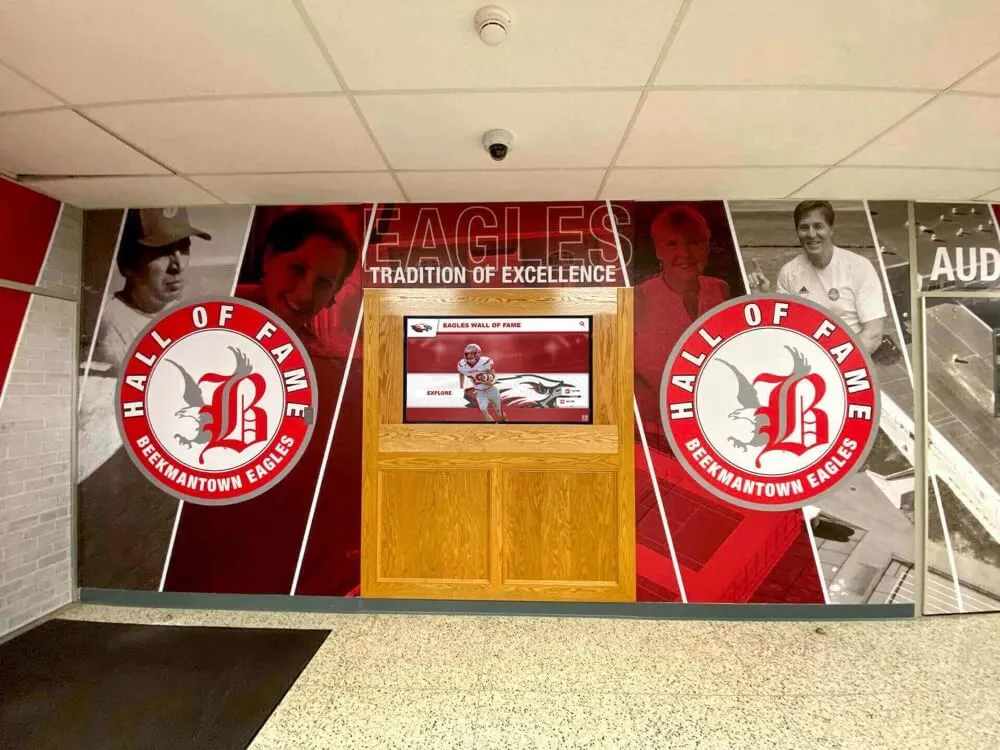
Purpose-built recognition platforms provide sports-specific features (record tracking, athlete profiles, searchable databases) unavailable in generic digital signage software. Schools using recognition-specific platforms report 3.8x higher engagement rates than generic signage implementations.
Content Development Costs: Initial system implementation requires content creation:
- Professional content migration services: $2,000-$6,000 (digitizing existing banners)
- In-house content development: $800-$2,400 (staff time for photos, data entry)
- Graphic design and templates: $400-$1,500 (if customized beyond platform defaults)
- Training and onboarding: $300-$800 (staff training on content management)
Schools investing in professional content migration report higher initial costs but faster time-to-launch (mean 6.2 weeks vs. 14.8 weeks for in-house development) and more polished initial presentation.
Total Initial Investment Summary:
Small Schools (single display, mid-tier platform):
- Hardware: $6,500
- Software (Year 1): $3,600
- Content development: $2,800
- Installation and setup: $900
- Total initial investment: $13,800
Medium-Large Schools (single display, comprehensive platform):
- Hardware: $8,200
- Software (Year 1): $7,200
- Content development: $4,200
- Installation and setup: $1,200
- Total initial investment: $20,800
Large Institutions (multi-display, enterprise platform):
- Hardware: $18,000
- Software (Year 1): $12,000
- Content development: $5,500
- Installation and setup: $2,400
- Total initial investment: $37,900

Ongoing Operating Costs
Following initial implementation, digital systems incur substantially lower ongoing costs than traditional banner programs:
Annual Software and Support Costs: Cloud-based platforms charge annual subscriptions:
- Basic platforms: $600-$1,800 annually
- Mid-tier platforms: $2,400-$6,000 annually
- Comprehensive platforms: $6,000-$12,000 annually (includes support, updates, hosting)
Subscription pricing typically includes software updates, cloud hosting, technical support, and platform improvements—services unavailable in traditional banner programs. Schools report support response times averaging 8.4 hours for mid-tier and premium platforms.
Content Management Time: Ongoing content updates require staff time:
- Time adding new achievements: 15-30 minutes per achievement (vs. weeks for banner production)
- Annual content management hours: Mean 18 hours (vs. 34 hours for banner programs)
- Staff profile: Non-technical staff can manage most platforms after initial training
Digital systems reduce administrative burden by 47% compared to traditional banner program management, with faster turnaround enabling recognition within days of achievements rather than months.
Hardware Maintenance and Replacement: Digital displays require minimal ongoing maintenance:
- Commercial display lifespan: 50,000-60,000 hours (8-10 years continuous operation)
- Annual maintenance costs: $180-$400 (primarily electricity, minimal service)
- Hardware replacement reserve: $600-$900 annually (amortized replacement cost)
Total annual hardware costs average $780-$1,300, substantially lower than banner maintenance, cleaning, and replacement expenses.
Total Annual Operating Cost Summary:
Small Schools:
- Software/support: $3,600
- Content management: $810 (18 hours at $45/hour)
- Hardware maintenance: $280
- Total annual operating cost: $4,690
Medium-Large Schools:
- Software/support: $7,200
- Content management: $990 (18 hours at $55/hour)
- Hardware maintenance: $340
- Total annual operating cost: $8,530
Large Institutions:
- Software/support: $12,000
- Content management: $1,170 (18 hours at $65/hour)
- Hardware maintenance: $680 (multi-display systems)
- Total annual operating cost: $13,850
Comparative Cost Analysis: 10-Year Total Cost of Ownership
Comparing traditional banner programs against digital recognition systems over 10-year timeframes reveals substantial long-term cost differences:
Small Schools (under 800 students):
Traditional Banner Program (10 years):
- Annual banner costs: $2,480 x 10 = $24,800
- Banner replacement (10% annually): $1,890 x 10 = $18,900
- Hardware updates/repairs: $420 x 10 = $4,200
- Storage costs: $680 x 10 = $6,800
- Total 10-year cost: $54,700
Digital Recognition System (10 years):
- Initial investment: $13,800
- Annual operating costs: $4,690 x 10 = $46,900
- Hardware refresh (Year 8): $7,000
- Total 10-year cost: $67,700
Traditional system appears $13,000 cheaper over 10 years for small schools—however, this excludes the value of unlimited capacity, real-time updates, and enhanced engagement digital systems provide.
Medium Schools (800-1,800 students):
Traditional Banner Program (10 years):
- Annual banner costs: $4,310 x 10 = $43,100
- Banner replacement: $3,240 x 10 = $32,400
- Hardware updates/repairs: $720 x 10 = $7,200
- Storage costs: $820 x 10 = $8,200
- Total 10-year cost: $90,900
Digital Recognition System (10 years):
- Initial investment: $20,800
- Annual operating costs: $8,530 x 10 = $85,300
- Hardware refresh (Year 8): $8,500
- Total 10-year cost: $114,600
Traditional system shows $23,700 lower cost over 10 years—but space constraints typically force expensive gymnasium renovations ($15,000-$40,000) or recognition limitations that reduce program value.
Large Schools (1,800-3,000 students):
Traditional Banner Program (10 years):
- Annual banner costs: $6,320 x 10 = $63,200
- Banner replacement: $5,680 x 10 = $56,800
- Hardware updates/repairs: $1,040 x 10 = $10,400
- Storage costs: $1,100 x 10 = $11,000
- Space expansion (Year 5): $18,000
- Total 10-year cost: $159,400
Digital Recognition System (10 years):
- Initial investment: $37,900
- Annual operating costs: $13,850 x 10 = $138,500
- Hardware refresh (Year 8): $19,000
- Total 10-year cost: $195,400
At large school scale, traditional banners remain somewhat less expensive even including space expansion—however, digital systems eliminate space constraints entirely while providing substantially enhanced recognition capabilities.
Break-Even Analysis and ROI Timing
While 10-year comparisons favor traditional banner programs in pure cost terms for many school sizes, break-even analysis reveals important nuances:
Cost Crossover Points: For schools at or approaching gymnasium space capacity, digital systems achieve cost parity or advantages sooner:
Schools at 80%+ wall capacity:
- Avoiding space expansion ($18,000-$40,000): Accelerates digital ROI by 24-36 months
- Value of unlimited capacity: Enables 3.2x more recognition (difficult to quantify financially)
- Eliminated recognition delays: Achievements recognized within days rather than months
Schools requiring major space renovations:
- Digital systems become cost-competitive immediately when avoiding $25,000-$60,000 gymnasium renovations
- Schools deferring needed renovations due to cost constraints find digital systems eliminate the renovation requirement entirely
Intangible Value Considerations: Digital systems provide benefits difficult to quantify in pure cost terms:
- Unlimited recognition capacity eliminating triage decisions
- Real-time updates enabling immediate achievement recognition
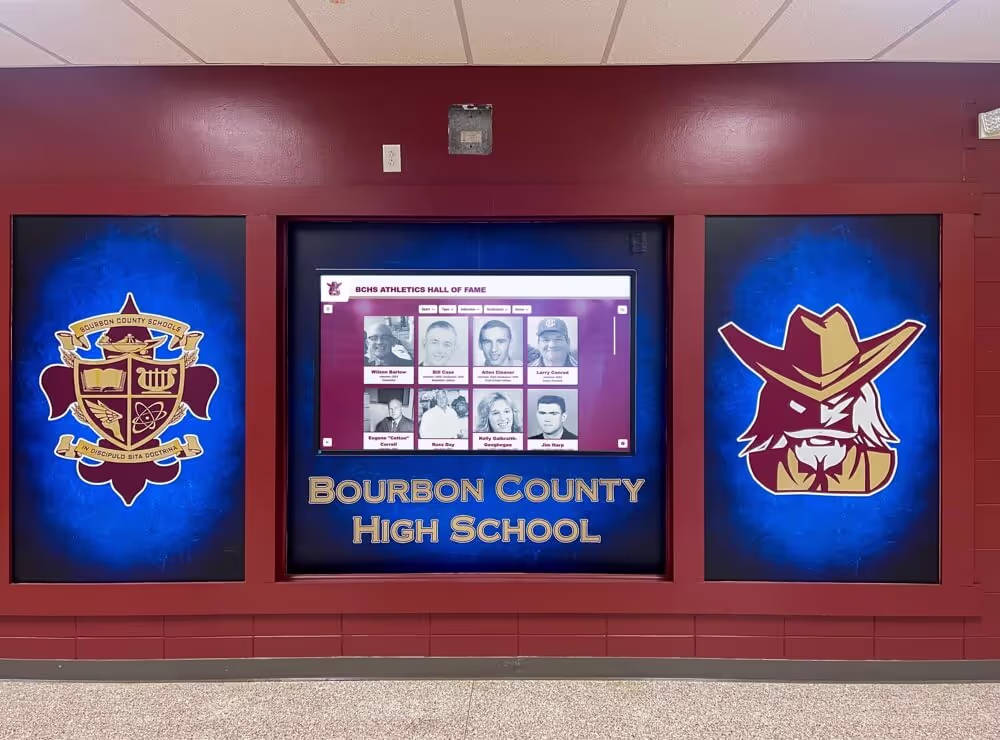
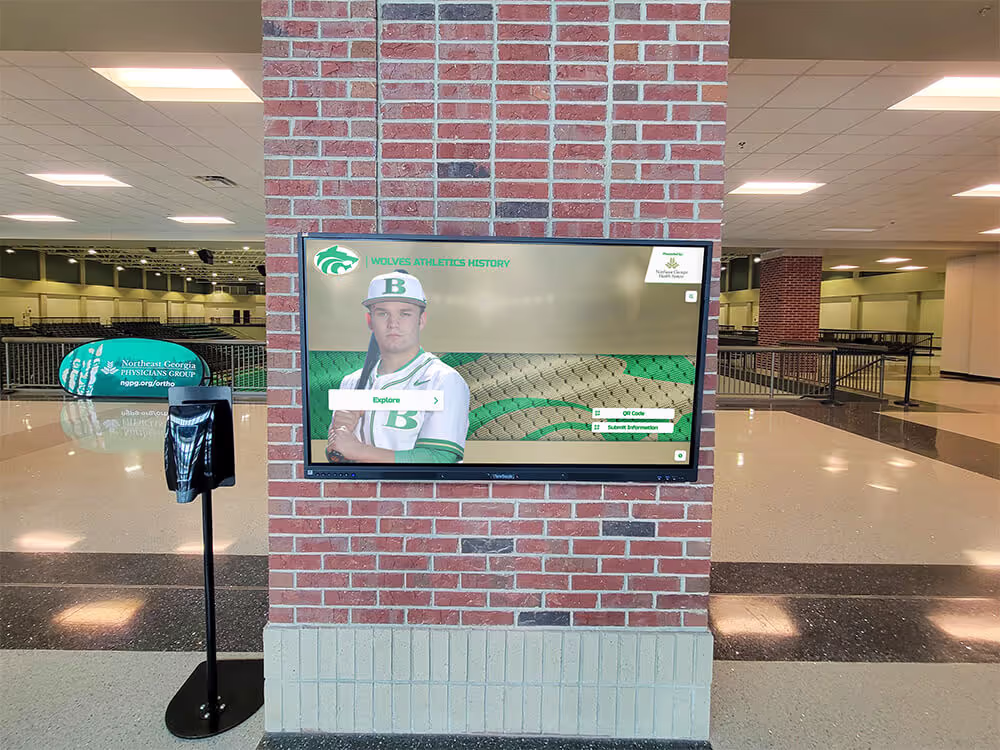
- Searchable databases enhancing alumni engagement
- Multimedia integration (photos, videos, statistics)
- Web and mobile access extending recognition beyond physical location
- Analytics tracking engagement and usage patterns
Schools report these qualitative benefits justify cost premiums for many institutions even when traditional banners appear financially cheaper in narrow cost comparisons.
Implementation Considerations and Decision Frameworks
When Digital Systems Make Financial Sense
Cost analysis reveals specific scenarios where digital recognition systems deliver clear financial advantages:
Space-Constrained Facilities: Schools meeting these criteria should prioritize digital systems:
- Current wall space utilization 75%+ capacity
- Programs averaging 4+ championships/banners annually
- Gymnasiums built before 1990 with limited wall space
- Institutions facing recognition delays due to space constraints
- Schools that have removed historical banners to accommodate new ones
For space-constrained schools, digital systems avoid expensive renovation costs ($18,000-$60,000) while eliminating capacity limitations entirely—creating immediate financial justification.
High-Volume Recognition Needs: Schools with extensive recognition requirements benefit from unlimited digital capacity:
- Large athletics programs (15+ sports)
- Institutions recognizing individual achievements, not just team championships
- Schools with multiple buildings/gymnasiums requiring recognition coordination
- Programs emphasizing equity and inclusion across all sports and activities
Digital systems eliminate “which achievements merit space” decisions, enabling comprehensive recognition aligned with equity and inclusion goals without budget multiplication.
Schools Valuing Enhanced Engagement: Institutions prioritizing alumni engagement and community connection find digital systems justify cost premiums:
- Schools with active alumni programs benefiting from searchable historical records
- Institutions using athletics for recruitment and development
- Programs emphasizing storytelling and athlete profiles beyond championship lists
- Schools seeking analytics on recognition engagement and usage patterns
While difficult to quantify precisely, enhanced engagement capabilities support fundraising and community relations objectives that traditional banner programs cannot address.
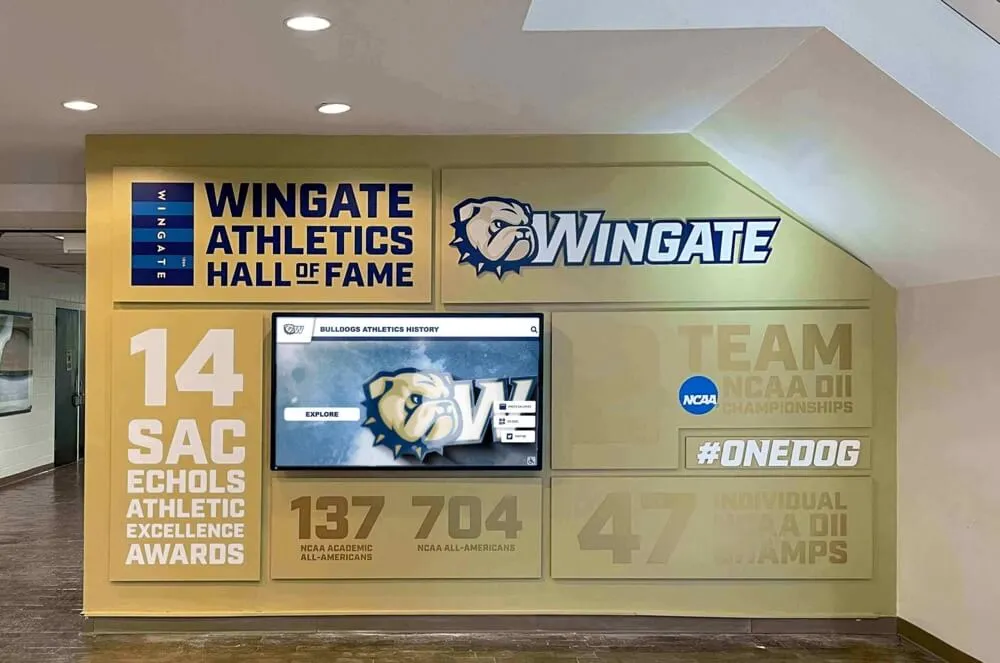
New Construction or Major Renovations: Schools planning facility projects should evaluate digital systems during design phase:
- Digital displays integrated into new construction: $8,000-$18,000 (vs. $25,000-$45,000 for premium traditional display infrastructure)
- Avoids designing for future space constraints
- Enables premium aesthetic integration impossible with retrofit installations
Digital systems specified during construction achieve cost parity or advantages compared to designing comprehensive traditional banner infrastructure.
When Traditional Banners Remain Appropriate
Cost analysis also reveals scenarios where traditional banner programs remain financially optimal:
Small Schools with Limited Recognition Volume: Institutions generating 2-3 championships annually with ample wall space:
- Wall space utilization under 50% with no near-term capacity concerns
- Limited budgets making $15,000-$25,000 initial investments prohibitive
- Strong community attachment to traditional recognition approaches
- Minimal staff technical capacity for managing digital systems
For small schools with adequate space and limited recognition volume, traditional banners deliver satisfactory recognition at lower total cost over 10-year timeframes.
Schools with Recent Banner Investments: Institutions having recently purchased substantial banner inventory:
- Schools with 2-3 year supply of unused banners already purchased
- Facilities having completed recent space expansion projects
- Programs with newly installed mounting infrastructure
Schools with sunk costs in traditional programs should maximize value from existing investments before transitioning to digital systems, potentially implementing hybrid approaches initially.
Budget-Constrained Situations: While digital systems offer long-term savings, initial investment requirements exceed available budgets for some schools:
- Capital budgets under $5,000 annually
- No access to one-time funding sources (grants, donations, bond funds)
- Competing facility priorities consuming available capital
Budget-constrained schools may need to continue traditional programs until funding circumstances improve, potentially pursuing grants or donor funding specifically for digital recognition systems.
Strong Traditional Program Identity: Some schools maintain strong traditions around physical banners:
- Established ceremonies around banner unveiling and installation
- Community expectations around tangible physical recognition
- Historical collections viewed as institution defining features
While not strictly financial considerations, strong traditional program identity may justify continuing banner programs despite higher long-term costs for institutions where transition would generate significant community resistance.
Hybrid Approaches and Transition Strategies
Incremental Transition Models
Schools need not make immediate all-or-nothing decisions between traditional and digital systems. Hybrid approaches allow incremental transitions:
Freeze-and-Add Strategy: Maintain existing banners while adding only digital recognition going forward:
- Leave current banner displays unchanged
- Implement digital system for new achievements
- Avoid banner removal controversy while gaining digital benefits
- Gradual community acclimation to digital recognition
- Total cost: Traditional maintenance + digital system costs for 3-5 years
This approach costs more during transition but minimizes disruption and community resistance. Schools report 89% satisfaction with freeze-and-add strategies versus 62% satisfaction with immediate full replacement.
Priority Sport Pilot Programs: Implement digital recognition for specific sports initially:
- Select high-profile sports (football, basketball) for digital pilot
- Maintain traditional banners for other sports during evaluation period
- Assess community reception and operational experience before full implementation
- Expand to additional sports based on pilot success
Pilot programs reduce initial investment (single display serving 2-3 sports) while building institutional confidence and capability before comprehensive transition.
New-Only Digital Recognition: Continue adding traditional banners while implementing digital systems for enhanced storytelling:
- Maintain traditional banner program for championship recognition
- Add digital displays providing athlete profiles, statistics, and historical context
- Digital systems complement rather than replace traditional recognition
- Leverage digital for content impossible in banner format (video, detailed records)
Complementary approaches cost most (maintaining both systems) but deliver maximum recognition breadth. Schools using hybrid approaches report 47% higher alumni engagement than traditional-only programs.
Funding Strategies for Digital System Implementation
Initial investment requirements represent the primary barrier to digital system adoption. Schools employ various funding strategies:
Capital Budget Allocation: Many schools fund digital systems through planned capital budgets:
- Athletic facility improvement allocations
- Technology infrastructure budgets
- Multi-year budget planning spreading costs across fiscal years
- Coordination with other facility projects reducing installation costs
Schools budgeting 18-24 months ahead for digital system implementation report 91% successful procurement versus 64% success rates for unfunded initiatives seeking emergency budget allocations.
Booster Club and Donor Funding: Athletics booster organizations frequently support recognition system upgrades:
- Capital campaigns specifically for recognition systems: $15,000-$40,000 typical targets
- Memorial gifts honoring deceased alumni, coaches, or community members
- Corporate sponsorship opportunities (naming rights, branding integration)
- Alumni reunion giving campaigns
Schools report 73% success rate securing booster/donor funding for digital recognition systems when positioned as legacy projects honoring program history while enabling future recognition.
Grant Opportunities: Various grant sources support athletic facility improvements:
- State athletics association grants
- Local community foundation grants
- Corporate foundation education grants
- Equipment and facility improvement grants from sporting goods manufacturers
Grant funding typically requires detailed proposals justifying recognition system investments in terms of student benefit, equity, and community impact. Schools emphasizing unlimited capacity enabling equitable recognition report higher grant success rates.
Lease and Financing Options: Some vendors offer financing arrangements spreading costs:
- 36-60 month equipment leasing: $400-$900 monthly payments
- Software-as-a-service models eliminating upfront software costs
- Vendor financing programs (variable availability)
Financing converts large initial investments into manageable annual expenses, though total costs increase 12-18% due to interest and financing fees.
What This Means for Schools
Actionable Insights for Athletic Directors
This cost analysis reveals several critical implications for athletic program leaders:
Space Constraints Drive Economic Case: Schools at 75%+ gymnasium wall capacity face inevitable space expansion costs ($18,000-$60,000) or recognition limitations. Digital systems eliminate space constraints while delivering comparable or lower total costs versus traditional programs plus renovation expenses.
True Banner Program Costs Exceed Initial Estimates: Schools self-reporting $2,000-$4,000 annual banner budgets actually spend $3,800-$7,200+ when including installation, maintenance, replacement, storage, and administrative time. Comprehensive cost accounting reveals that digital system operating costs ($4,700-$13,800 annually) often compare favorably to fully-loaded traditional program expenses.
Initial Investment Timing Is Critical: Schools planning facility renovations should specify digital recognition systems during design phase, achieving cost parity with traditional infrastructure while gaining capacity advantages. Retrofit installations cost 25-35% more than new construction integration.
Phased Approaches Reduce Risk: Schools uncertain about digital transitions should implement pilot programs or hybrid approaches rather than delaying indefinitely. Incremental strategies build institutional capability while demonstrating value before full commitment.
Engagement Value Justifies Cost Premiums for Many Schools: While narrow cost comparisons sometimes favor traditional banners, digital systems enable recognition breadth, immediacy, and storytelling capabilities impossible with physical banners. Schools prioritizing alumni engagement, equity, and comprehensive recognition find these qualitative benefits justify cost premiums.
Decision Framework for Recognition System Selection
Schools should evaluate recognition system investments using structured decision criteria:
Space Capacity Assessment:
- Current wall space utilization percentage
- Annual banner additions forecast
- Years until capacity exhaustion
- Cost of space expansion if needed
Schools approaching capacity within 3-5 years should prioritize digital systems avoiding future renovation costs.
Budget and Funding Analysis:
- Available capital budget for initial investment
- Annual operating budget for ongoing costs
- Potential funding sources (boosters, donors, grants)
- Total 10-year cost comparison
Schools with access to capital funding should evaluate total cost of ownership rather than focusing narrowly on initial investment barriers.
Recognition Program Goals:
- Recognition breadth desired (team vs. individual, major vs. all achievements)
- Equity and inclusion priorities
- Historical preservation objectives
- Alumni engagement and community connection goals
Schools emphasizing comprehensive recognition and engagement should weight digital system advantages heavily despite potential cost premiums.
Institutional Context:
- Technical capacity for managing digital systems
- Community attachment to traditional approaches
- Facility planning and renovation timeline
- Integration with other athletics program objectives
Context-specific factors often prove decisive when cost comparisons show relatively similar total expenses.
Implementation Timeline:
- Urgency of recognition capacity needs
- Availability of funding and approval processes
- Staff availability for project management
- Coordination with other facility projects
Schools facing immediate capacity crises may need interim solutions regardless of long-term optimal approaches.
Hybrid Strategy Recommendations
For many schools, hybrid approaches optimize cost, risk, and program effectiveness:
Recommended Transition Path (schools at 60-80% capacity):
Phase 1 (Year 1): Implement single digital display for football and basketball recognition
- Investment: $18,000-$25,000
- Continue traditional banners for other sports
- Assess community reception and operational experience
Phase 2 (Year 2-3): Expand digital system to additional sports
- Investment: $8,000-$12,000 (additional display or software expansion)
- Freeze traditional banner additions except high-priority championships
- Build comprehensive digital content library
Phase 3 (Year 4-5): Complete transition to fully digital recognition
- Investment: $6,000-$10,000 (remaining sports integration)
- Retain existing traditional banners in place (freeze-and-add approach)
- Maximize digital system capabilities
Total 5-year investment: $32,000-$47,000 spread across budget cycles Result: Comprehensive digital recognition system without community disruption from abrupt changes
This phased approach costs more during transition than immediate full implementation but substantially reduces risk while building institutional support and capability incrementally.

Conclusion: Strategic Cost Considerations for Athletic Recognition
The financial analysis of traditional gym banner programs versus digital recognition systems reveals a more nuanced picture than simple cost comparisons suggest. Traditional banner programs show lower 10-year total costs for small schools with ample wall space and limited recognition volume. However, most schools face space constraints, recognition equity challenges, and engagement objectives that substantially diminish traditional program advantages.
Schools at or approaching gymnasium wall capacity face inevitable space expansion costs—typically $18,000-$60,000 for renovation projects creating additional banner display infrastructure. When these avoided costs enter calculations, digital recognition systems achieve cost parity or advantages while delivering unlimited recognition capacity that physical space expansions cannot match.
The data demonstrates that schools self-reporting $2,000-$4,000 annual banner budgets actually spend $3,800-$7,200+ when comprehensive cost accounting includes installation hardware, maintenance, banner replacement, storage, and administrative time. Digital system annual operating costs of $4,700-$13,800 compete favorably with fully-loaded traditional program expenses while eliminating space constraints and enabling substantially enhanced recognition capabilities.
Beyond narrow cost comparisons, digital recognition systems address challenges impossible to solve through traditional banner programs: unlimited recognition capacity supporting equity across all sports and achievement levels, real-time recognition enabling celebration within days rather than months, searchable databases supporting alumni engagement, and analytics quantifying recognition program impact. These qualitative advantages justify cost premiums for schools where recognition serves strategic objectives beyond simply displaying championship lists.
For schools evaluating recognition system investments, the optimal approach depends on institutional context: current space utilization, recognition volume and goals, available funding, technical capacity, and community culture. Space-constrained schools benefit immediately from digital systems avoiding renovation costs. Budget-constrained schools with adequate space may continue traditional programs until funding improves. Many schools benefit from hybrid approaches implementing digital systems incrementally while maintaining existing traditional infrastructure.
The recognition technology landscape has evolved to provide viable alternatives to expensive banner programs consuming limited gymnasium space. Athletic directors and facilities managers should evaluate comprehensive costs, space trajectories, and program objectives when planning recognition investments. Schools approaching capacity constraints particularly should assess whether continuing traditional programs ultimately costs more than transitioning to digital systems eliminating space limitations entirely.
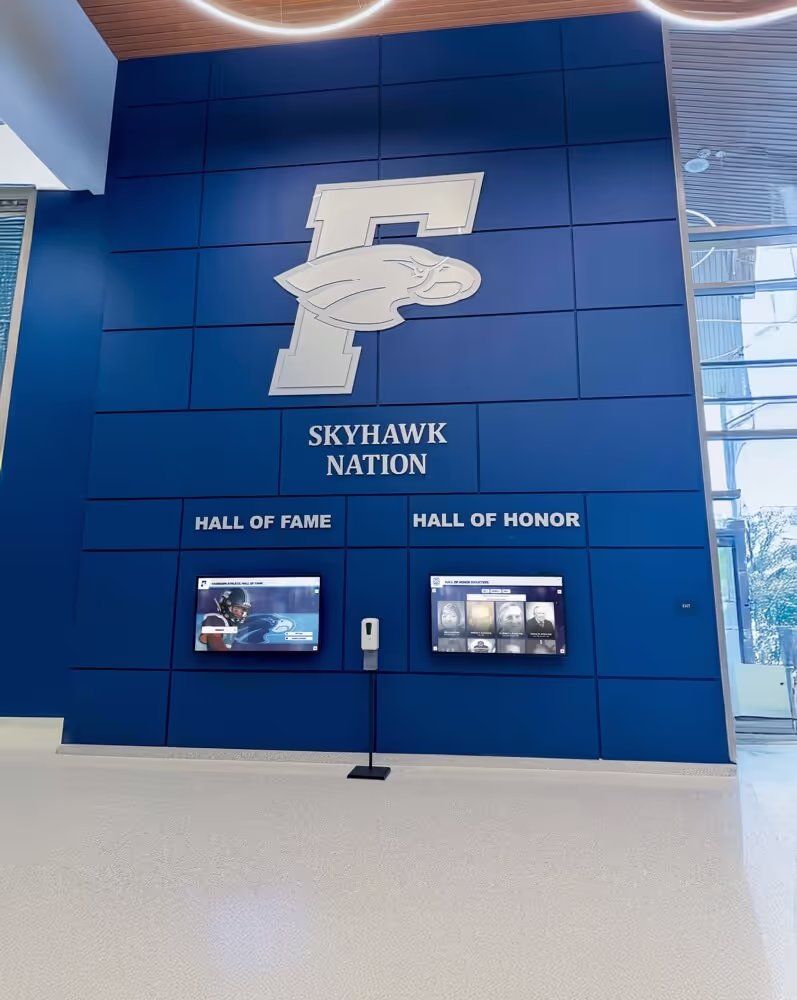
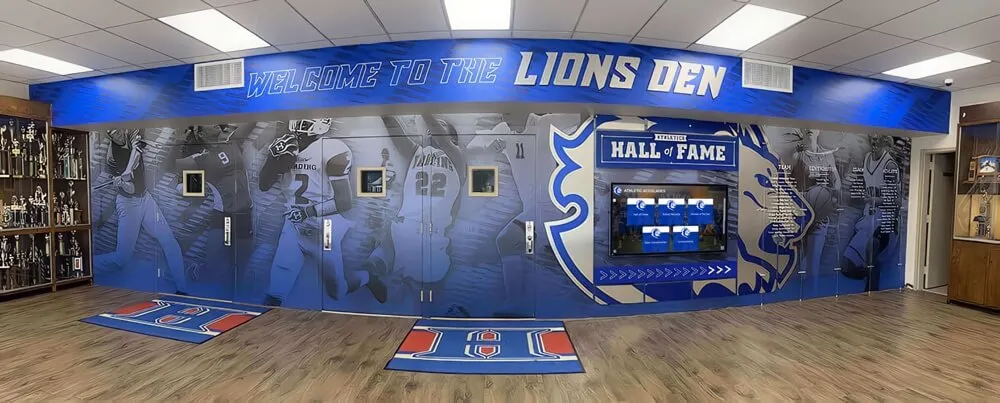
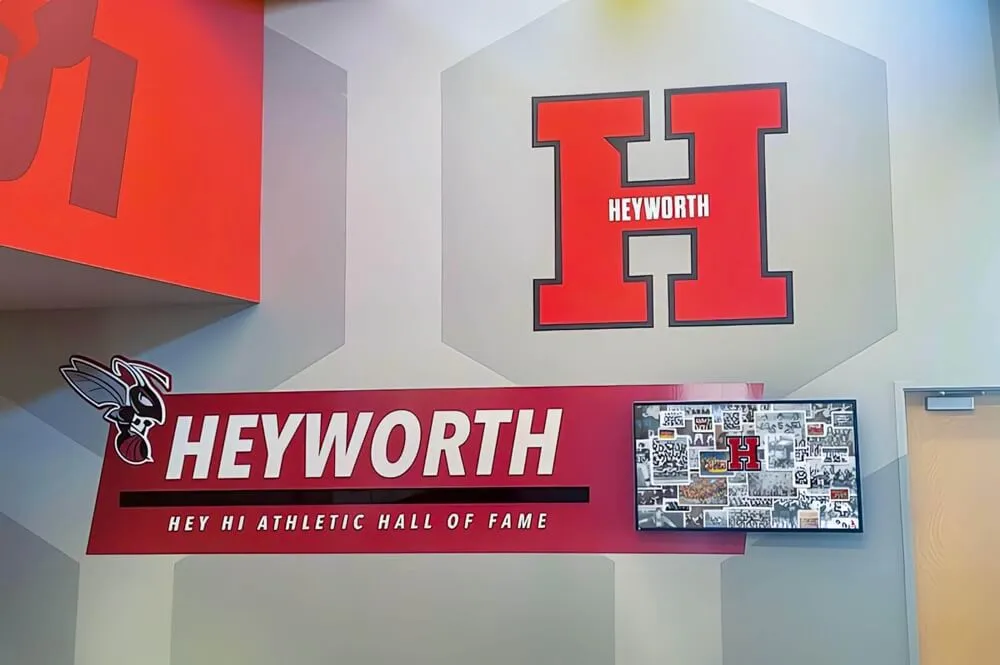
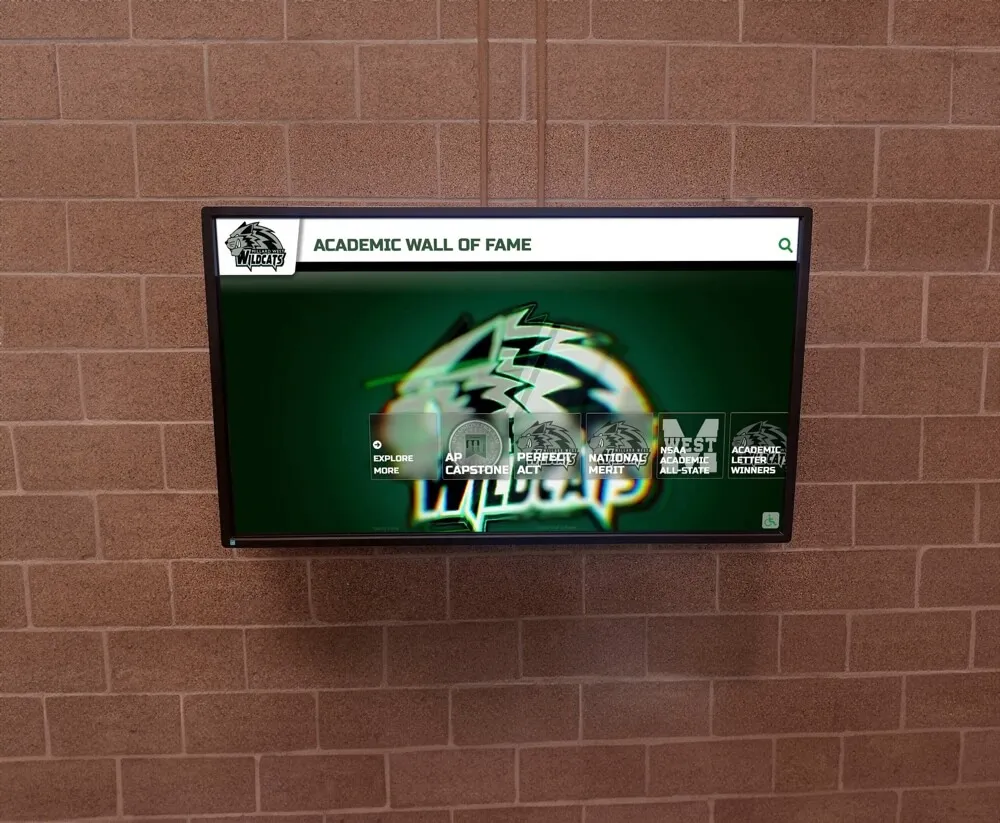
For schools ready to explore digital recognition systems that address both cost and capacity challenges, platforms like Rocket Alumni Solutions provide turnkey implementations specifically designed for athletic programs. These state championship banner display solutions eliminate space constraints while delivering comprehensive recognition capabilities impossible with traditional approaches.
Schools seeking to understand how digital recognition might support institutional objectives, exploring cost-benefit analysis for their specific context, or planning recognition system transitions can request a consultation to discuss implementation approaches, budget planning, and transition strategies aligned with program goals and financial constraints.
Frequently Asked Questions
How much does a typical championship banner cost?
What is the total cost of ownership for gym banner programs?
How much does a digital recognition system cost?
When do digital recognition systems make financial sense?
What hidden costs do banner programs have?
How do schools fund digital recognition system transitions?
What is the best transition strategy from banners to digital?
Sources
- Anderson, R. (2026). School Facility Maintenance Benchmarks. National Center for Education Statistics. https://nces.ed.gov/
- Athletic Banner Manufacturers Association. (2026). Industry Pricing Survey 2026.
- National Federation of State High School Associations. (2026). Athletic Facility Standards and Guidelines. https://www.nfhs.org/
- School Planning & Management. (2026). Athletic Facility Renovation Costs Report. https://webspm.com/