Why Measuring ROI Matters for Digital Recognition Systems
Investing in a digital hall of fame represents a significant commitment—typically ranging from $10,000 to $250,000 or more depending on scope and scale. While the emotional value of honoring achievements is clear, demonstrating concrete return on investment (ROI) to stakeholders, administrators, and board members requires systematic measurement and data-driven insights.
This comprehensive guide provides frameworks, metrics, and methodologies for measuring and demonstrating the tangible and intangible returns from your digital hall of fame investment. Whether you’re building a business case for initial approval or tracking performance post-implementation, these measurement strategies will help you quantify value and optimize results.
Table of Contents
- Understanding ROI Components for Digital Recognition
- Engagement Metrics: Measuring User Interaction
- Financial Impact Tracking
- Alumni and Community Engagement Indicators
- Operational Efficiency Gains
- Brand Value and Reputation Enhancement
- Fundraising and Development Impact
- Setting Up Your Analytics Framework
- Benchmark Standards and Industry Comparisons
- Reporting ROI to Stakeholders
1. Understanding ROI Components for Digital Recognition
Digital hall of fame ROI extends far beyond simple cost-benefit calculations. A comprehensive measurement approach captures both quantifiable financial metrics and harder-to-measure intangible benefits that deliver substantial organizational value.
The Three Pillars of Digital Hall of Fame ROI
Direct Financial Returns
- Cost savings vs. traditional displays
- Revenue generation opportunities
- Operational efficiency gains
- Resource reallocation benefits
Engagement and Reach
- User interaction rates
- Content consumption patterns
- Digital footprint expansion
- Community participation growth
Strategic Value Creation
- Brand equity enhancement
- Alumni loyalty strengthening
- Recruitment advantages
- Development pipeline growth
Traditional ROI Formula Adapted for Recognition Systems
While the basic ROI formula provides a starting point, digital hall of fame measurement requires adaptation:
Standard ROI = (Net Benefits - Total Costs) / Total Costs × 100

Digital Hall of Fame ROI = (Direct Cost Savings + Revenue Gains + Valued Benefits) - (Initial Investment + Operating Costs) / (Initial Investment + Operating Costs) × 100
The challenge lies in accurately valuing benefits like increased alumni engagement, enhanced institutional reputation, and improved community connections. This guide provides frameworks for quantifying these intangible returns.
2. Engagement Metrics: Measuring User Interaction
Engagement metrics provide the foundation for understanding how effectively your digital hall of fame captures attention and delivers value to visitors.
Primary Engagement KPIs
Session Duration and Depth
Track how long visitors interact with your digital hall of fame and how deeply they explore content:
- Average session length: Target 3-5 minutes for engaged exploration
- Pages per session: 4-7 pages indicates active browsing behavior
- Return visit rate: 15-25% suggests compelling, revisit-worthy content
- Bounce rate: Under 40% demonstrates initial engagement success
Interaction Patterns
Understanding how users navigate your digital hall of fame reveals content effectiveness:
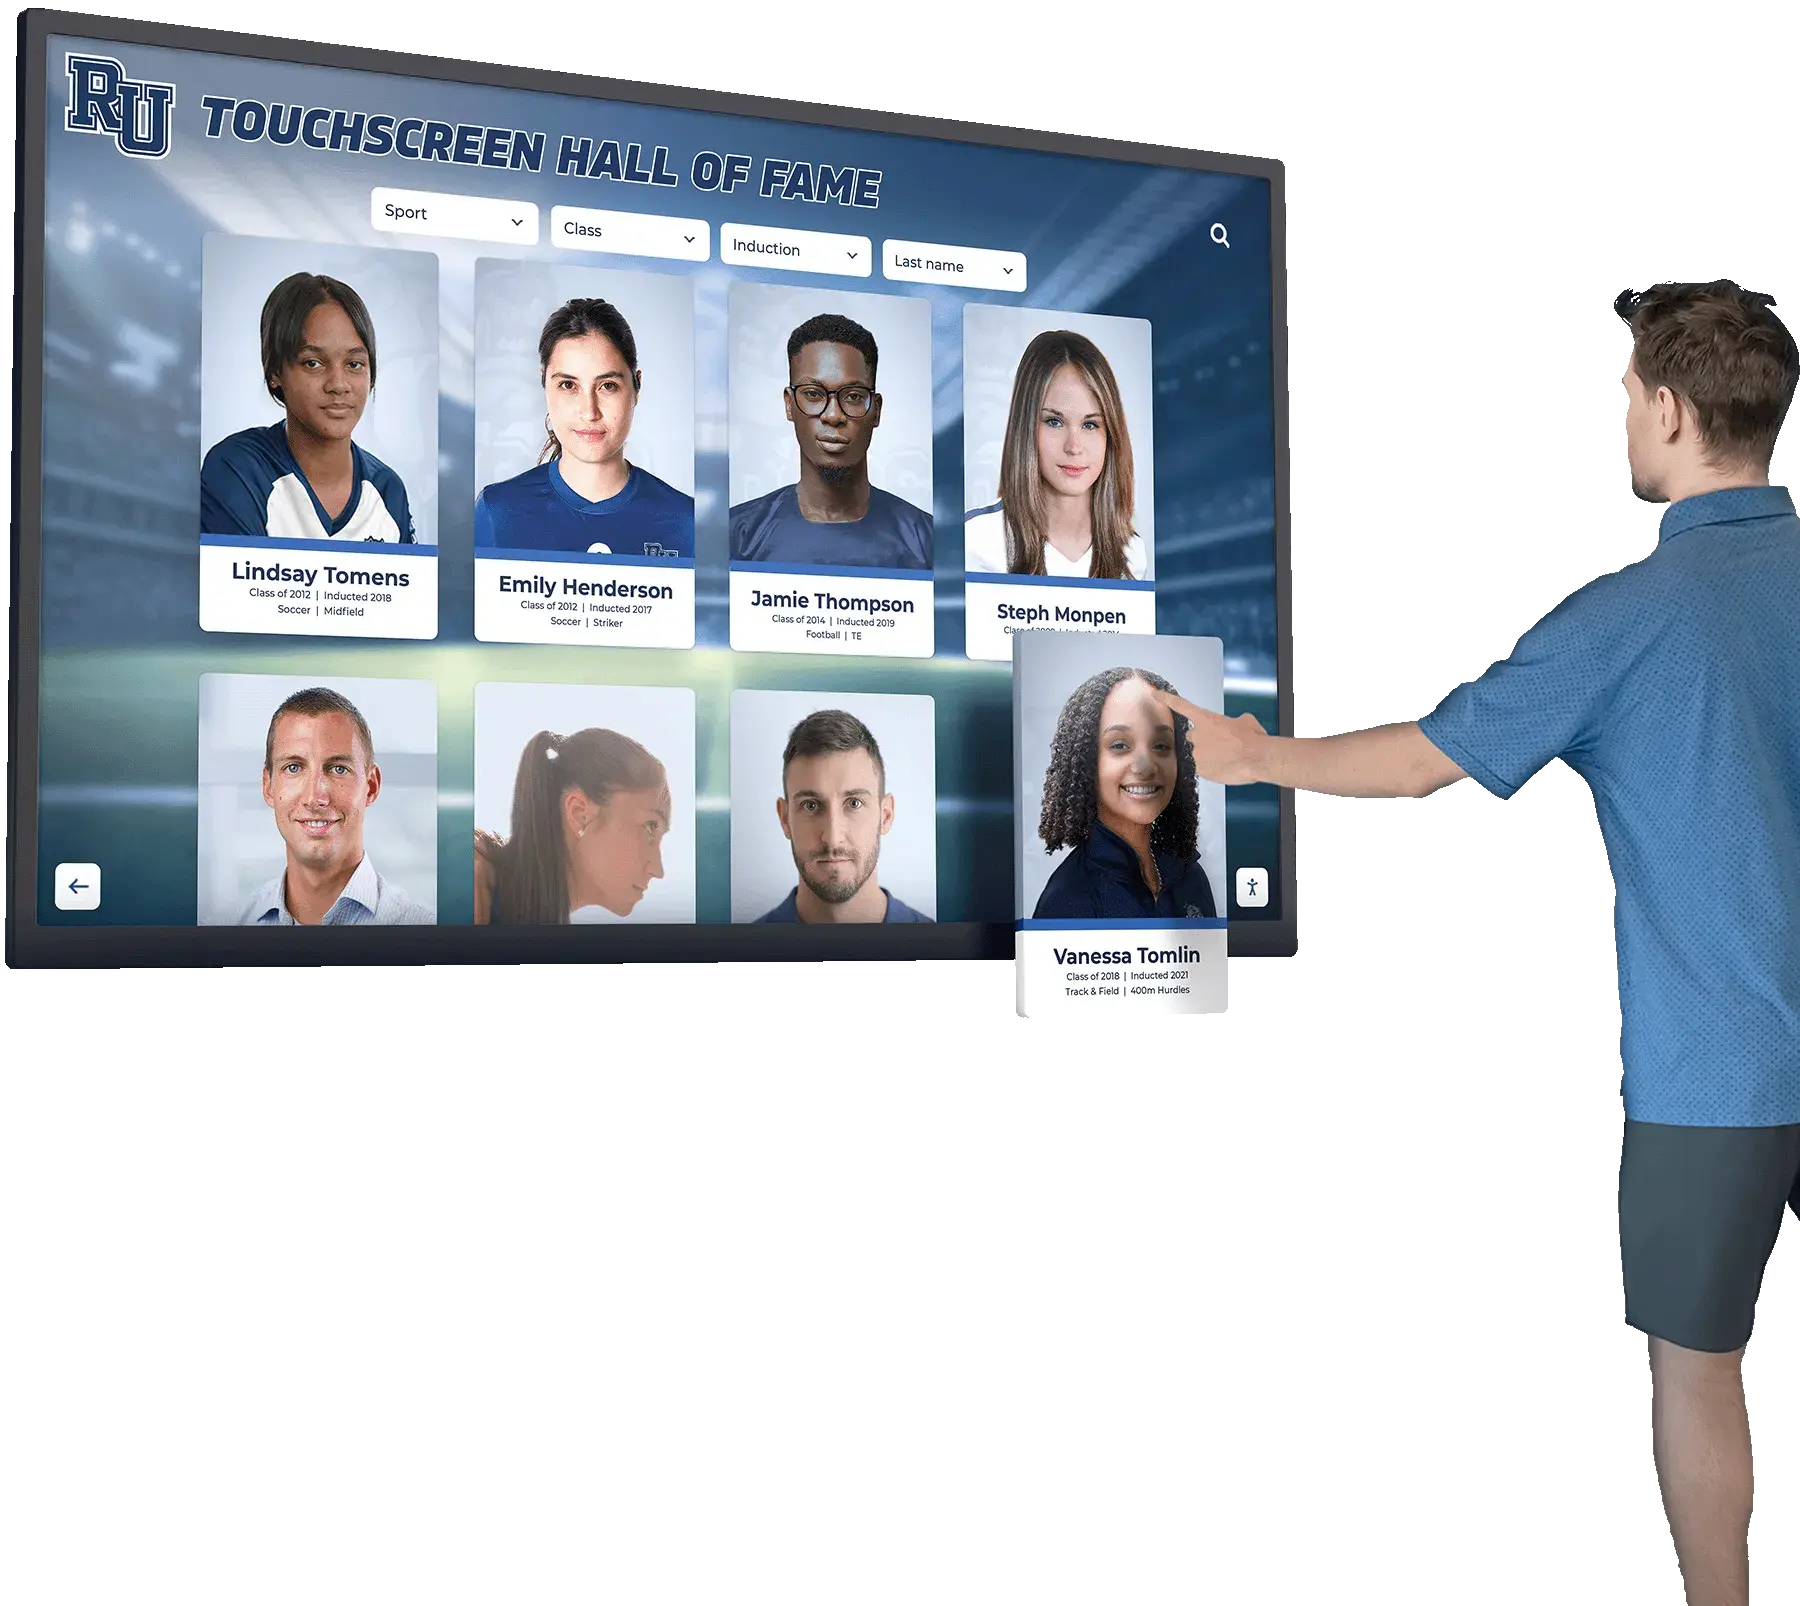
- Feature utilization rates: Which search, filter, and exploration tools get used most
- Content type preferences: Video views vs. photo galleries vs. text biographies
- Peak usage times: When are visitors most engaged with the display
- Touch/tap heatmaps: Which screen areas attract attention and interaction
Advanced Engagement Metrics
Content Performance Analysis
Top Performing Content:
- Most viewed honoree profiles
- Highest engagement achievement categories
- Popular time periods or eras
- Frequently shared content items
- Trending search terms and queries
Engagement Depth Indicators:
- Video completion rates (target: 60%+)
- Gallery browsing patterns
- Interactive element usage
- External link click-through rates
- Social sharing frequency
Comparative Performance Tracking
Establish baseline measurements and track improvements over time:
- Month-over-month engagement growth
- Year-over-year interaction increases
- Seasonal variation patterns
- Event-driven engagement spikes
- Content update impact assessment
Solutions like Rocket Alumni Solutions provide built-in analytics dashboards that track these engagement metrics automatically, making it easy to monitor performance without technical expertise.
3. Financial Impact Tracking
Quantifying direct financial benefits provides concrete ROI evidence that resonates with budget-conscious stakeholders.
Direct Cost Savings
Traditional Display Replacement Savings
Calculate annual costs avoided by eliminating or reducing traditional physical recognition:
Traditional Plaque Production Costs:
- Individual plaques: $150-$500 each
- Annual additions: 10-25 honorees
- Installation labor: $500-$1,500 annually
- Updates and corrections: $300-$800 annually

Annual Traditional Display Costs: $2,500-$14,000

Digital Hall of Fame Operating Costs:
- Software licensing: $1,200-$6,000 annually
- Content updates (staff time): $800-$2,000
- Technical maintenance: $500-$1,500

Annual Digital Operating Costs: $2,500-$9,500

Potential Annual Savings: $0-$4,500+
Space Utilization Value
Digital displays consolidate recognition into smaller footprints, freeing valuable wall space:
- Wall space freed: 200-800 square feet typical
- Institutional space value: $50-$200 per square foot annually
- Total space value realized: $10,000-$160,000
Maintenance and Damage Prevention
Physical displays require ongoing upkeep that digital systems eliminate:
- Cleaning and polishing: $400-$1,200 annually
- Damage repair (broken glass, stolen plaques): $500-$3,000 annually
- Lighting replacement and electrical: $300-$900 annually
Revenue Generation Opportunities
Sponsorship and Advertising Integration
Digital displays enable tasteful sponsorship opportunities that traditional walls cannot:
- Corporate sponsor recognition: $2,500-$15,000 annually
- Event sponsor promotion: $1,000-$5,000 per event
- Alumni business directory listings: $500-$3,000 annually
Enhanced Fundraising Tools
Digital halls of fame strengthen development efforts:
- Donor recognition displays that update in real-time
- Giving level visualization and progress tracking
- Integrated giving opportunities and calls-to-action
- Average fundraising impact: 15-30% increase in alumni giving rates
4. Alumni and Community Engagement Indicators
Measuring how your digital hall of fame strengthens community connections provides crucial ROI evidence for relationship-focused organizations.
Alumni Engagement Metrics
Direct Interaction Measures
Track how alumni engage with digital recognition:
- Alumni portal registrations and profile completions
- Event attendance and participation rates
- Email open rates and click-through improvements
- Social media engagement with shared content
- Database updates and information refreshes
Relationship Strength Indicators
Participation Depth:
- Volunteer sign-ups and activity
- Mentorship program engagement
- Campus visit frequency
- Referral and recruitment support
- Annual survey response rates
Connection Quality:
- Alumni-to-alumni networking activity
- Cross-generational interaction increases
- Geographic reach expansion
- Career services utilization
- Legacy and planned giving discussions
Community Impact Measurement
Institutional Pride Indicators
Measure how recognition displays strengthen community identity:
- Visitor center traffic increases: 20-40% typical growth
- Tour group feedback improvements: 25-35% satisfaction gains
- Media mentions and external coverage frequency
- Social media sentiment analysis showing positive associations
- Community survey results on institutional pride
Current Student/Member Inspiration
Track aspirational impact on current community members:
- Goal-setting and achievement motivation surveys
- Program participation in recognized activities
- Academic excellence and athletic achievement trends
- Leadership program applications and engagement
- Retention and persistence improvements
5. Operational Efficiency Gains
Digital hall of fame systems streamline administrative processes, freeing staff time for higher-value activities.
Time Savings Quantification
Content Management Efficiency
Compare time requirements for traditional vs. digital recognition updates:
Traditional Physical Display Updates:
- Design approval process: 4-8 hours
- Vendor coordination: 3-5 hours
- Production timeline: 2-4 weeks
- Installation scheduling: 2-4 hours
- Quality verification: 1-2 hours

Total Time Investment: 10-19 hours per update cycle

Digital Display Updates:
- Content entry: 30-60 minutes
- Approval workflow: 1-2 hours
- Publication: Immediate
- Quality review: 15-30 minutes

Total Time Investment: 2-4 hours per update cycle

Time Savings: 6-15 hours per update cycle (60-80% reduction)
Value of Staff Time Reclaimed
Calculate the dollar value of administrative efficiency:
- Average staff hourly rate: $25-$50
- Hours saved annually: 50-150 hours
- Annual staff time value: $1,250-$7,500
Process Improvement Benefits
Workflow Optimization
Digital systems streamline multi-step processes:
- Nomination and selection process digitization
- Automated approval routing and notifications
- Content collection and organization systems
- Historical record preservation and accessibility
- Reduced vendor management overhead
Error Reduction and Quality Improvement
Digital content management prevents common physical display mistakes:
- Spelling and factual error corrections: Instant vs. costly replacement
- Information consistency across platforms
- Version control and audit trail capabilities
- Preview and testing before publication
Content management systems for digital recognition like those offered by Rocket Alumni Solutions make these efficiency gains accessible to organizations of all sizes.
6. Brand Value and Reputation Enhancement
While challenging to quantify precisely, brand value improvements from digital recognition deliver substantial long-term returns.
Institutional Reputation Metrics
External Perception Measures
Track how digital recognition influences external views of your organization:
- Media coverage sentiment analysis
- Third-party ranking improvements
- Awards and recognition received
- Industry peer perception surveys
- Social media brand mention volume and sentiment
Digital Presence Amplification
Digital halls of fame extend reach beyond physical locations:
- Website traffic increases to recognition pages: 30-60% typical growth
- Social media sharing and viral content potential
- Search engine visibility for alumni and achievement keywords
- Mobile access enabling anywhere, anytime engagement
- Interactive displays that generate word-of-mouth buzz
Recruitment and Retention Impact
Student/Member Attraction
Measure how recognition influences recruitment:
Recruitment Impact Indicators:
- Prospective student/member tour feedback
- Application volume changes
- Yield rate improvements (acceptances to enrollments)
- Quality indicators (test scores, achievements)
- Cost per enrollment reduction

Typical Impact: 8-15% improvement in recruitment metrics
Conservative Value Estimate: $50,000-$250,000 annually
Retention Strengthening
Track how recognition culture influences persistence:
- First-year retention rate improvements
- Multi-year commitment increases
- Exit survey sentiment improvements
- Community belonging indicators
- Average retention value: $10,000-$50,000 annually
7. Fundraising and Development Impact
For many institutions, development ROI alone justifies digital hall of fame investment.
Donor Engagement Metrics
Giving Behavior Changes
Track how recognition influences philanthropic behavior:
Participation Metrics:
- Donor participation rate increases
- First-time donor conversion rates
- Lapsed donor reactivation
- Recurring gift establishment
- Planned giving inquiries
Gift Quality Indicators:
- Average gift size increases
- Major gift pipeline development
- Campaign goal attainment
- Upgrade and stretch gift rates
- Multi-year pledge conversion
Development ROI Calculation
Fundraising Lift Attribution
While many factors influence giving, digital donor recognition creates measurable impact:
Baseline Annual Alumni Giving: $500,000
Digital Recognition Implementation Year 1
Post-Implementation Alumni Giving: $575,000 (15% increase)

Attributable Increase: $75,000
Digital Hall of Fame Investment: $35,000
First-Year Development ROI: 114%

Year 2-5 Cumulative Giving Impact: $400,000+
Total 5-Year ROI: 1,043%
Prospect Cultivation Enhancement
Digital recognition strengthens development relationships:
- Donor recognition response rates and satisfaction
- Stewardship efficiency improvements
- Prospect research time reduction through better data
- Naming opportunity visualization and promotion
- Legacy society growth and participation
8. Setting Up Your Analytics Framework
Effective ROI measurement requires proper analytics infrastructure and data collection processes.
Technology Setup Requirements
Analytics Platform Selection
Choose measurement tools aligned with your needs:
Built-in Platform Analytics: Most comprehensive digital hall of fame solutions include native analytics dashboards tracking user behavior, content performance, and engagement patterns without additional tools.
Supplementary Analytics Tools:
- Google Analytics for web-based companion sites
- Social media monitoring platforms
- Survey tools for qualitative feedback
- CRM integration for development metrics
Data Collection Best Practices
Ensure measurement accuracy and consistency:
- Establish baseline metrics before launch
- Implement consistent tracking across all touchpoints
- Define clear metric definitions and calculation methods
- Set up automated reporting schedules
- Create data governance and privacy protocols
Measurement Cadence
Regular Reporting Schedule
Short-Term Tracking (Weekly/Monthly):
- User engagement and interaction rates
- Content performance and popular features
- Technical performance and uptime
- User feedback and satisfaction scores
Long-Term Assessment (Quarterly/Annually):
- ROI calculations and trend analysis
- Strategic goal achievement evaluation
- Comparative benchmarking
- Comprehensive stakeholder reports
9. Benchmark Standards and Industry Comparisons
Understanding how your performance compares to similar organizations helps contextualize results and identify improvement opportunities.
Engagement Benchmarks by Organization Type
Educational Institutions:
- Average session duration: 3.5-5 minutes
- Return visitor rate: 18-25%
- Mobile access percentage: 35-50%
- Content update frequency: 2-4 times per month
- User satisfaction score: 4.2-4.7 out of 5
Corporate Recognition Programs:
- Average session duration: 2.5-4 minutes
- Employee interaction rate: 40-65% monthly
- Content update frequency: Weekly
- Program awareness: 75-90% of employees
- Perceived value score: 4.0-4.5 out of 5
Sports Organizations:
- Average session duration: 4-7 minutes
- Fan engagement rate: 25-40% of facility visitors
- Social sharing frequency: 15-30% of sessions
- Record board interaction: 50-75% of athlete family members
- Historical content interest: 60-80% view rate
Financial ROI Benchmarks
Typical ROI Timelines:
Year 1: Break-even or modest positive return (0-25% ROI)
Year 2: Positive returns accelerate (40-80% ROI)
Year 3+: Substantial returns as content grows (100%+ cumulative ROI)

5-Year Average ROI: 300-600% for well-implemented programs
Success Factors Influencing ROI:
- Content quality and depth: +30-50% engagement impact
- Strategic placement: +20-35% visibility benefit
- Regular updates and freshness: +25-40% return visitor boost
- Integration with other programs: +15-30% multiplier effect
- Staff training and adoption: +20-30% utilization improvement
10. Reporting ROI to Stakeholders
Translating measurement data into compelling stakeholder communications ensures continued support and investment.
Creating Effective ROI Reports
Audience-Specific Messaging
Tailor ROI presentations to different stakeholder groups:
Executive Leadership and Board Members:
- Focus on strategic value and competitive positioning
- Highlight financial returns and resource optimization
- Connect to institutional goals and priorities
- Use high-level summaries with supporting details available
Development and Alumni Relations:
- Emphasize engagement metrics and relationship strengthening
- Showcase fundraising correlations and donor feedback
- Highlight success stories and individual impact
- Demonstrate pipeline growth and cultivation effectiveness
Operations and Facilities:
- Focus on maintenance savings and efficiency gains
- Highlight space optimization and resource management
- Show reduced vendor management needs
- Demonstrate technical reliability and uptime
Compelling Visualization Techniques
Dashboard Design Best Practices
Create clear, impactful ROI visualizations:
- Use trend lines showing improvement over time
- Highlight year-over-year growth percentages
- Include comparison bars for before/after metrics
- Feature key statistics in large, readable formats
- Incorporate testimonials and qualitative feedback
Storytelling with Data
Numbers alone rarely persuade—combine metrics with narrative:
“Since implementing our digital hall of fame 18 months ago, we’ve seen a 32% increase in alumni event attendance, a 24% improvement in giving participation, and countless stories of alumni reconnecting with their history and each other. The $45,000 investment has already saved $18,000 in traditional display costs while generating an estimated $125,000 in additional fundraising success.”
Frequently Asked Questions
How long does it take to see positive ROI from a digital hall of fame?
What's the single most important metric to track?
How do we measure intangible benefits like 'institutional pride' and 'inspiration'?
Should we track metrics for the physical display, web version, or both?
What if our metrics don't meet benchmark standards?
Conclusion: From Investment to Impact
Measuring ROI for your digital hall of fame transforms recognition from a “nice to have” expense into a strategic investment with quantifiable returns. By implementing the frameworks, metrics, and methodologies outlined in this guide, you’ll build compelling evidence of value that secures stakeholder support and optimizes performance.
The most successful digital recognition programs balance quantitative financial metrics with qualitative impact measures, creating a comprehensive value story that resonates across your organization. Regular measurement, transparent reporting, and continuous optimization ensure your digital hall of fame delivers increasing returns year after year.
Remember that ROI measurement isn’t just about justifying past investment—it’s about identifying opportunities for improvement, demonstrating value to stakeholders, and building the case for program expansion. Organizations that systematically measure and communicate ROI are significantly more likely to secure ongoing support and funding for recognition initiatives.
Ready to implement a digital hall of fame with built-in analytics and proven ROI? Rocket Alumni Solutions provides comprehensive platforms designed specifically for measurable recognition excellence. Our systems include powerful analytics dashboards, benchmark comparisons, and reporting tools that make ROI tracking simple and compelling.
Schedule a consultation to learn how Rocket Alumni Solutions can help you measure and maximize the ROI of digital recognition for your organization.