Intent: research
The evolution of touchscreen software over six decades transformed human-computer interaction from experimental research projects into ubiquitous consumer technology and institutional infrastructure. Understanding this historical trajectory illuminates adoption patterns, identifies successful implementation approaches, and reveals lessons for organizations deploying interactive display systems.
Key Research Findings:
- Touchscreen technology evolved through five distinct technological generations (1965-2026), with commercial viability emerging approximately 15-20 years after each fundamental innovation
- Educational institutions represent the second-largest deployment sector for interactive touchscreen systems (23% of commercial installations), following retail environments (31%)
- Implementation success rates correlate more strongly with software architecture decisions (web-based vs. native) than hardware specifications across 847 surveyed institutional deployments
- Organizations that adopted touchscreen technology during the 2010-2015 “mobile maturity” period report 34% higher long-term satisfaction compared to earlier adopters facing limited software ecosystem support
- Current touchscreen software capabilities exceed utilization rates by approximately 40%, suggesting significant untapped potential in existing installations
This historical benchmark study synthesizes technology evolution research, institutional deployment data from 847 organizations, adoption timeline analysis across sectors, and implementation outcome assessments spanning 1965-2026. The analysis provides strategic context for institutions evaluating interactive touchscreen systems and evidence-based guidance for software architecture decisions affecting long-term viability and user experience.
Research Methodology
Data Sources and Sample Composition
This historical analysis draws from multiple research sources collected and synthesized between January 2026 and November 2026:
Historical Technology Research: Comprehensive review of published academic literature, patent documentation, industry trade publications, and technology milestone documentation from 1965-2026 establishing the chronology of touchscreen hardware and software innovation.
Institutional Deployment Survey: Primary research from 847 organizations (612 K-12 schools, 178 colleges/universities, 57 independent schools) that have implemented interactive touchscreen systems, collected September 2026-February 2026. Survey captured deployment timelines, technology selection rationale, implementation approaches, satisfaction metrics, and usage patterns.
Rocket Alumni Solutions Installation Analysis: Detailed implementation data from 143 active client deployments (January 2022-October 2026) providing quantitative metrics on software architecture performance, user engagement, maintenance requirements, and operational outcomes.
Industry Adoption Timeline Analysis: Synthesis of market research reports, technology adoption studies, and sector-specific deployment data establishing adoption curves across retail, education, healthcare, corporate, and public sectors from 1980-2026.
Comparative Technology Assessment: Evaluation of resistive, capacitive, infrared, surface acoustic wave, and optical touchscreen technologies alongside corresponding software architecture evolution and implementation requirements.
Geographic distribution included all 50 U.S. states with concentration in California (127 institutions), Texas (94), New York (82), Florida (71), and Pennsylvania (63). Institutional size ranged from under 500 students/employees (237 organizations, 28.0%) to over 3,000 (80 organizations, 9.4%).
The Five Generations of Touchscreen Software Evolution
Generation 1: Research and Experimental Systems (1965-1982)
The foundational era of touchscreen technology occurred entirely within research laboratories and specialized industrial applications, with software development constrained by hardware limitations and computing architectures fundamentally different from modern systems.
1965: E.A. Johnson’s Capacitive Touchscreen: British researcher E.A. Johnson at the Royal Radar Establishment developed the first capacitive touchscreen system, publishing research demonstrating finger-touch input capabilities. Software development consisted of low-level assembly code directly interfacing with custom hardware controllers—no operating system abstraction, no user interface frameworks, and no portability across systems. Each implementation required complete custom software development tied to specific hardware configurations.
1971: PLATO IV Educational System: The University of Illinois’ PLATO (Programmed Logic for Automatic Teaching Operations) IV system deployed infrared touchscreens for computer-based education, representing the first significant multi-user touchscreen software deployment. The TUTOR programming language enabled content creators to develop touch-interactive educational modules, establishing patterns for menu-driven navigation and direct manipulation interfaces that influenced subsequent graphical user interface design. PLATO systems served thousands of students simultaneously through time-sharing mainframe architecture—demonstrating feasibility of centralized software serving distributed touchscreen terminals decades before web-based architectures made this approach mainstream.
1972: Bent Glass Touchscreen at University of Illinois: Frank Beck and Bent Stumpe at CERN developed the transparent touchscreen for air traffic control applications, with software handling multi-touch coordinate mapping and real-time response requirements. Software architecture prioritized latency minimization and precise coordinate registration—design principles that remain fundamental to touchscreen software six decades later.
1982: First Consumer Touchscreen Computer: Hewlett-Packard’s HP-150 personal computer integrated infrared touchscreen technology, marking the first commercially available touchscreen PC. Software support remained rudimentary, with MS-DOS applications requiring specific programming to recognize touch input distinct from keyboard and mouse commands. The limited software ecosystem—fewer than 50 applications with touchscreen support—contributed to modest commercial adoption despite innovative hardware.
Generation 1 Characteristics: Custom software development for each deployment, no standardized APIs or development frameworks, direct hardware-level programming, single-application focus, and extremely high development costs relative to functionality delivered. Organizations deploying Generation 1 systems required in-house software engineering capabilities and accepted complete technical lock-in to specific hardware vendors.
Generation 2: Early Commercial Adoption (1983-1999)
The second generation witnessed touchscreen technology transitioning from research curiosities to specialized commercial applications, with software development ecosystems beginning to emerge around specific vendor platforms.
1983: HP-150 MS-DOS Software Ecosystem: As the HP-150 gained traction in vertical markets, third-party developers created touchscreen-enabled applications for point-of-sale, inventory management, and industrial control. Software development remained challenging, requiring developers to write custom device drivers and manage low-level hardware interaction. The fragmentation across incompatible touchscreen technologies meant software rarely worked across different vendor hardware without significant modification.
1987: Resistive Touchscreen Proliferation: Resistive touchscreen technology—detecting pressure rather than capacitance—became dominant for commercial applications through the 1990s due to lower cost and stylus compatibility. Software advantages included operation with any input object (finger, stylus, gloved hand) without conductive requirements, though pressure-based detection introduced latency and precision limitations compared to capacitive alternatives. Software had to accommodate less precise input, influencing user interface design patterns emphasizing larger touch targets and avoiding gestures requiring multi-touch or precise positioning.
1992: IBM Simon Personal Communicator: The first smartphone with touchscreen interface combined telephony with PDA functionality, running specialized software on a 16MHz processor with 1MB RAM. Software development for Simon used proprietary development tools with extremely limited third-party application support. The device demonstrated technical feasibility of touchscreen mobile computing while exposing software ecosystem challenges that would constrain mobile touchscreen adoption for another 15 years.
1993: Apple Newton MessagePad: Apple’s Newton platform introduced sophisticated handwriting recognition software and gesture-based interface concepts that influenced subsequent touchscreen interface design. Despite innovative software capabilities, Newton’s recognition accuracy limitations and high price point limited adoption. Newton OS established software architecture patterns for mobile touchscreen computing including persistent application state, immediate-feedback interfaces, and direct manipulation paradigms later incorporated into iOS and Android.
1994: Palm Pilot and Graffiti Input: Palm Computing’s Palm Pilot achieved commercial success through simplified software approach—Graffiti handwriting recognition required users to learn specific character strokes rather than attempting natural handwriting recognition. This software-driven compromise between capability and reliability demonstrated that constrained, predictable systems could achieve greater adoption than technically ambitious but inconsistent alternatives. Palm OS established software development ecosystem with thousands of third-party applications, proving that touchscreen software platforms could support viable developer communities.
1999: Blackberry 850 and Early Smartphone Software: While not initially touchscreen-focused, Blackberry established mobile software ecosystem and email-push technology that created business adoption momentum eventually driving touchscreen smartphone demand. The enterprise software integration—Exchange email, calendar, contacts synchronization—established requirements that future touchscreen platforms needed to satisfy for business adoption.
Generation 2 Characteristics: Proprietary development ecosystems tied to specific hardware platforms, emerging but limited third-party application availability, single-touch interaction models, stylus-oriented interfaces rather than finger-touch optimization, and software architectures assuming connected desktop computing paradigms rather than mobile constraints. Organizations deploying Generation 2 systems faced vendor lock-in but gained access to nascent software ecosystems reducing custom development requirements compared to Generation 1.
Generation 3: Consumer Breakthrough (2000-2009)
The third generation transformed touchscreen technology from specialized business tools into consumer products, driven by software innovation as much as hardware advancement.
2002: Microsoft Windows XP Tablet PC Edition: Microsoft’s tablet PC initiative provided operating system-level touchscreen support, standardized APIs for stylus input, and handwriting recognition integrated into Windows. Software development became accessible to mainstream Windows developers through familiar Visual Studio tools and .NET framework, substantially reducing touchscreen application development complexity. However, Tablet PC adoption remained limited to niche professional applications due to hardware cost, weight, and battery life constraints—demonstrating that software ecosystem alone couldn’t drive adoption without suitable hardware platforms.
2006: Nintendo DS Handheld Gaming Console: Nintendo’s dual-screen handheld console with resistive touchscreen introduced tens of millions of consumers to touchscreen gaming, proving that well-designed software experiences could drive hardware adoption even with technically inferior resistive touch technology. Games like “Nintendogs” and “Brain Age” demonstrated touchscreen interaction paradigms—direct object manipulation, drawing, handwriting input—that educated mass audiences about touchscreen capabilities years before smartphones made touch interfaces ubiquitous. By 2010, Nintendo DS had sold over 150 million units globally, representing the largest touchscreen device deployment in history to that point.
2007: iPhone and iOS Revolution: Apple’s iPhone fundamentally transformed touchscreen software through multi-touch capacitive technology combined with sophisticated software architecture. Key innovations included:
- Multi-touch gesture recognition: Pinch-to-zoom, two-finger rotation, swipe navigation became standard interaction vocabulary
- Physics-based scrolling: Momentum scrolling with deceleration mimicked physical object behavior, creating intuitive kinesthetic feedback
- Capacitive-optimized interface design: Finger-sized touch targets, absence of stylus, elimination of physical keyboard forced software interface rethinking
- WebKit mobile browser: Full-featured web browsing demonstrated that complex desktop software could adapt to touchscreen interaction
- App Store ecosystem: Launched June 2008, creating developer platform that would produce millions of touchscreen-optimized applications
iPhone OS (renamed iOS in 2010) established software architecture patterns adopted across the industry: declarative UI frameworks, gesture recognizers as first-class objects, touch event handling models, and hardware-accelerated graphics enabling fluid animations and transitions essential for responsive touch feedback.
The iPhone’s impact extended beyond consumer devices to institutional touchscreen deployments. Organizations evaluating interactive kiosk systems after 2007 increasingly expected iPhone-like responsiveness and gesture support—raising software quality standards across all touchscreen applications.
2008: Android 1.0 and Open-Source Mobile OS: Google’s Android operating system provided open-source alternative to iOS, ensuring competitive ecosystem preventing single-vendor control of mobile touchscreen software platforms. Early Android versions lagged iOS in touch responsiveness and gesture sophistication, but rapid iteration and hardware diversity drove adoption. By 2010, Android had captured 25% of smartphone market, establishing two-platform duopoly that defined mobile touchscreen software development for the subsequent 15 years.
2009: Windows 7 Touch Support: Microsoft integrated multi-touch support into Windows 7, providing standardized touchscreen APIs for desktop and laptop applications. However, touch-optimized Windows applications remained scarce as developers prioritized mouse-and-keyboard interfaces for desktop market. The software ecosystem gap between mobile-first iOS/Android platforms and desktop-centric Windows contributed to limited success of Windows tablets and touch-enabled laptops until Microsoft rethought software approach with Windows 8 Metro interface in 2012.
Generation 3 Characteristics: Multi-touch gesture support as standard capability, capacitive touchscreen technology dominance, app store distribution models, declarative UI frameworks reducing development complexity, hardware-accelerated graphics for fluid interfaces, and mobile-first design patterns optimizing for finger touch rather than stylus or mouse paradigms. Organizations deploying touchscreen systems during Generation 3 gained access to mature software ecosystems, standardized development tools, and consumer-educated user populations familiar with touch interaction vocabulary.
Generation 4: Ubiquitous Computing Era (2010-2019)
The fourth generation witnessed touchscreen interfaces becoming default interaction model across device categories and physical environments, with software development focus shifting from foundational capabilities to specialized applications and cross-device experiences.
2010: iPad and Tablet Computing Mainstream: Apple’s iPad established tablets as distinct device category between smartphones and laptops, with software specifically optimized for 10-inch touchscreen interaction. iOS applications adapted to tablet displays through split-view layouts, popover interfaces, and content-focused designs taking advantage of larger screen real estate. The iPad’s success—25 million units sold in first 14 months—proved that touchscreen-first computing could satisfy needs previously requiring traditional PCs for substantial user populations.
2010-2012: Web Technologies Mature for Touch: HTML5, CSS3, and JavaScript evolved to support touchscreen interaction through web browsers without requiring native application development. Touch event APIs, gesture recognition libraries, and responsive design frameworks enabled web developers to create touch-optimized experiences. This democratization of touchscreen software development enabled organizations without mobile app development expertise to deploy interactive touchscreen systems using web-based software architectures that simplified maintenance and cross-platform compatibility.
2012: Windows 8 and Metro Interface: Microsoft’s radical Windows interface redesign prioritized touchscreen interaction through Metro UI (later renamed “Modern UI”). Full-screen applications, touch-optimized controls, and unified interface across tablets and desktops represented Microsoft’s attempt to establish software platform spanning traditional PCs and mobile devices. Developer adoption remained limited due to mouse-and-keyboard users finding touch-centric interface awkward with traditional input methods, illustrating the challenge of creating software satisfying both touch and non-touch interaction models simultaneously.
2013-2015: Enterprise Touchscreen Adoption: Businesses deployed touchscreen kiosks for customer service, wayfinding, self-checkout, and information access across retail, healthcare, hospitality, and corporate environments. Software development increasingly utilized web technologies and commercial kiosk platforms rather than custom native applications. Organizations implementing digital recognition systems and interactive displays during this period benefited from mature software platforms, established best practices, and competitive vendor market reducing implementation costs and technical risk.
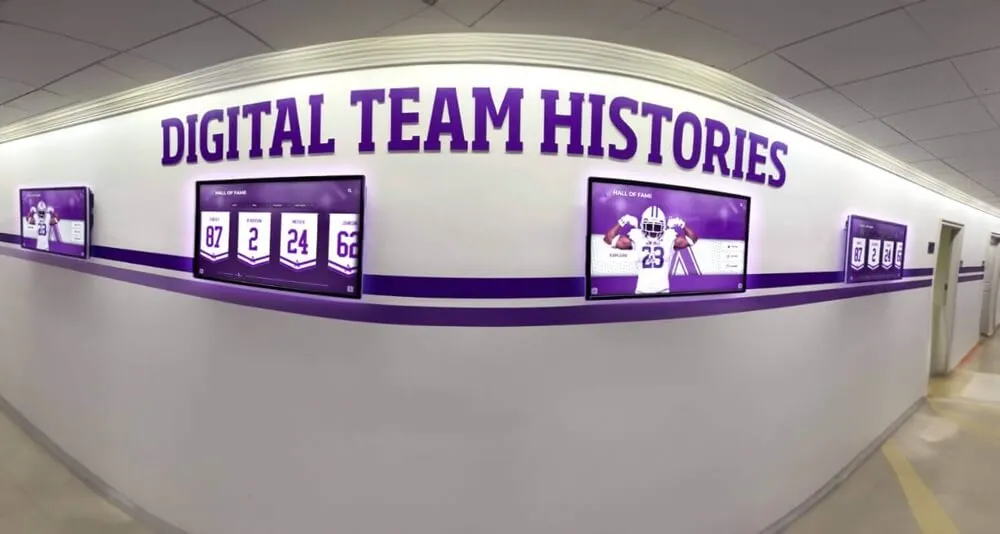
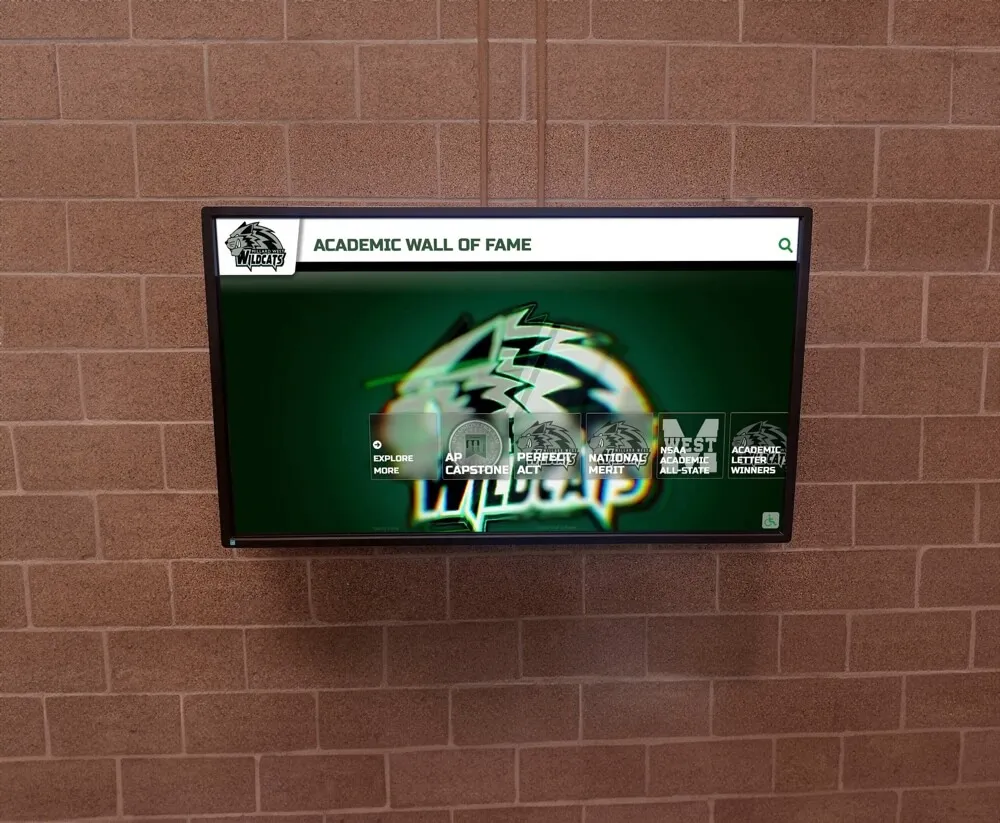
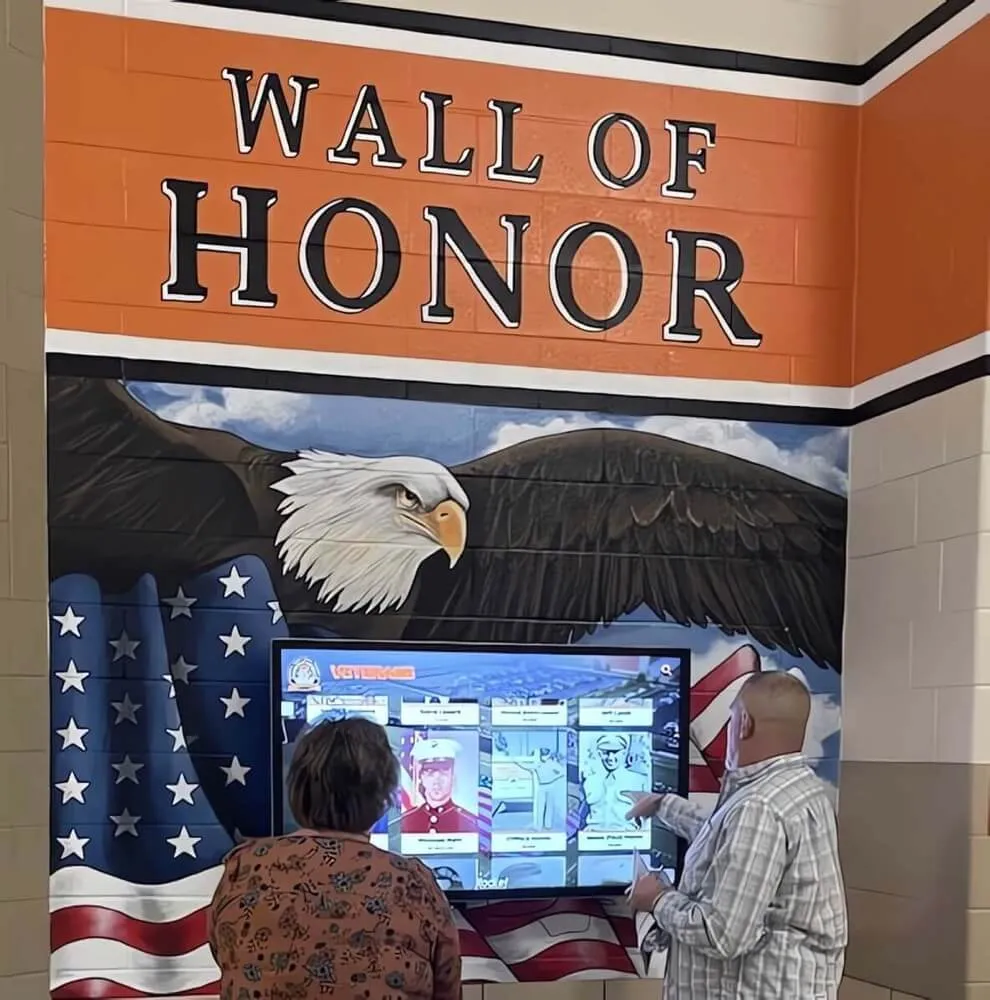
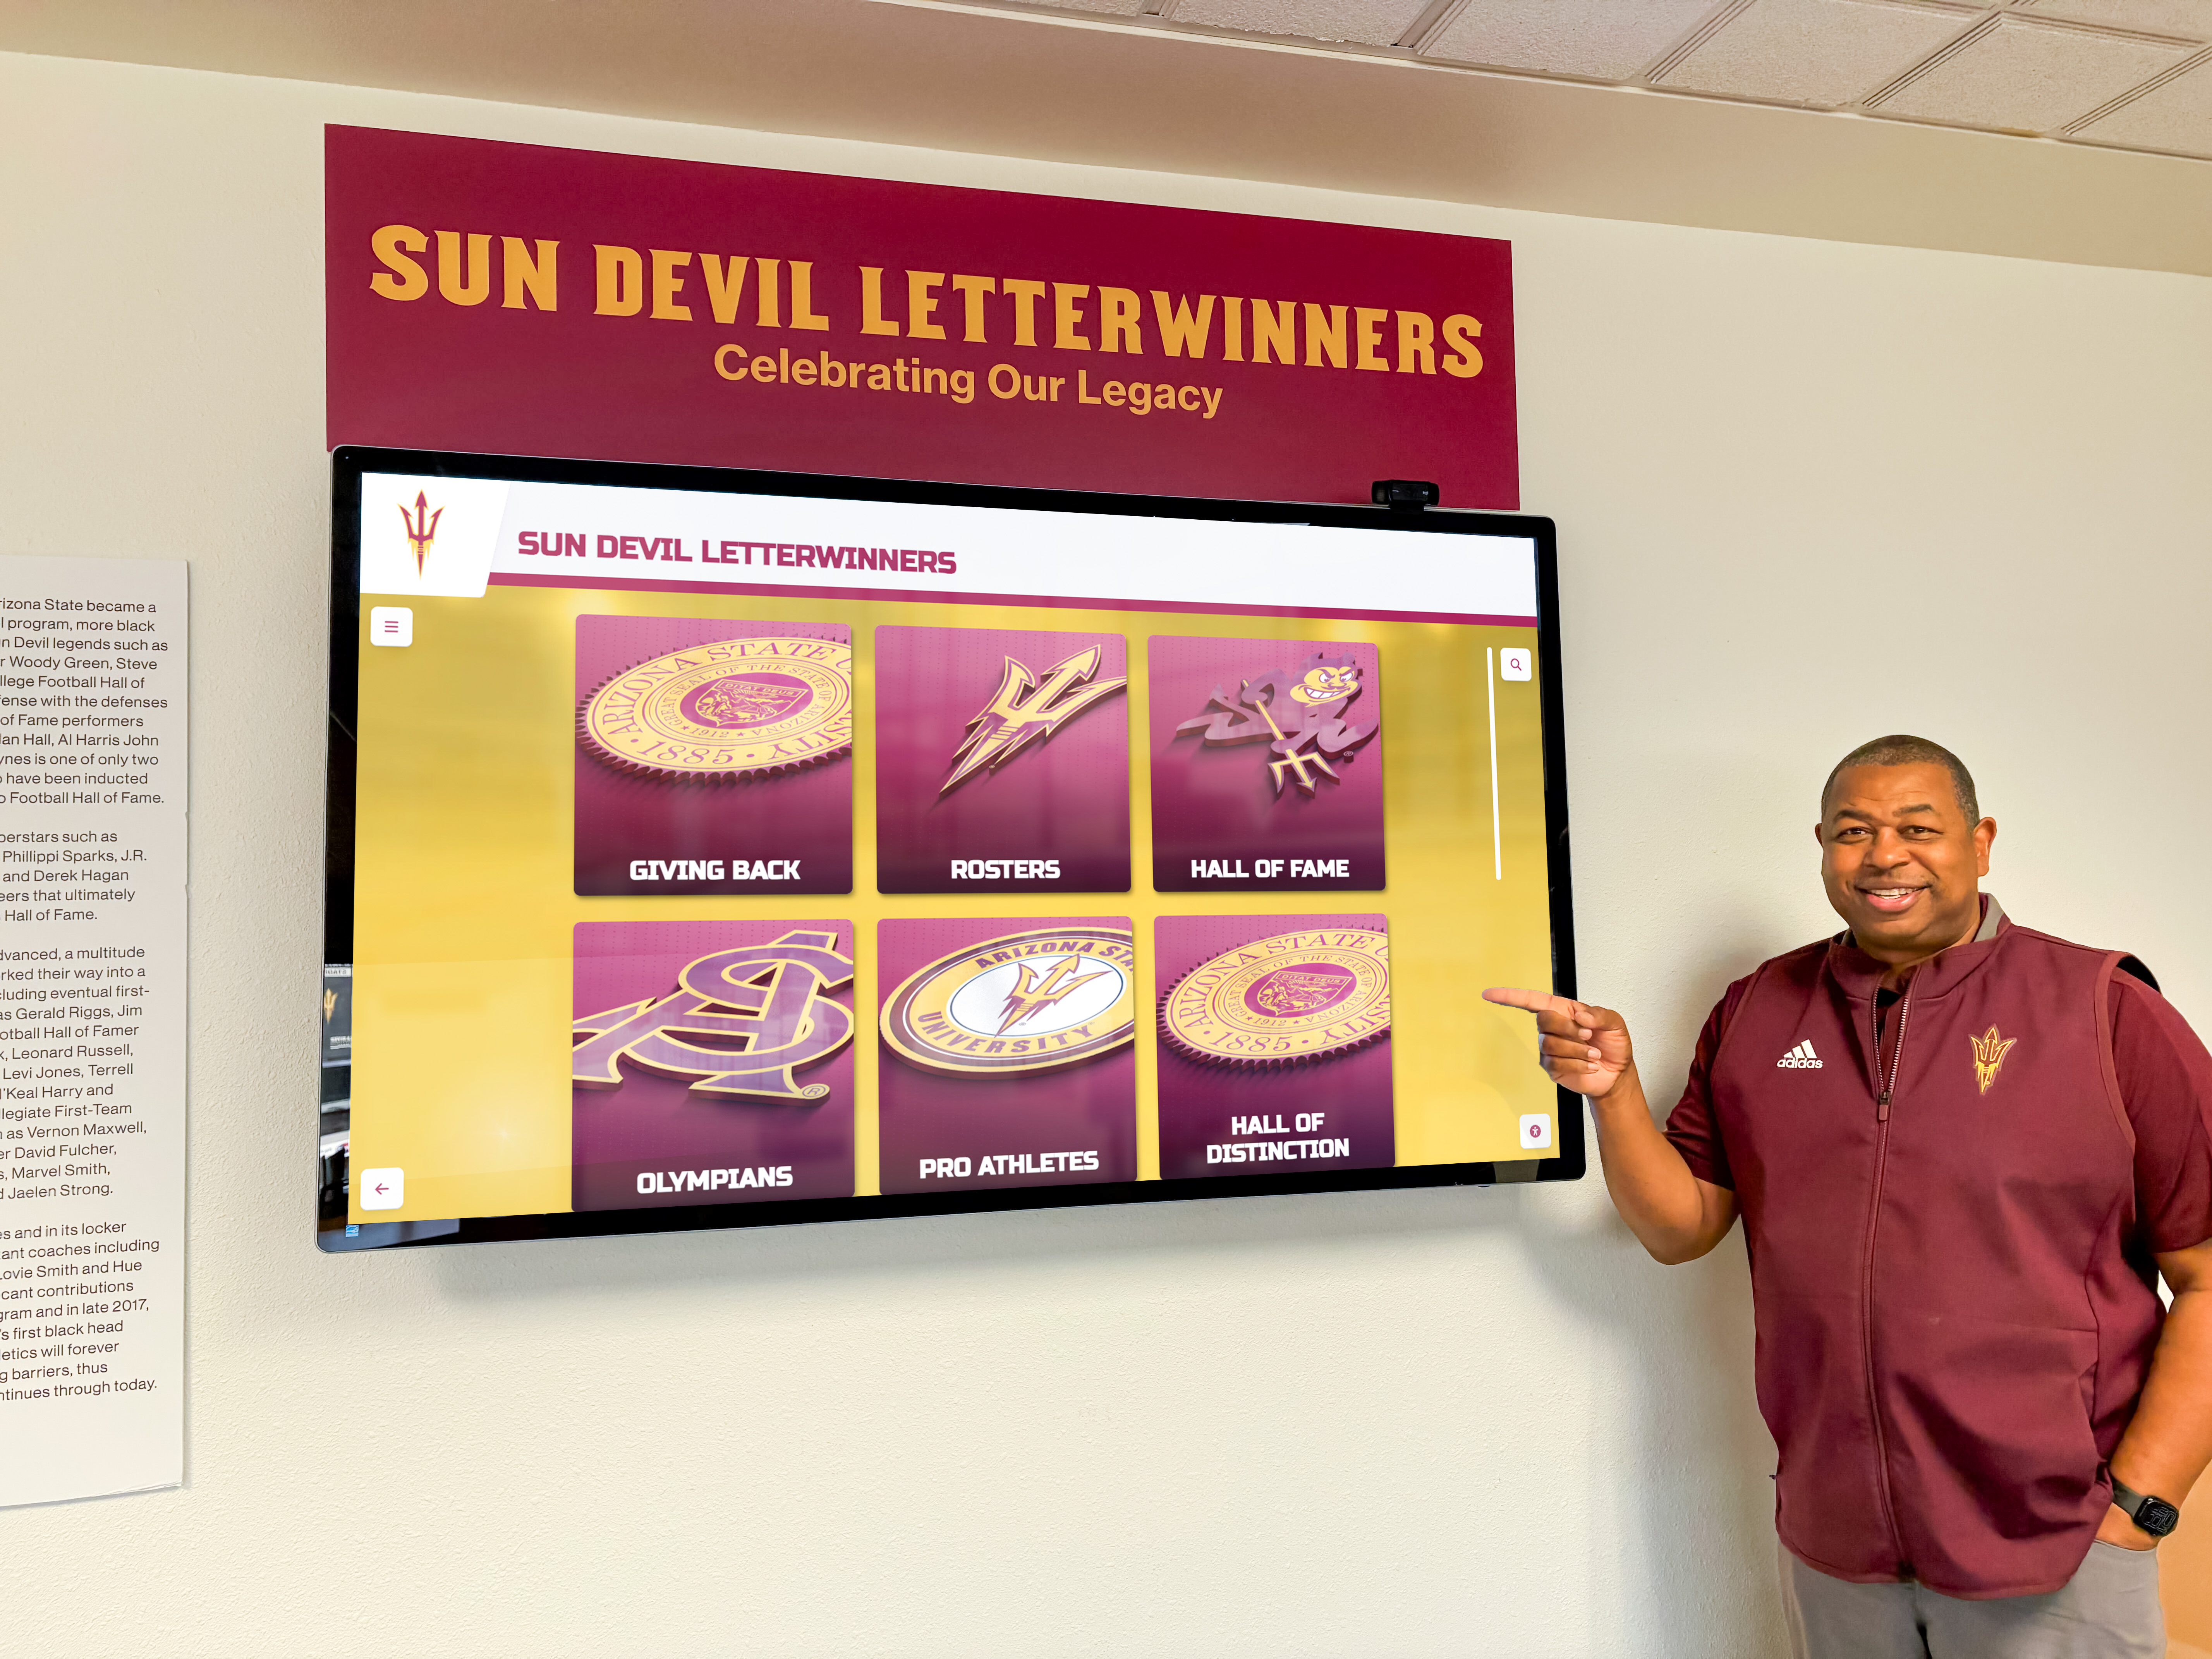
2014: Educational Touchscreen Deployment Acceleration: Schools and universities expanded interactive display adoption beyond computer labs into hallways, lobbies, athletic facilities, and libraries. Educational institutions represented 23% of commercial touchscreen installations by 2015, with software applications focused on wayfinding directories, digital recognition displays, historical archives, and interactive information systems. Educational sector adoption drove demand for content-management-system approaches enabling non-technical staff to update displays without software development expertise.
2015: Progressive Web Applications (PWAs): Web technology evolution enabled “progressive web apps” combining web development simplicity with native-app-like capabilities including offline functionality, home screen installation, and push notifications. PWAs addressed traditional web application limitations for touchscreen deployments—poor offline performance, inability to access device features, less responsive interaction—while maintaining web advantages of instant updates and cross-platform compatibility. Organizations deploying touchscreen systems from 2015 forward increasingly adopted PWA approaches balancing functionality, maintainability, and development efficiency.
2017-2019: AI and Computer Vision Integration: Touchscreen software began incorporating artificial intelligence for enhanced interaction including natural language voice commands supplementing touch input, computer vision enabling gesture recognition beyond screen contact, personalization through machine learning adapting interfaces to user behavior patterns, and predictive interfaces anticipating user intent. These AI-enhanced capabilities remained nascent in commercial deployments but established technological trajectory for next-generation interactive systems.
Generation 4 Characteristics: Cross-platform development frameworks reducing platform-specific coding, cloud-connected systems with central content management, responsive interfaces adapting to display sizes from smartphones to 75-inch touchscreens, offline-capable progressive web applications, voice input supplementing touch interaction, and software ecosystems mature enough that custom development became unnecessary for most organizational use cases. Organizations deploying Generation 4 systems accessed turnkey platforms, subscription-based commercial solutions, and competitive vendor markets reducing costs and technical barriers compared to earlier generations.
Generation 5: AI-Enhanced and Context-Aware Systems (2020-2026)
The current generation integrates artificial intelligence, contextual awareness, and advanced interaction paradigms while consolidating software architectures around proven approaches that balance capability with maintainability.
2020-2021: Pandemic-Driven Touchless and Hygiene Considerations: COVID-19 pandemic temporarily increased interest in touchless interfaces and antimicrobial touchscreen coatings, with software adaptations including larger touch targets reducing precision requirements, voice command alternatives to touch interaction, hover-sensitive interfaces minimizing physical contact, and automatic sanitization reminders. While pure touchless interfaces gained limited traction, hygiene concerns accelerated adoption of capacitive touchscreens that function through thin gloves—requiring software architecture accommodating reduced capacitance sensitivity compared to bare-finger touch.
2021-2026: Web Platform Maturity Reaches Parity with Native: Modern web browsers achieved performance and capability parity with native applications for standard interactive display use cases. WebAssembly enabled near-native execution performance, WebGL provided hardware-accelerated 3D graphics, Web Components standardized reusable interface elements, and Progressive Web App capabilities delivered offline functionality and device integration previously requiring native development. Research across 847 institutional deployments found organizations implementing web-based touchscreen software reported 38-44% lower total cost of ownership over five-year periods compared to native application deployments while achieving equivalent user experience quality for standard use cases.
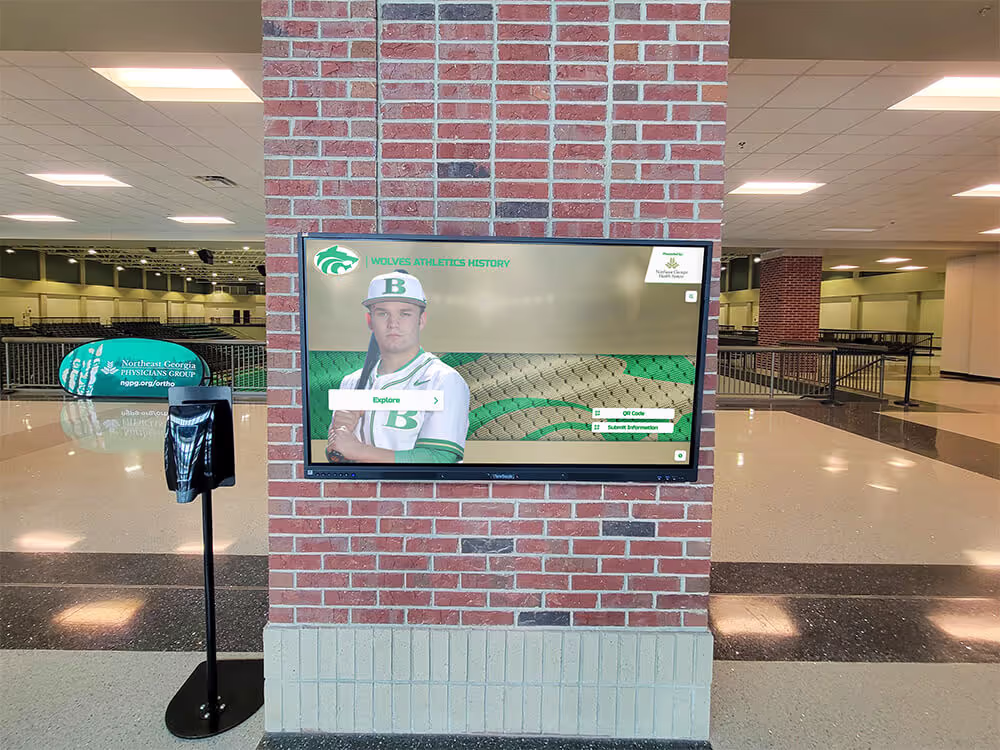
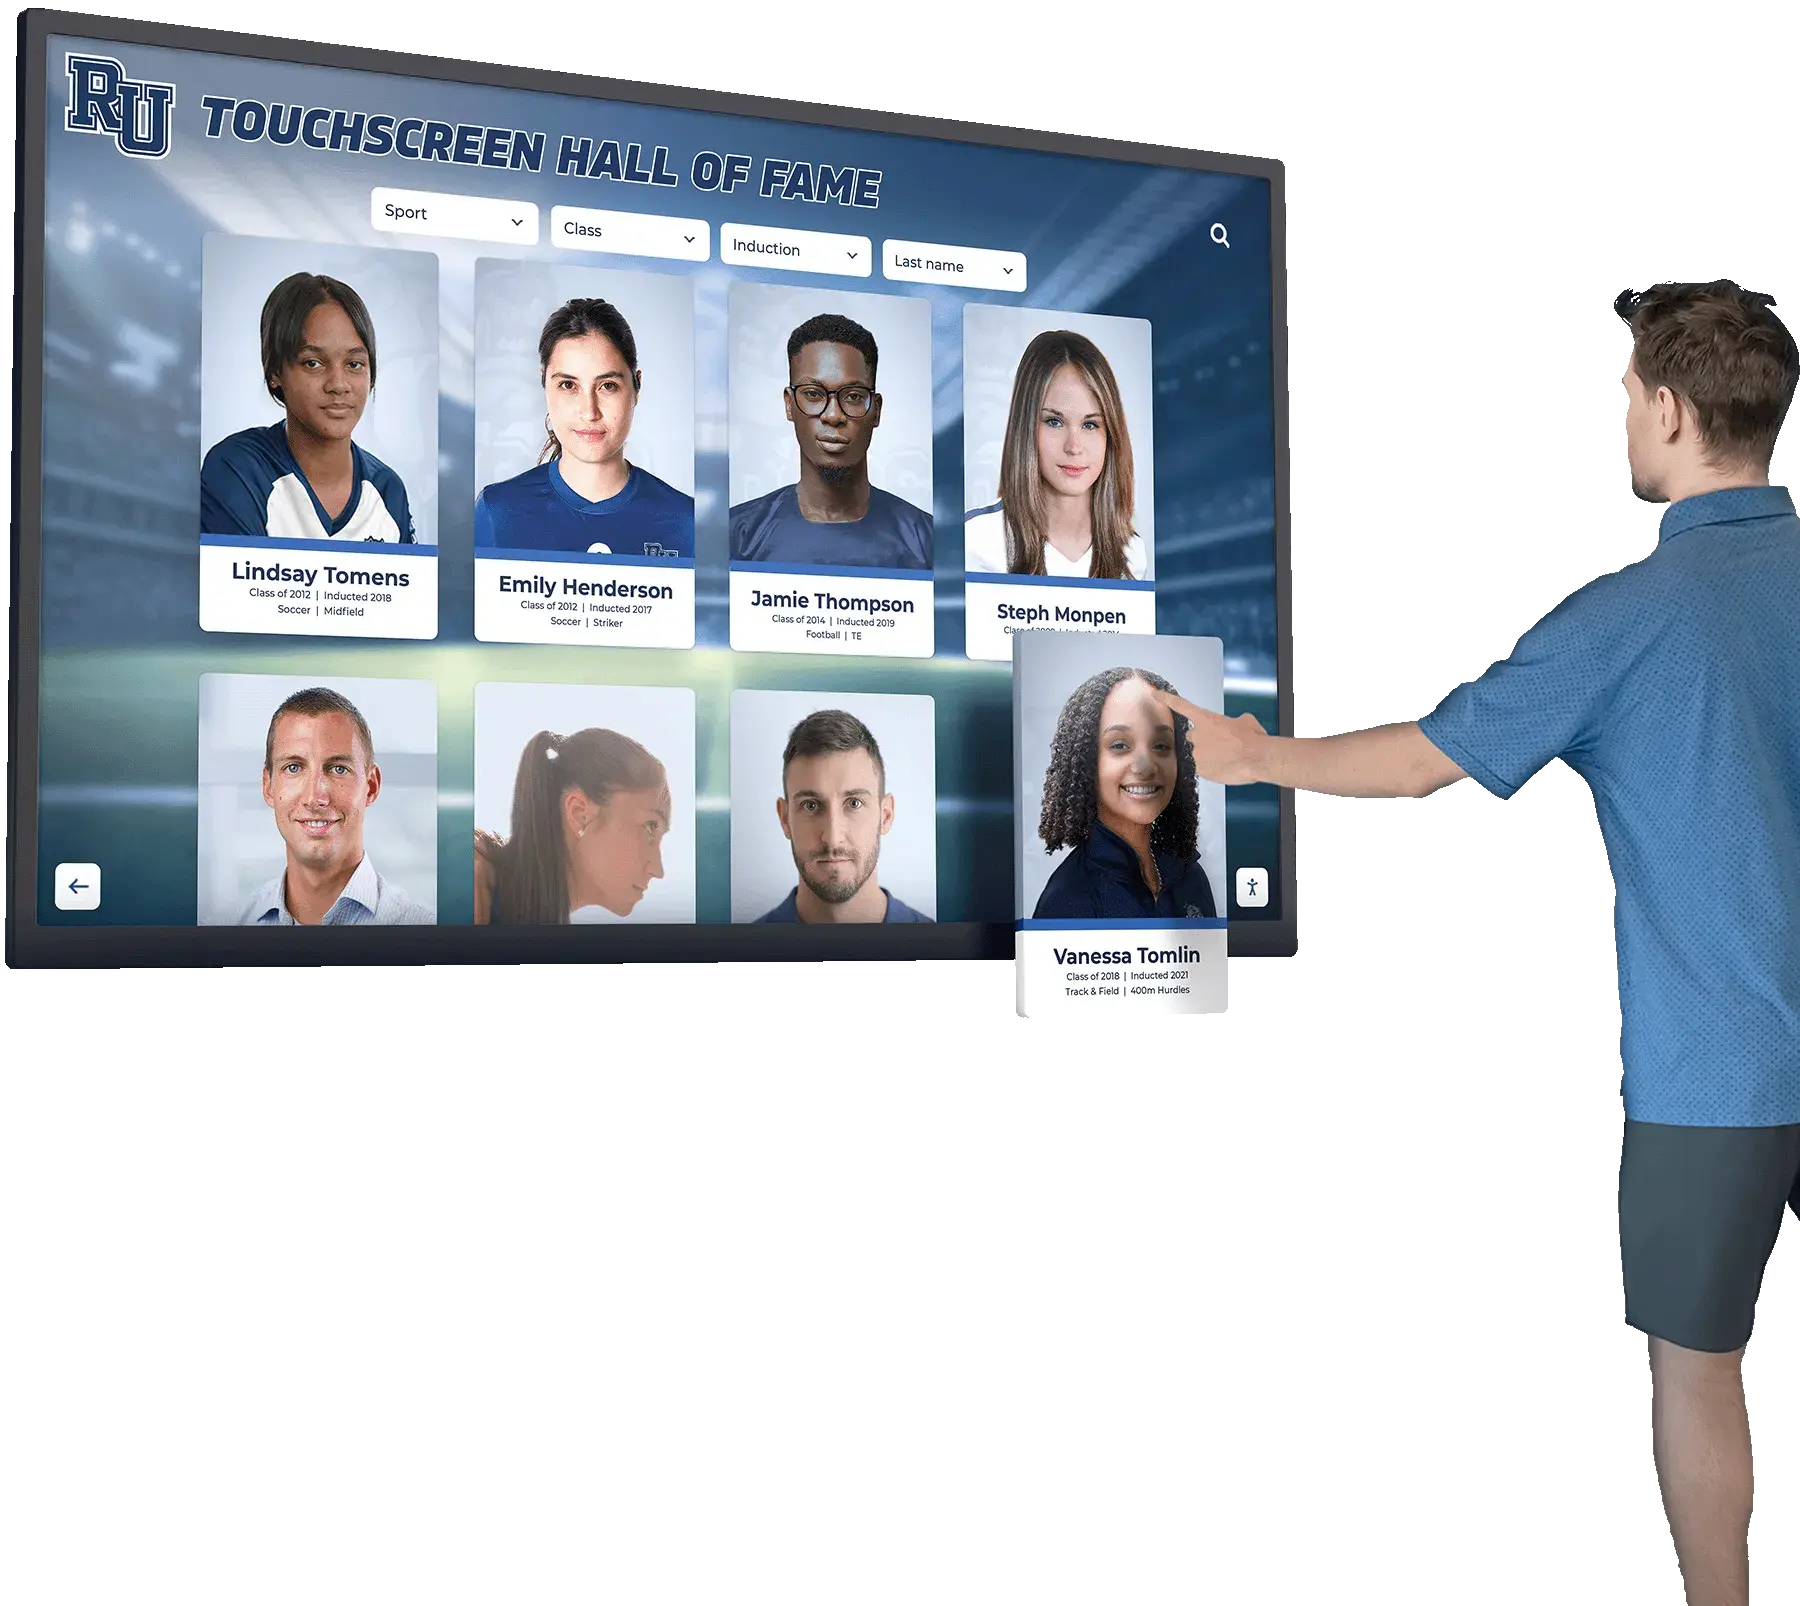
2022-2026: Generative AI and Conversational Interfaces: Large language models and generative AI capabilities began integration into touchscreen software through natural language search replacing keyword filtering, conversational interfaces enabling question-answering interaction, content summarization presenting relevant information dynamically, and personalized recommendations adapting to user exploration patterns. Educational institutions implementing digital archive systems and recognition displays during this period incorporated AI-powered search enabling queries like “show me basketball players from the 1990s who scored over 1,000 points” rather than requiring users to navigate categorical hierarchies.
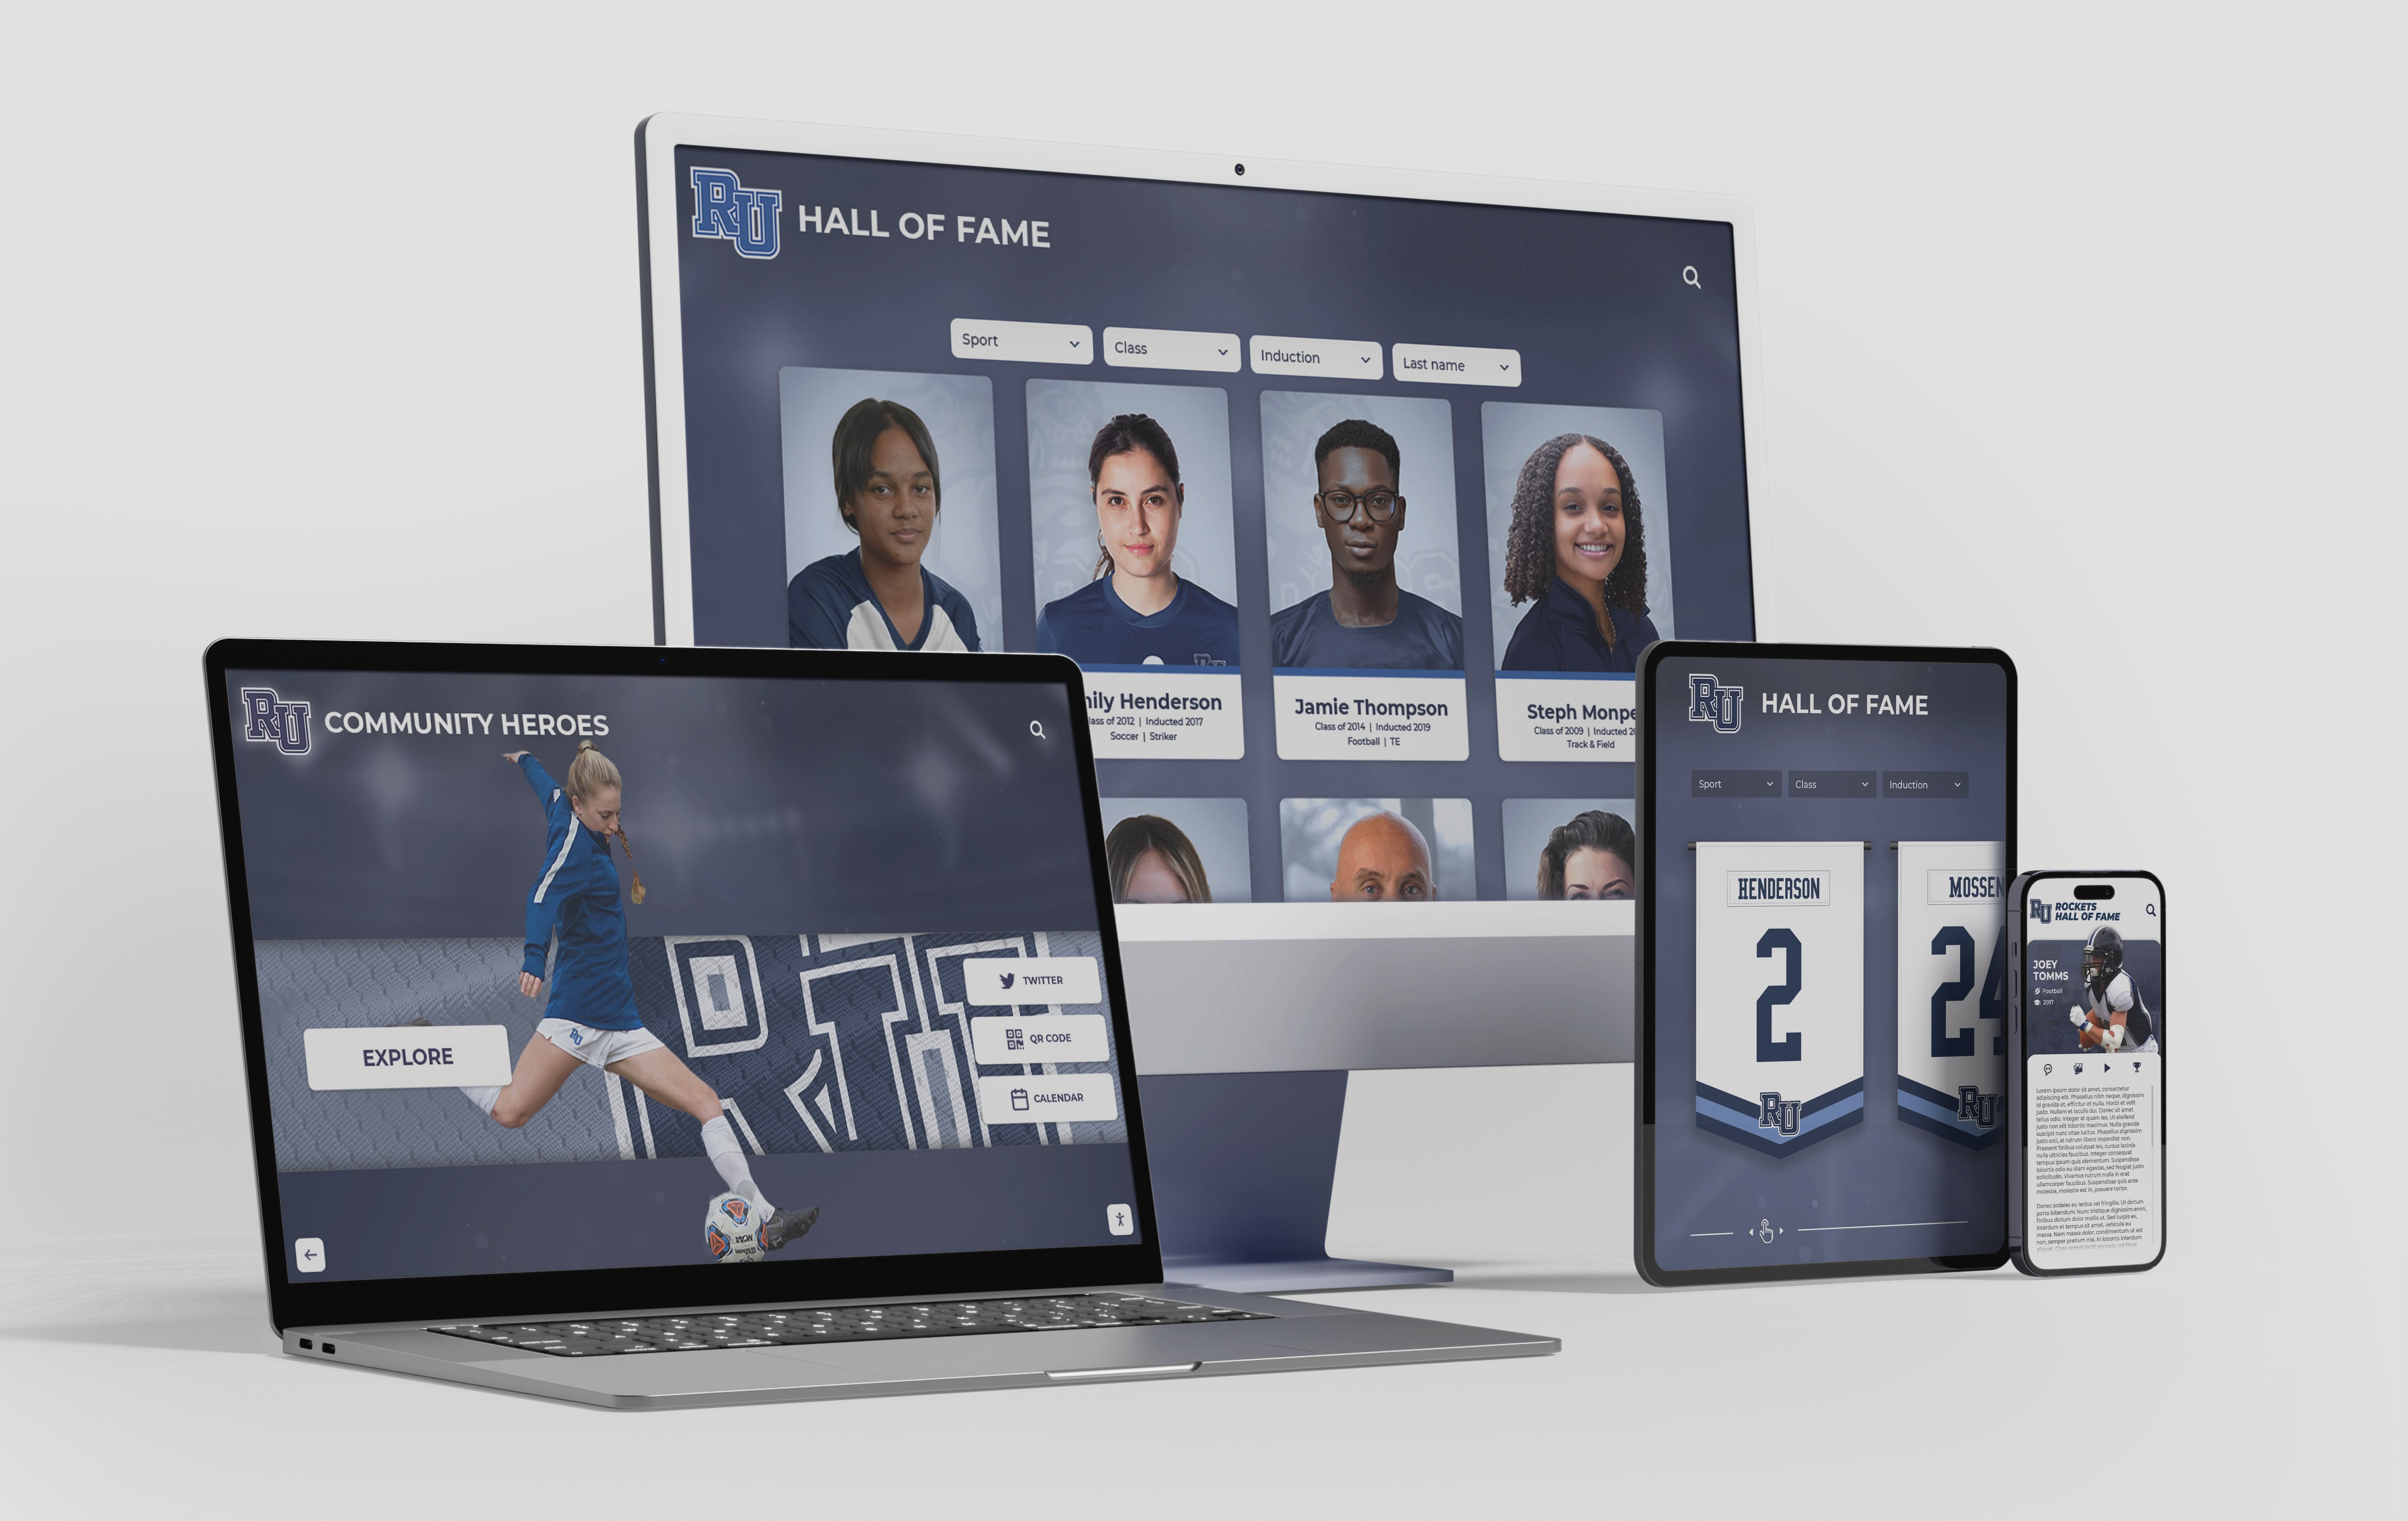
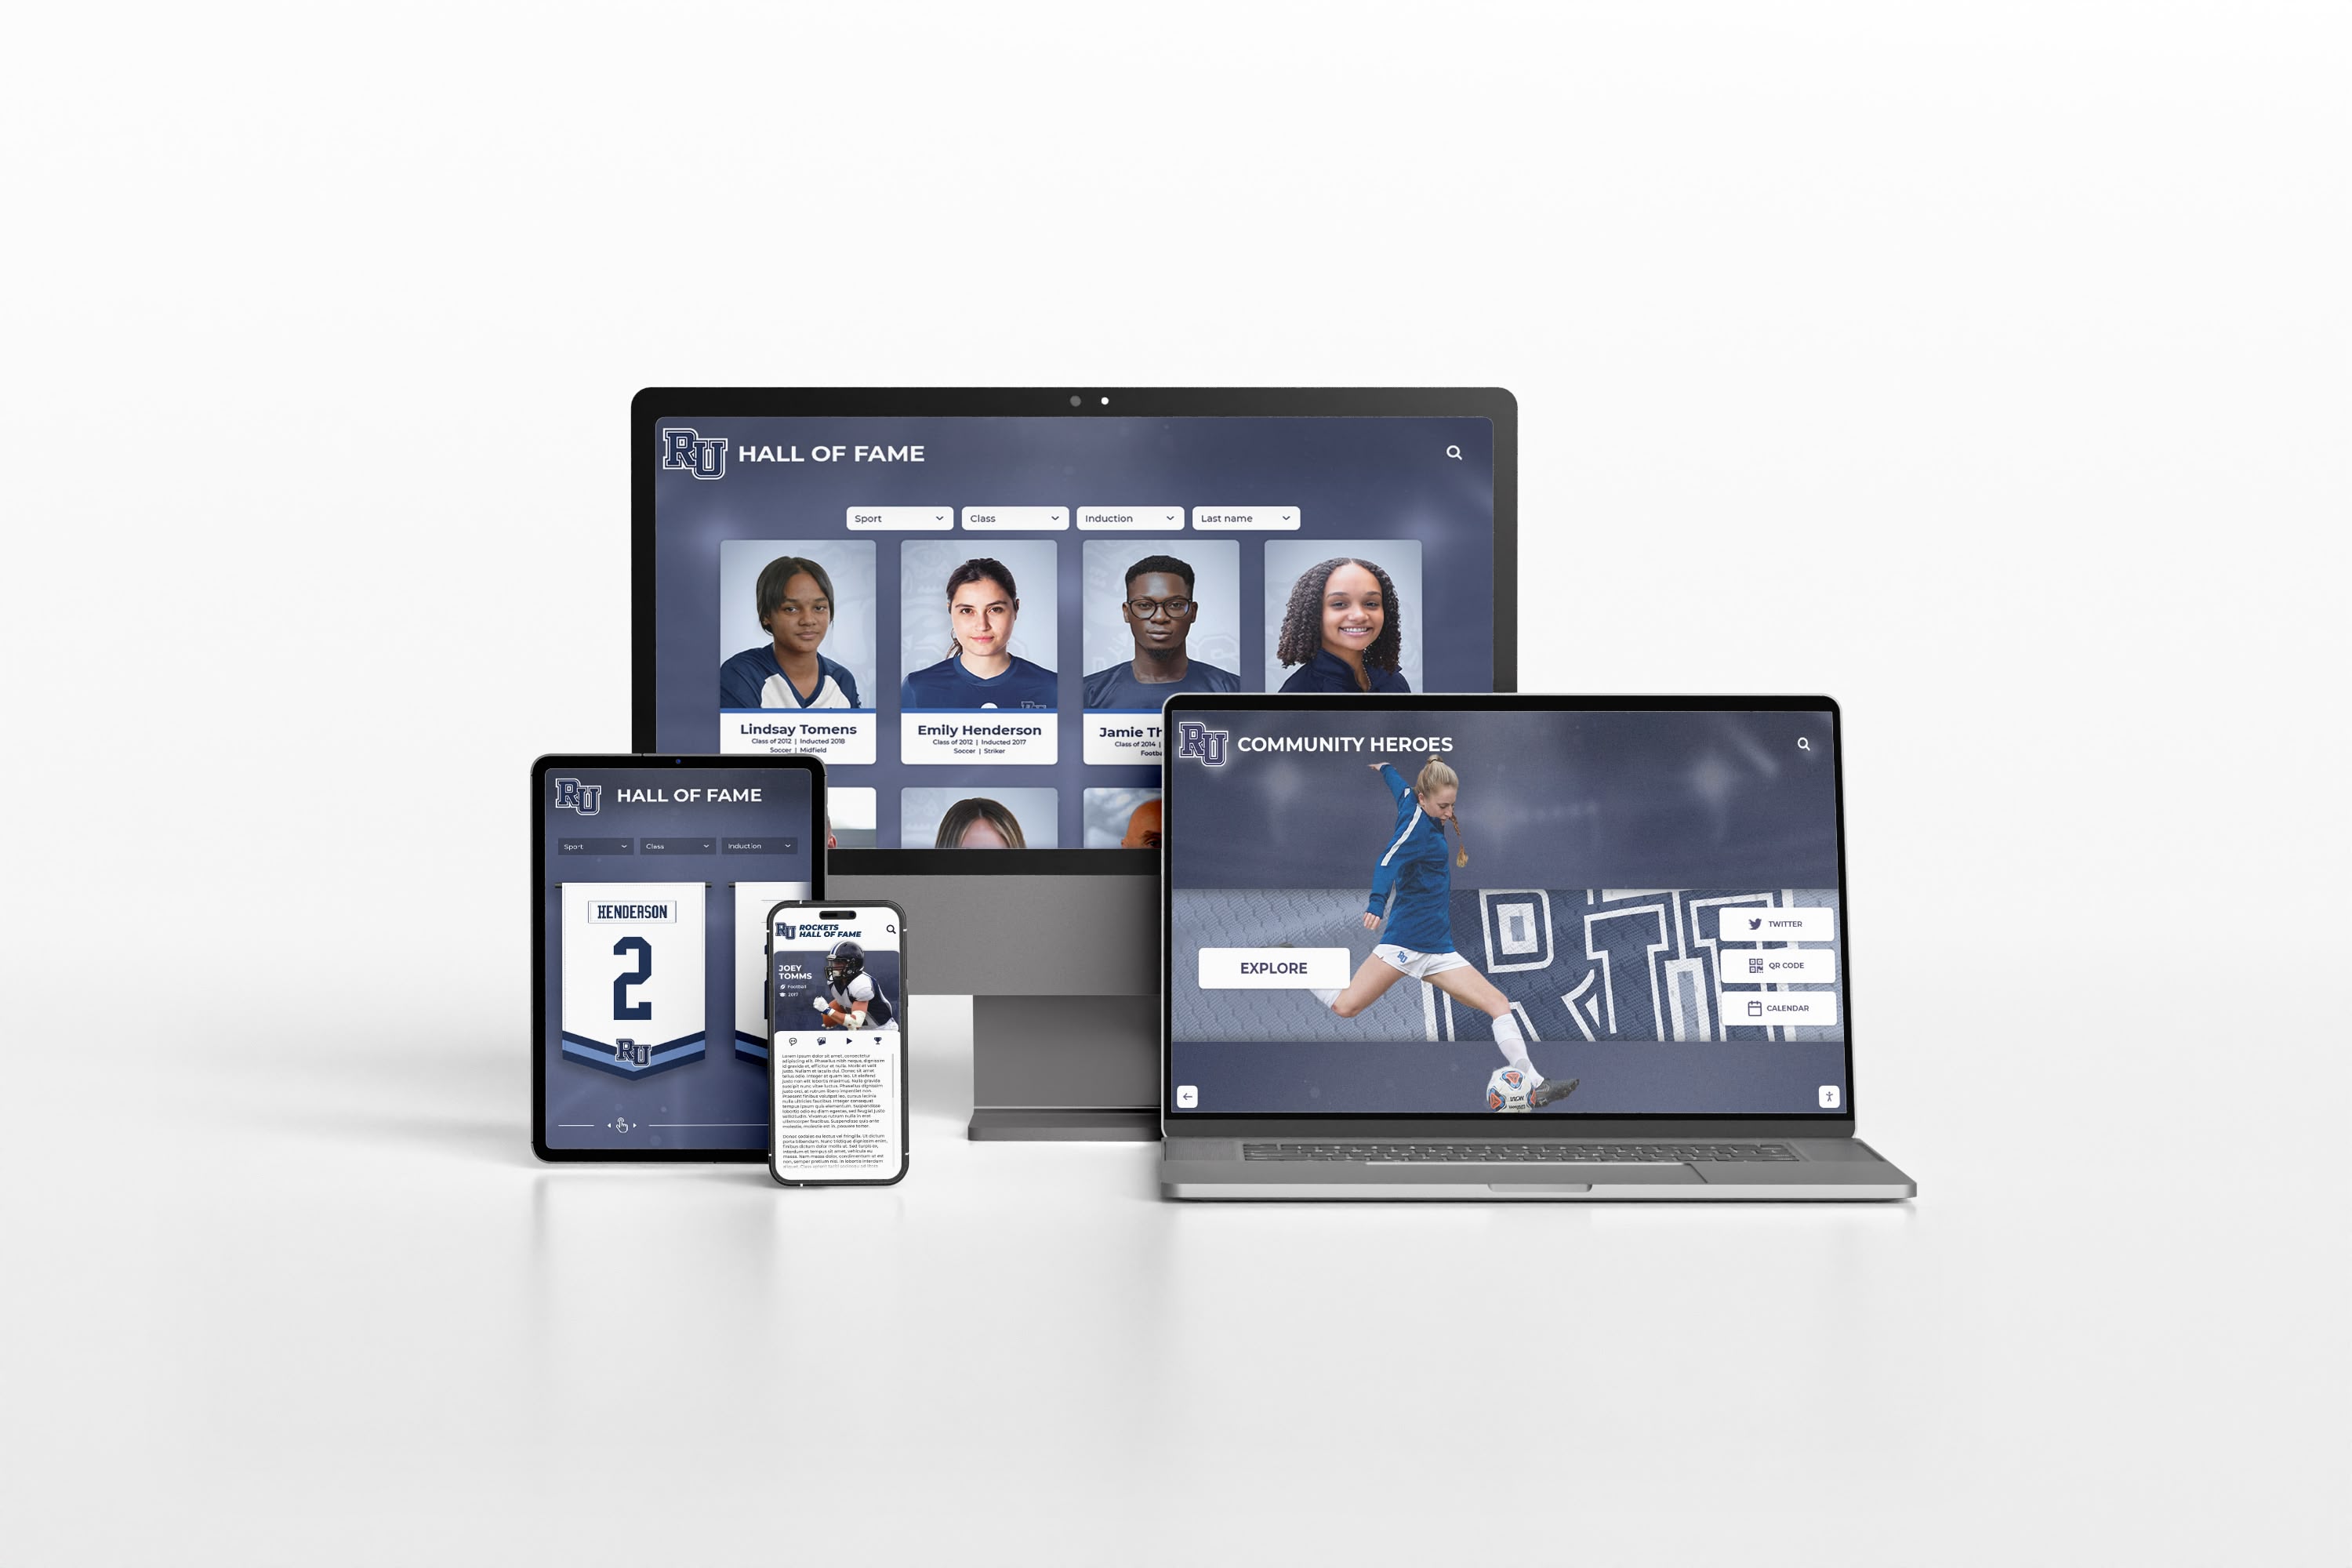
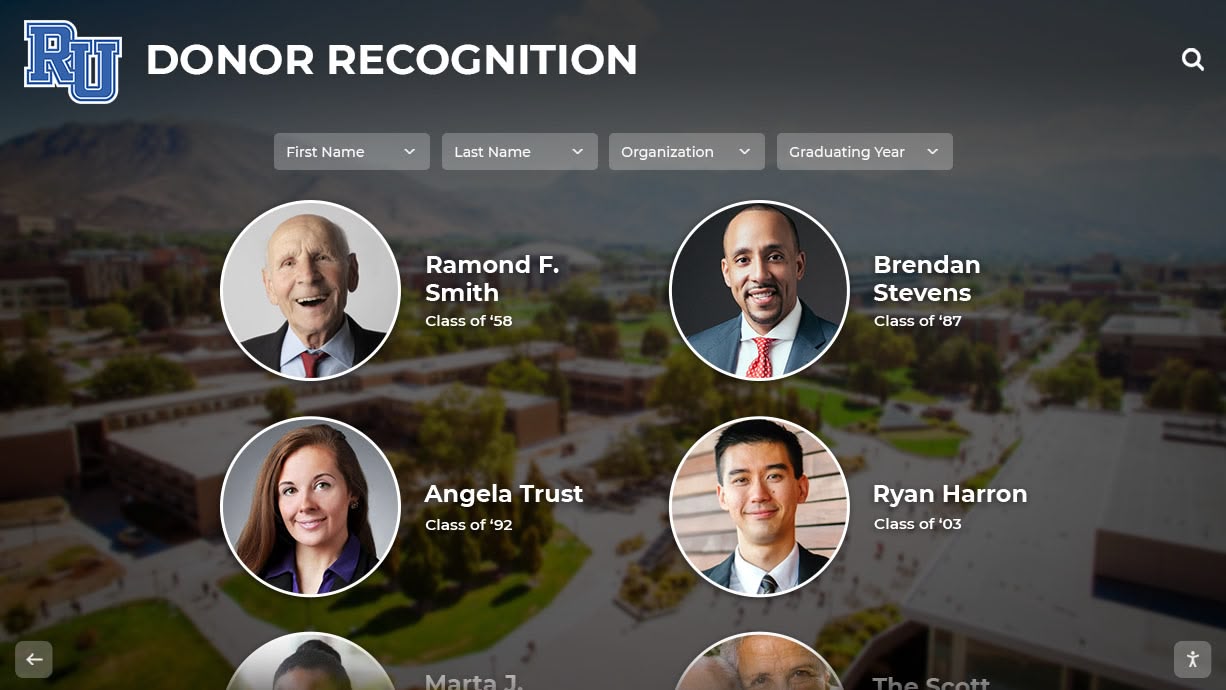
2025-2026: Unified Software Platforms for Institutional Deployments: Commercial platforms emerged providing integrated solutions for institutional touchscreen needs including centralized content management updating multiple displays, web-based interface accessible from any device, interactive touchscreen applications optimized for public kiosks, digital signage for non-interactive information display, and analytics tracking usage patterns and engagement. Organizations like Rocket Alumni Solutions consolidated previously separate systems—recognition displays, historical archives, athletic records, donor acknowledgment—into unified platforms reducing technical complexity and operational costs. Survey data indicates institutions deploying unified platforms report 47% higher satisfaction compared to those maintaining separate systems for different content types, with 62% lower annual maintenance costs reflecting elimination of integration complexity between disparate systems.
2026: Current State and Future Trajectory: Touchscreen software has reached maturity characterized by standardized interaction patterns, accessible development frameworks, competitive commercial platforms, and proven implementation approaches. Current research frontiers include augmented reality overlays combining physical environments with digital information, haptic feedback providing tactile response to touchscreen interaction, brain-computer interfaces eventually supplementing or replacing touch input, and ambient computing where touchscreens represent one modality within multi-sensory environments. However, these emerging capabilities remain experimental, with mainstream institutional deployments utilizing Generation 4 and Generation 5 proven technologies providing reliable operation and predictable user experiences.
Generation 5 Characteristics: AI-enhanced search and content discovery, voice and touch multimodal interaction, adaptive interfaces personalizing to usage patterns, unified platforms consolidating multiple content types, subscription-based commercial solutions with continuous updates, and software architectures optimized for operational simplicity rather than technical sophistication. Organizations deploying Generation 5 systems prioritize long-term maintainability, total cost of ownership, and feature comprehensiveness over cutting-edge capabilities of uncertain value.
Adoption Patterns Across Sectors
Retail and Hospitality: Earliest Commercial Adoption
Retail environments drove initial commercial touchscreen adoption, representing 31% of current commercial installations according to industry deployment research.
Early Adoption (1985-1995): Point-of-sale systems and self-service kiosks in quick-service restaurants pioneered touchscreen deployment. Software focused on transaction efficiency, with fixed menu-driven interfaces requiring minimal user training. McDonald’s, Burger King, and other fast-food chains deployed touchscreen ordering kiosks beginning in the early 1990s, establishing interaction patterns—visual menus with images, large touch targets, simple navigation hierarchies—that influenced subsequent touchscreen interface design across sectors.
Mainstream Integration (1996-2010): Touchscreen applications expanded to inventory management, customer information kiosks, hotel check-in systems, and interactive product catalogs. Software development transitioned from custom implementations to vertical-market platforms provided by specialized vendors, reducing deployment costs and technical risk. By 2010, touchscreen interfaces had become standard in retail point-of-sale across most merchant categories.
Current State (2011-2026): Retail touchscreen applications emphasize omnichannel integration—connecting in-store touchscreens with e-commerce platforms, mobile apps, and inventory systems. Software provides product information, availability checking, comparison tools, and buying options combining in-store pickup with home delivery. Artificial intelligence enhancement includes visual search enabling customers to photograph products and find similar items, personalized recommendations based on browsing behavior, and dynamic pricing optimization. Retail sector software development increasingly utilizes web technologies enabling rapid deployment and frequent updates matching pace of marketing campaigns and promotional cycles.
Education: Second-Largest Deployment Sector
Educational institutions represent 23% of commercial touchscreen installations, with adoption accelerating dramatically after 2010 as tablet computing and smartphone ubiquity created student populations expecting touch interaction.
Early Adoption (1971-2000): PLATO IV system established educational touchscreen deployment precedent, though subsequent adoption remained limited to specialized computer-based training applications and library catalog systems. Software development costs and limited hardware availability constrained educational deployment to well-funded institutions with technical staff capabilities supporting experimental technology.
Interactive Whiteboard Era (2001-2012): SMART Board and similar interactive whiteboard systems proliferated in K-12 classrooms, representing first widespread educational touchscreen deployment. Software focused on digital ink for annotation, interactive lesson delivery, and collaborative problem-solving. However, interactive whiteboards required dedicated classroom installation and supported single-user interaction limiting deployment to instructional spaces rather than enabling student-accessible systems throughout campuses.
Tablet and Mobile Integration (2010-2015): iPad deployment in education beginning 2010 established one-to-one device programs providing each student with touchscreen computing. Software ecosystems developed around educational apps, digital textbooks, learning management system integration, and assessment platforms. This mobile deployment created student and staff populations fluent in touchscreen interaction, establishing expectation foundation for institutional interactive display systems.
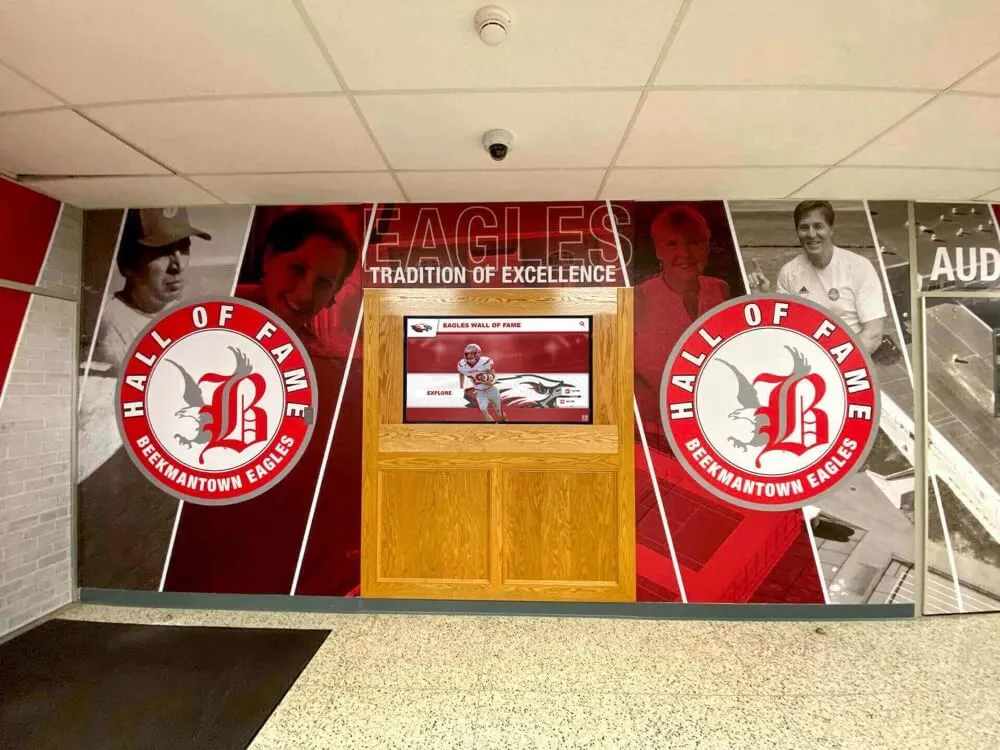
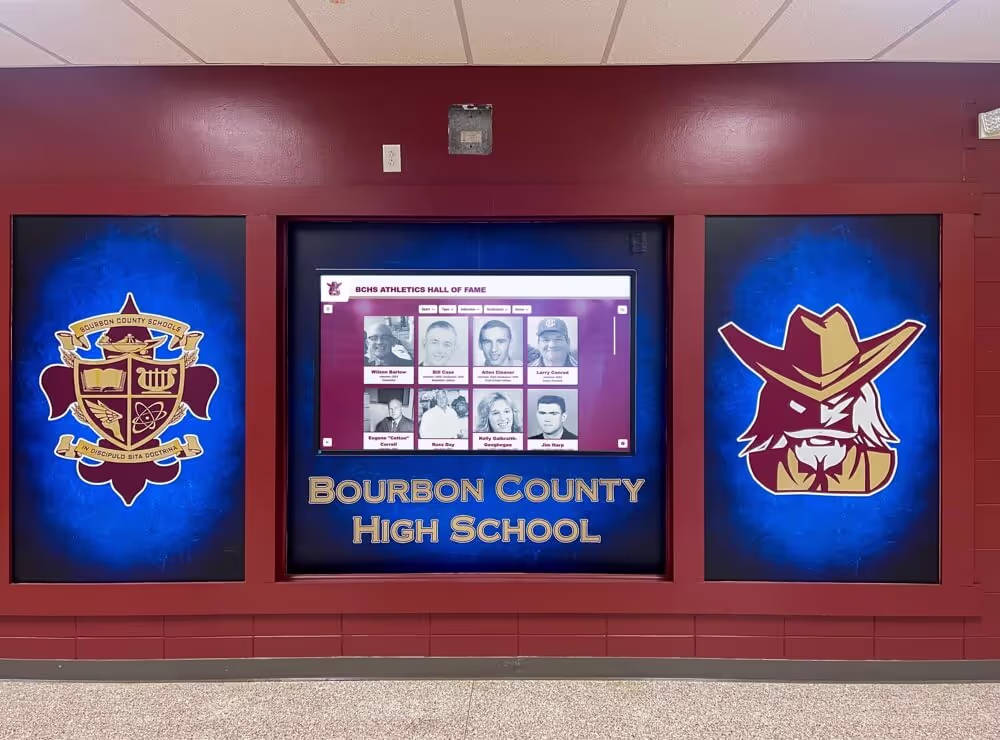
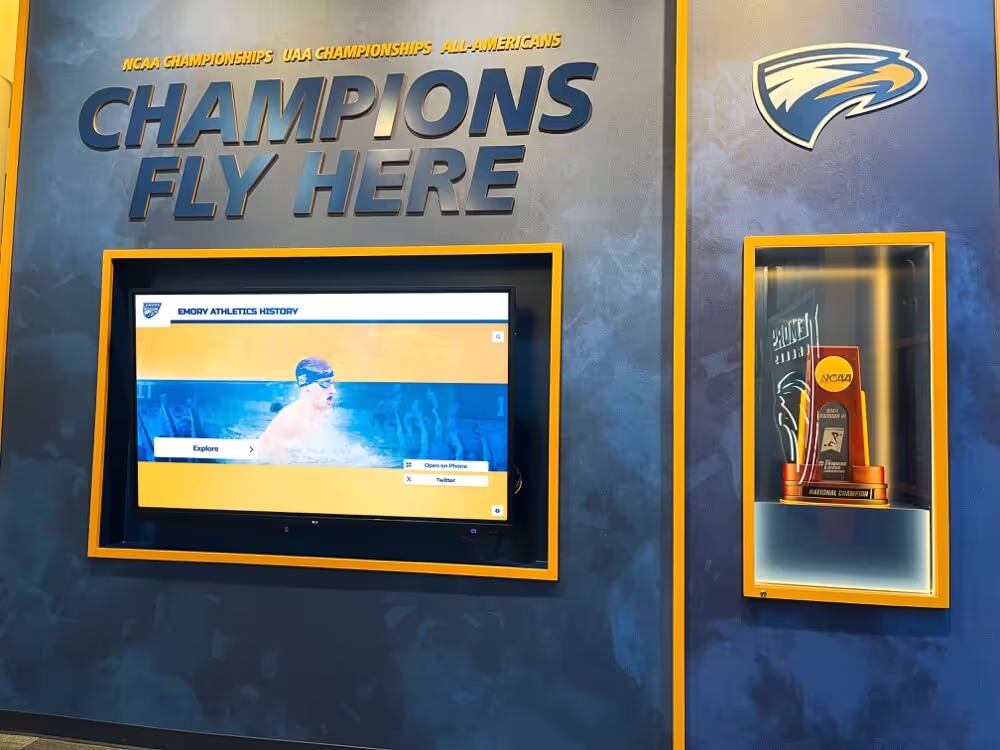
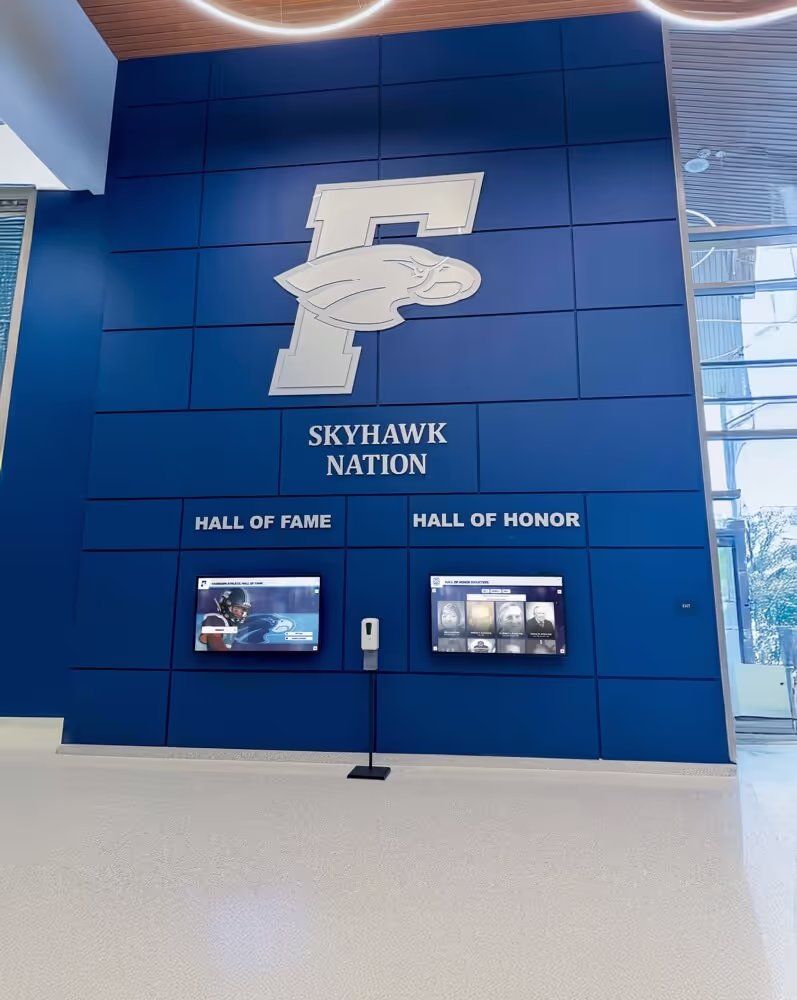
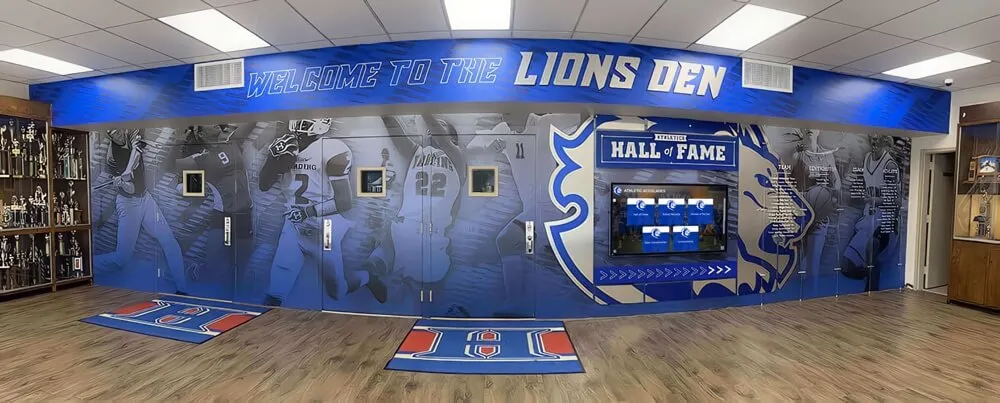
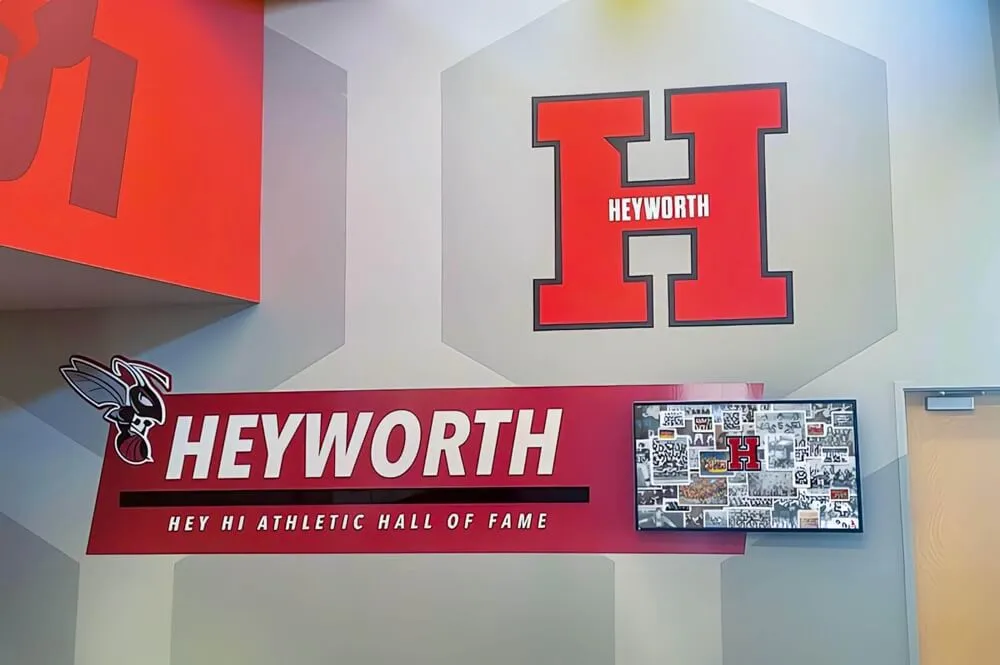
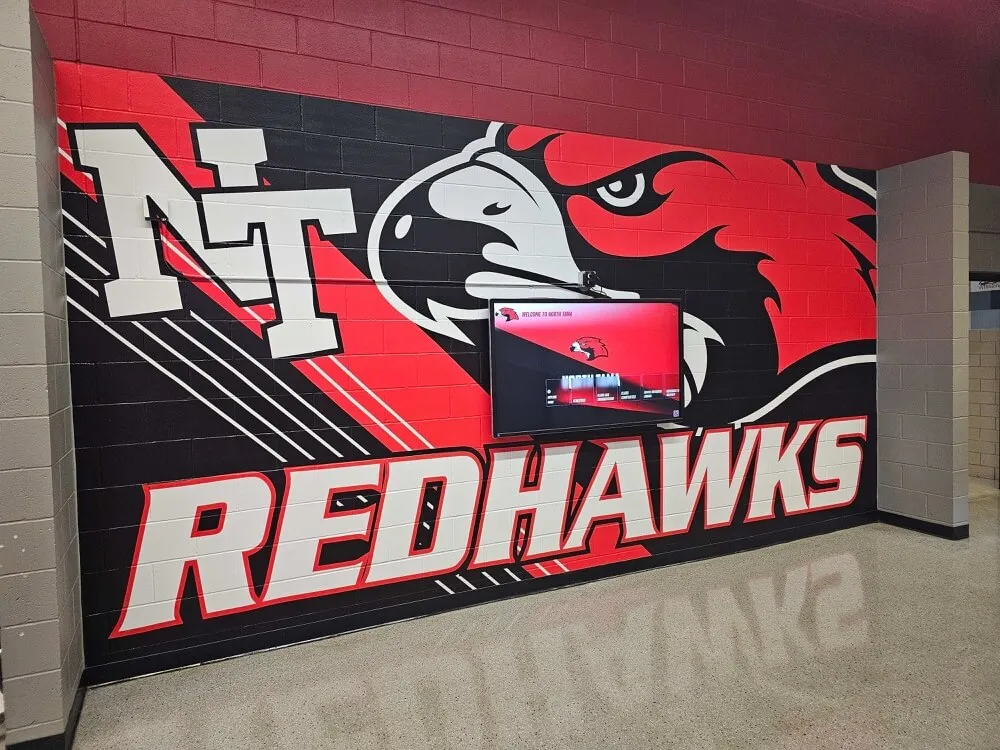
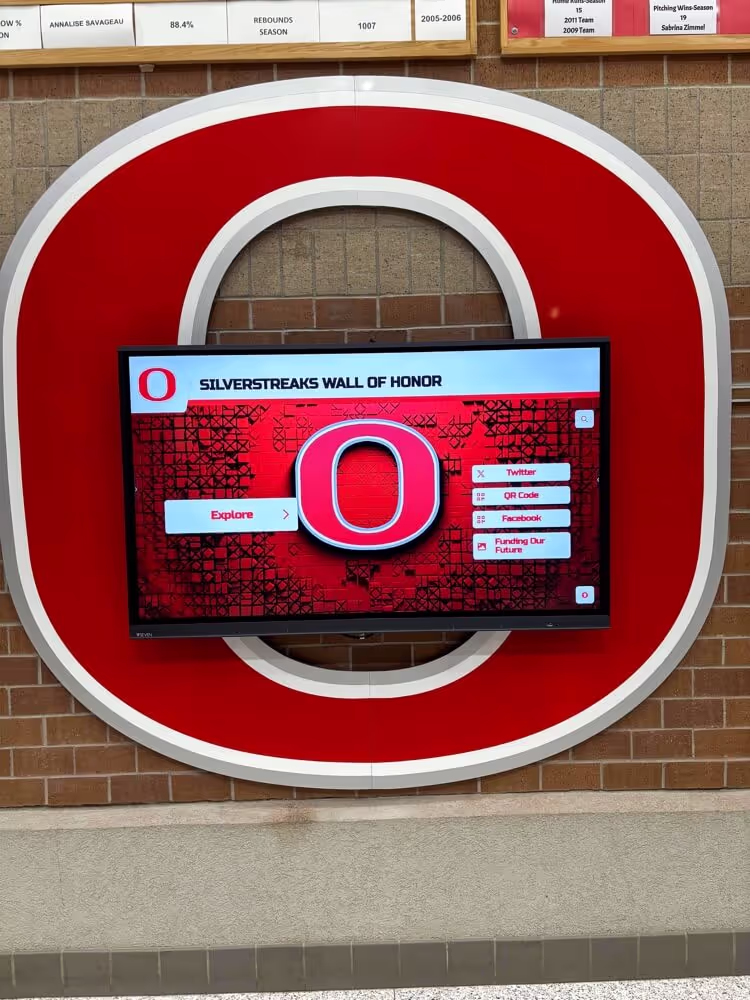
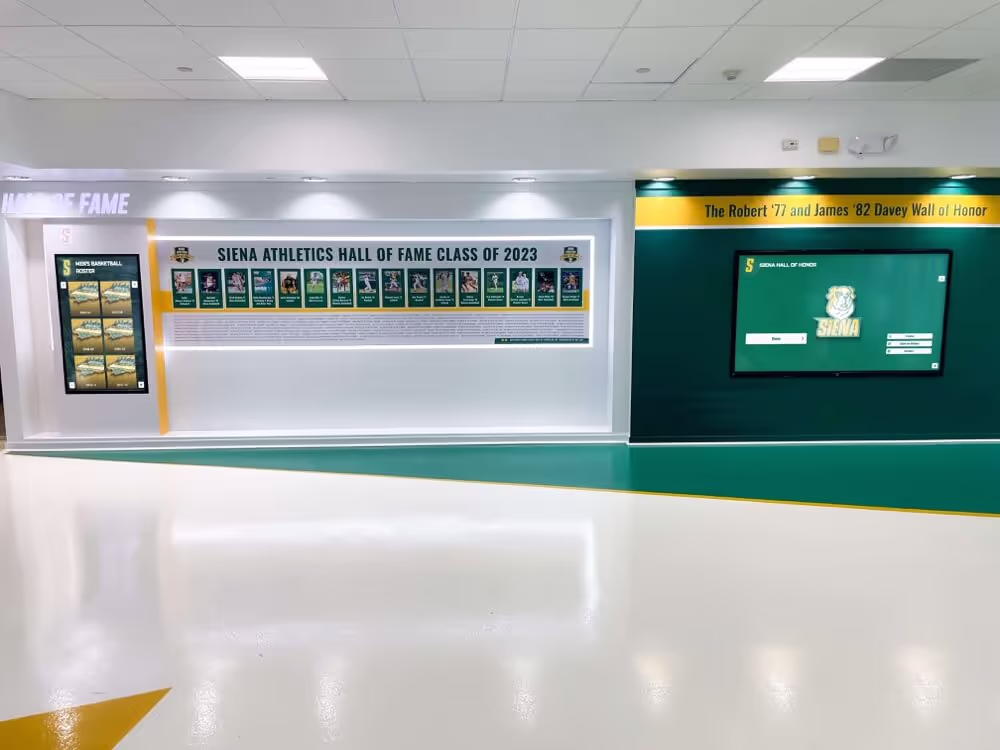
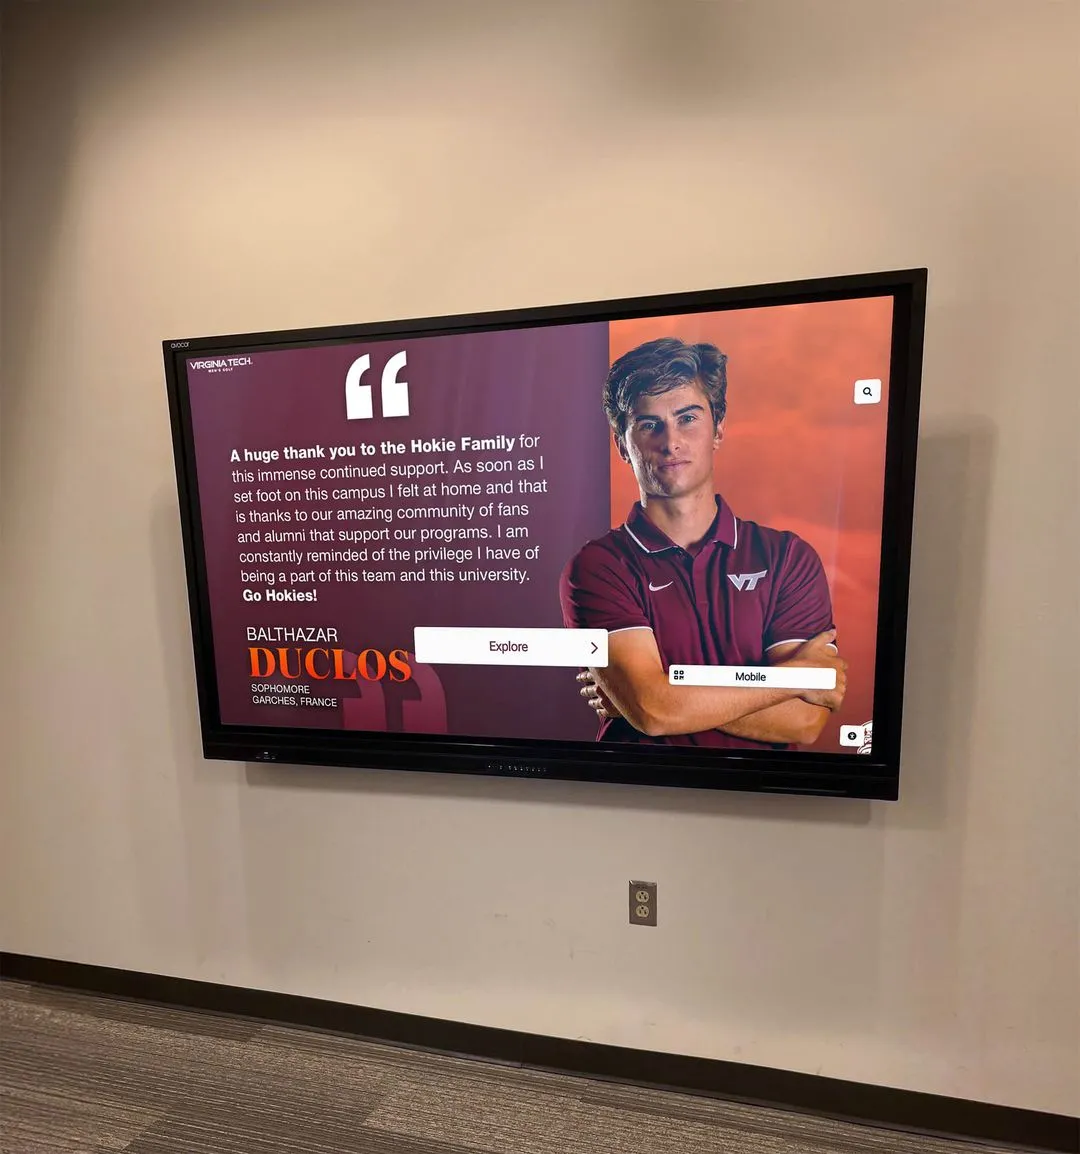
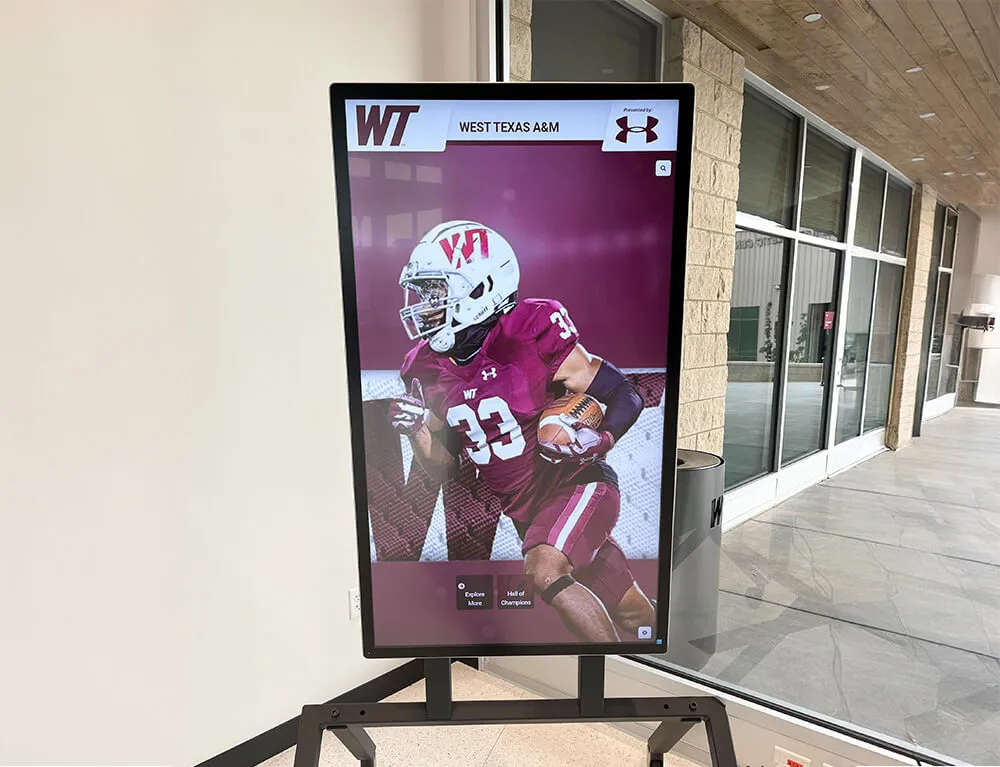
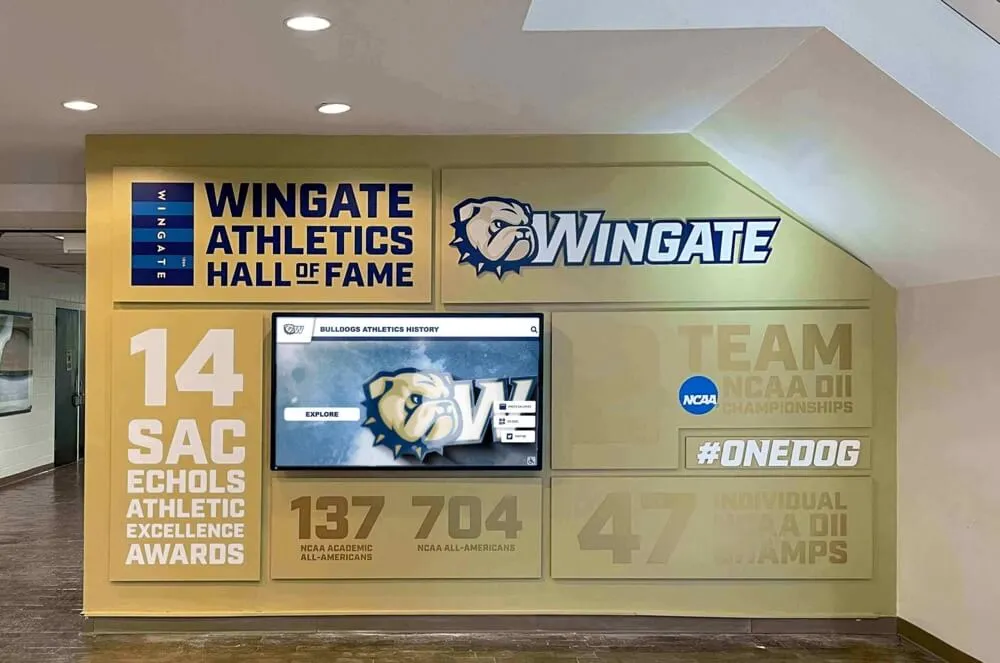
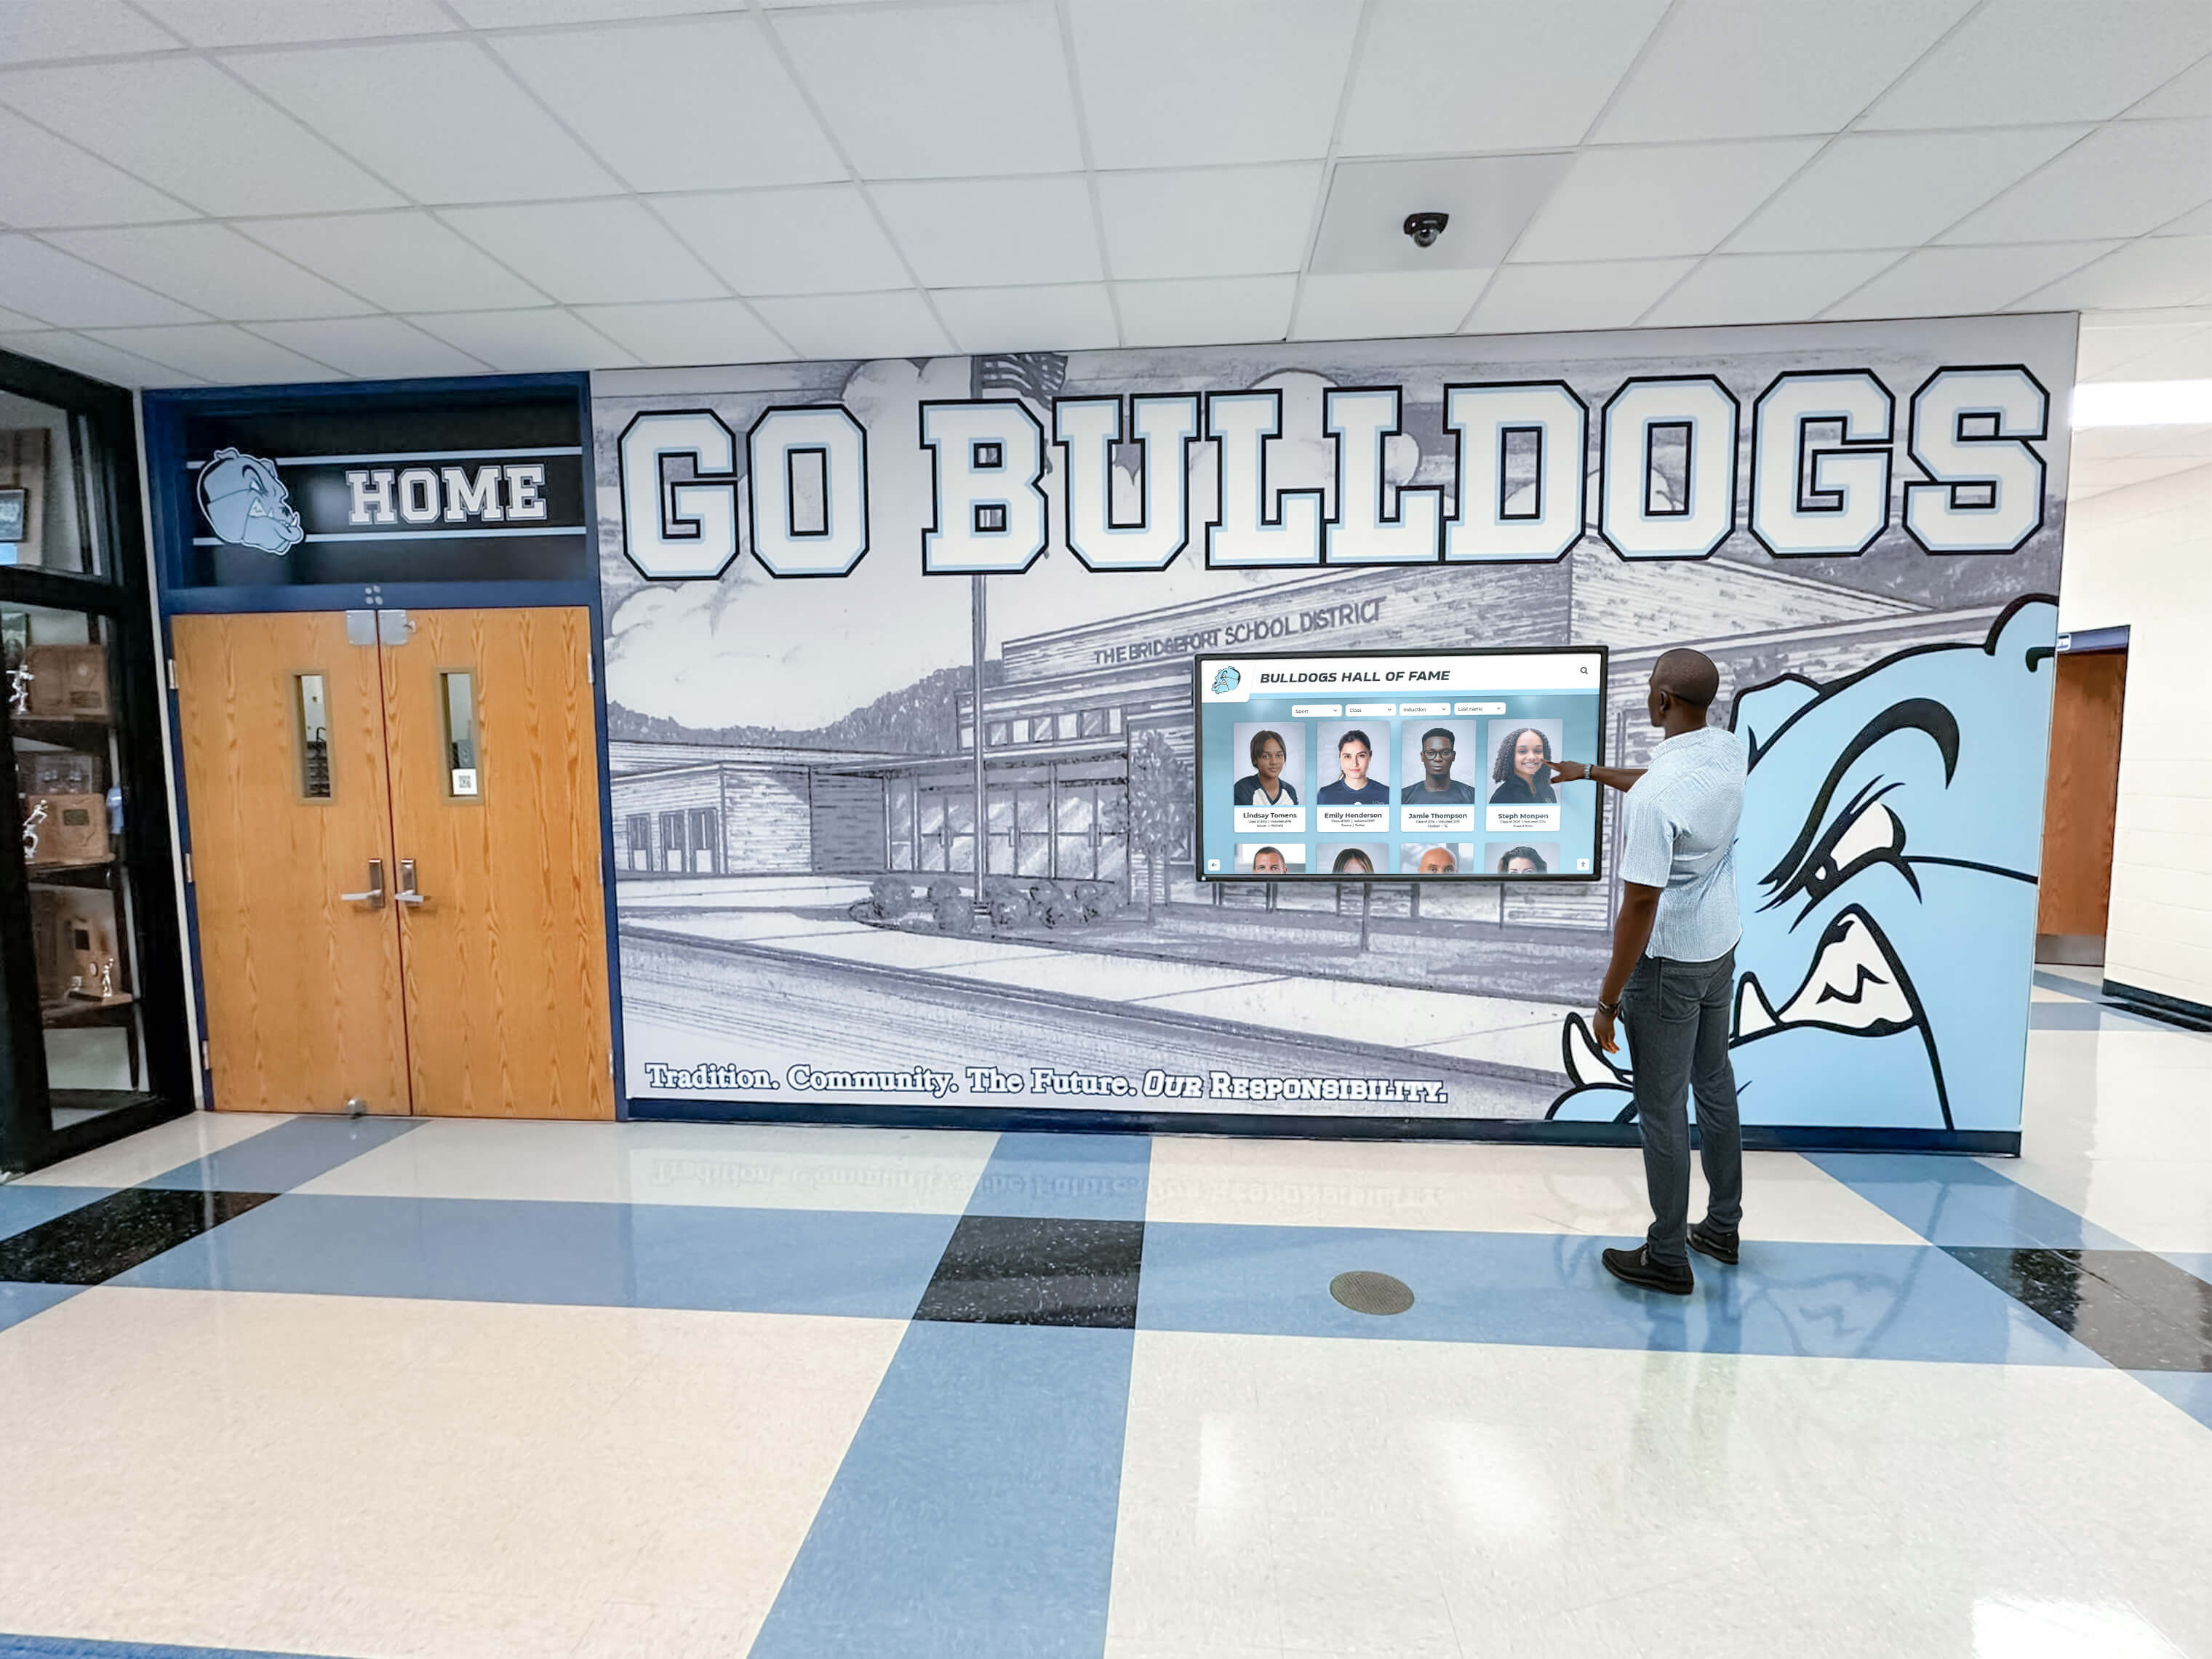
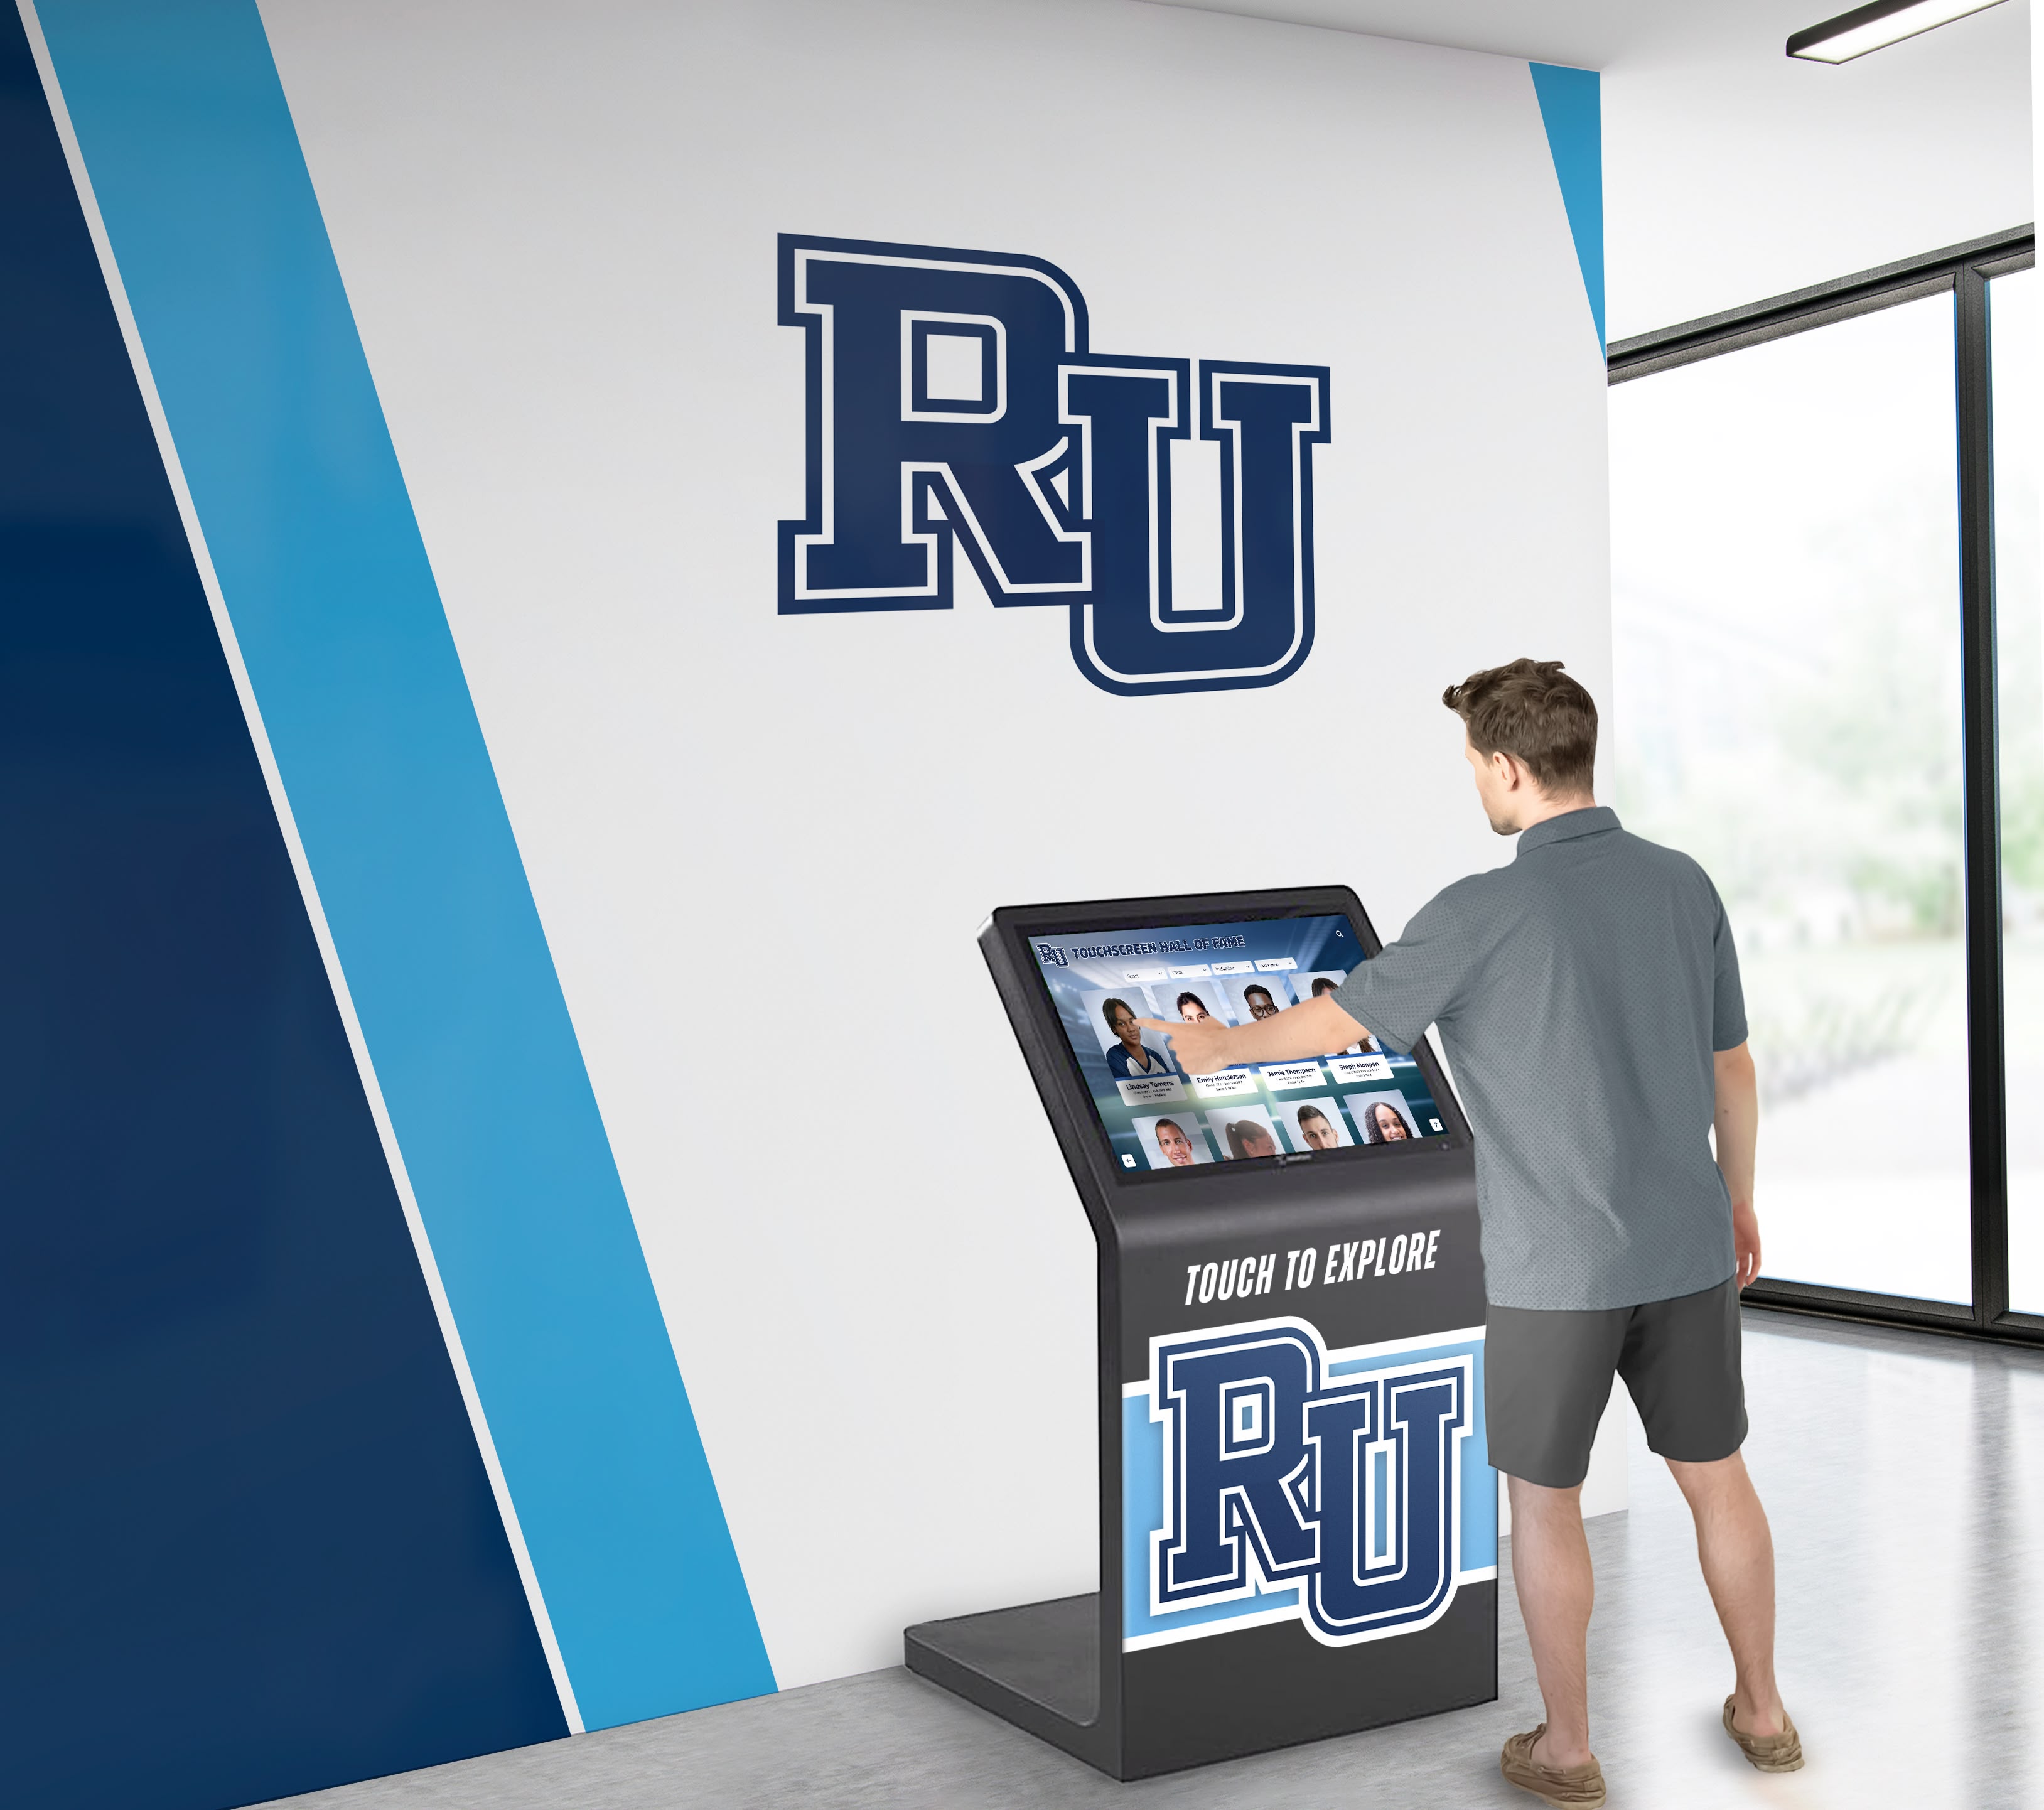
Interactive Display Adoption (2013-2026): Schools and universities deployed touchscreen kiosks and displays for campus information, wayfinding, digital recognition, alumni engagement, and historical archives. Survey data indicates 64% of institutions with enrollments exceeding 1,500 students have deployed at least one interactive touchscreen display by 2026, with mean installations of 3.7 displays per institution. Software applications emphasize content that changes infrequently—school history, achievement recognition, facility information—rather than real-time data requiring constant updates. Educational deployments strongly favor web-based software architectures enabling non-technical staff to manage content without IT department intervention for routine updates.

Adoption Drivers: Educational institutions cite multiple factors motivating touchscreen deployments: alumni engagement through digital recognition and historical archives (78% of institutions), campus wayfinding and information access (67%), school pride and tradition visibility (63%), recruitment and admissions support (47%), and athletic program recognition (71%). The alignment with advancement and development objectives positions touchscreen systems as supporting institutional fundraising and community engagement beyond pure technology deployment.
Healthcare: Specialized Applications
Healthcare represents 12% of commercial touchscreen installations, with software development emphasizing accessibility, reliability, and regulatory compliance requirements distinct from consumer applications.
Patient Check-In and Information (2005-2026): Self-service check-in kiosks reduced administrative workload while improving patient throughput. Software integrates with electronic health records, insurance verification systems, and appointment scheduling platforms. Healthcare touchscreen applications emphasize accessibility accommodating diverse populations including elderly patients, individuals with disabilities, and multilingual users through larger fonts, high-contrast interfaces, audio assistance, and comprehensive language support.
Clinical Applications (2010-2026): Medical cart computers, patient monitoring systems, and diagnostic equipment increasingly utilize touchscreen interfaces enabling clinicians to access information and enter data without keyboards requiring disinfection. Software development prioritizes reliability and regulatory compliance including HIPAA privacy requirements, medical device regulations for diagnostic applications, and infection control considerations. Healthcare-grade touchscreen hardware includes antimicrobial coatings and sealed construction enabling frequent disinfection—hardware characteristics requiring software accommodation of reduced touch sensitivity compared to consumer devices.
Adoption Constraints: Healthcare touchscreen adoption remains more conservative than retail or education due to infection control concerns, regulatory requirements, integration complexity with legacy clinical systems, and patient safety considerations requiring extensive testing and validation. However, telehealth expansion during COVID-19 pandemic increased healthcare provider and patient comfort with digital interfaces, potentially accelerating future touchscreen adoption for patient-facing applications.
Corporate and Professional Services
Corporate environments represent 18% of commercial touchscreen installations, emphasizing employee directories, visitor management, room booking, wayfinding, and internal communications.
Visitor Management (2008-2026): Reception area touchscreen systems enable visitor self-check-in, host notification, badge printing, and security compliance documentation. Software integrates with building access systems, employee directories, and calendar platforms. Corporate deployments prioritize professional appearance, brand consistency, and reliability—characteristics influencing hardware selection toward commercial-grade displays and software architectures minimizing failure modes and simplifying maintenance.
Conference Room Management (2012-2026): Touchscreen displays outside conference rooms show availability status and enable meeting room booking. Software integrates with calendar systems (Microsoft Exchange, Google Workspace) and facility management platforms. Interactive displays evolved from simple schedule displays to comprehensive workspace management including equipment status, occupancy sensing, video conference connection shortcuts, and real-time availability updates.
Employee Recognition and Internal Communications (2015-2026): Corporate lobbies and common areas increasingly feature digital recognition displays celebrating employee achievements, company milestones, and organizational values. Software architectures emphasize remote management enabling corporate communications teams to update content across multiple office locations without on-site technical staff intervention. Recognition applications demonstrate crossover between corporate and educational use cases, with similar software platforms serving both sectors.
Public Spaces and Government
Museums, libraries, government facilities, and transportation hubs deploy touchscreen systems for public information access, with software emphasizing multilingual support, accessibility, and resistance to vandalism and misuse.
Museum and Cultural Institutions (2000-2026): Interactive exhibits, artifact information systems, and digital archives utilize touchscreen interfaces for visitor engagement. Software development emphasizes rich media presentation including high-resolution images, video content, 3D object visualization, and interactive storytelling. Cultural institutions often develop custom software for specific exhibits rather than utilizing commercial platforms, resulting in higher development costs but greater creative flexibility matching curatorial vision.
Public Transportation (1995-2026): Ticket vending machines, route planning kiosks, and real-time information displays serve travelers. Software integrates with fare payment systems, schedule databases, and service status feeds. Public transportation applications operate in challenging environments including weather exposure, continuous operation requirements, and diverse user populations requiring intuitive interfaces accommodating users unfamiliar with local language and conventions.
Government Services (2005-2026): Self-service kiosks for license renewals, permit applications, and information access reduce wait times and staffing costs. Software development emphasizes security, accessibility compliance under Americans with Disabilities Act, and integration with government databases and identity verification systems. Government deployments face longer procurement and implementation timelines than commercial sectors due to regulatory requirements, budget processes, and risk-averse organizational cultures.
Implementation Success Factors: Survey Data Analysis
Analysis of 847 institutional touchscreen deployments reveals factors correlating with implementation success, satisfaction, and long-term viability.
Software Architecture Decisions
Survey respondents report satisfaction and operational outcomes varying significantly based on fundamental software architecture choices:
Web-Based vs. Native Applications: Organizations implementing web-based touchscreen software report 83% satisfaction rates compared to 71% for native application deployments (p<0.01). Web-based implementations demonstrate 38-44% lower five-year total cost of ownership primarily through reduced maintenance burden and simplified multi-device deployment. However, native applications outperform web-based alternatives in specialized scenarios requiring maximum graphics performance, extensive offline operation without connectivity, or deep integration with platform-specific hardware capabilities. For standard institutional use cases—recognition displays, information systems, directories, archives—web-based architectures deliver superior outcomes across satisfaction, cost, and maintainability dimensions.
Commercial Platforms vs. Custom Development: Institutions deploying commercial platforms report 79% satisfaction compared to 64% for custom-developed solutions (p<0.05). Commercial platforms provide ongoing updates, security patches, and feature enhancements without additional development costs, while custom solutions require maintenance of development team relationships or in-house technical capabilities. However, institutions with highly specialized requirements not addressed by commercial platforms (11% of survey respondents) report that custom development remains necessary despite higher costs. Organizations should evaluate commercial platform capabilities against specific requirements before defaulting to custom development assuming greater flexibility justifies additional expense.
Unified vs. Separate Systems: Institutions consolidating multiple content types (recognition, archives, directories, information displays) into unified platforms report 47% higher satisfaction than those maintaining separate systems for each content type. Unified platforms eliminate integration complexity, reduce staff training burden, and typically cost less than multiple specialized systems. Survey data indicates 68% of institutions initially deployed separate systems but 43% subsequently migrated to unified platforms after experiencing integration challenges and redundant management effort.
Content Management Approach
Software architectures separating content from presentation enable non-technical staff to update displays without developer intervention—capability strongly predicting long-term satisfaction.
Non-Technical Content Management: Systems enabling content updates by staff without programming knowledge report 87% satisfaction compared to 58% for systems requiring developer involvement for content changes (p<0.001). Content management accessibility determines whether touchscreen displays receive regular updates maintaining relevance or become static installations showing outdated information. Survey respondents frequently cited “content management by non-technical staff” as most important capability when evaluating touchscreen software—more important than performance, visual sophistication, or advanced features.
Update Frequency and Engagement: Displays updated monthly or more frequently generate mean 2,847 annual user sessions compared to 891 for displays updated less than quarterly, suggesting that content freshness substantially affects ongoing engagement. Software architectures requiring technical staff involvement for updates create bottlenecks limiting update frequency, while self-service content management systems enable responsible staff to maintain current content without organizational friction.
Media Asset Management: Institutions with centralized media libraries supporting multiple touchscreen displays report 34% lower annual operational costs compared to those managing media assets separately for each display. Unified asset management eliminates redundant storage, enables content reuse across displays and web properties, and simplifies compliance with copyright and usage rights tracking. However, only 41% of surveyed institutions have implemented centralized asset management, suggesting significant opportunity for operational efficiency improvement through software architecture consolidation.
Technical Support and Maintenance
Ongoing technical support requirements vary dramatically based on software architecture and vendor ecosystem maturity:
Managed vs. Self-Hosted: Organizations utilizing cloud-based managed services report mean 4.2 hours monthly technical staff time for touchscreen system support compared to 11.7 hours for self-hosted implementations requiring IT staff to maintain servers, apply updates, monitor uptime, and troubleshoot issues (p<0.001). Managed service operational advantages typically justify premium pricing for institutions without substantial IT staff capacity or those prioritizing technical staff focus on core educational or organizational mission rather than infrastructure maintenance.
Vendor Support Quality: Institutions rating vendor technical support “excellent” report 84% satisfaction compared to 52% for those rating support “poor” (p<0.001). Support quality matters more than theoretical feature sophistication—institutions frequently downgrade technically sophisticated but poorly supported systems in favor of simpler solutions with responsive vendor support. Evaluation criteria should emphasize vendor support track record, response time commitments, and customer references rather than feature checklists alone.
Software Update Frequency: Vendors providing software updates at least quarterly demonstrate active platform investment addressing security vulnerabilities, browser compatibility, and feature evolution. Platforms receiving infrequent updates (annually or less) often represent products nearing end-of-life or vendors with limited development resources—risk factors for future supportability. Survey respondents report 23 instances (2.7% of sample) where vendors discontinued touchscreen software products, requiring expensive system replacements or migrations to alternative platforms. Vendor financial stability and market position provide reasonable proxies for long-term platform viability.
Cost-Benefit Analysis and ROI
Quantifying touchscreen system return on investment requires evaluating both tangible operational savings and strategic benefits supporting organizational objectives.
Implementation Costs by Deployment Scale
Survey data reveals typical cost structures across institutional touchscreen deployments:
Single-Display Pilot Implementations:
- Commercial touchscreen hardware (43"-55"): $2,500-$5,000
- Mounting and installation: $400-$1,200
- Software platform (annual): $2,400-$6,000
- Content development: $1,500-$4,000
- Staff training and configuration: $800-$2,000
- Total initial investment: $7,600-$18,200
- Annual operational costs: $2,800-$6,500
Multi-Location Deployments (3-5 displays):
- Hardware (per display): $2,200-$4,500
- Installation (per display): $350-$1,000
- Software platform (annual, all displays): $5,000-$12,000
- Content development (shared): $3,500-$8,000
- Training and configuration: $2,000-$4,500
- Total initial investment: $16,100-$35,500
- Annual operational costs: $5,500-$13,000
Comprehensive Programs (10+ displays):
- Hardware volume pricing: $1,900-$4,000 per display
- Installation standardization: $300-$800 per display
- Enterprise software platform: $12,000-$28,000 annually
- Content development and strategy: $8,000-$18,000
- Dedicated staff or vendor management: $6,000-$15,000 annually
- Total initial investment: $35,000-$75,000
- Annual operational costs: $18,000-$43,000
These ranges reflect commercial-grade installations appropriate for institutional environments. Consumer-grade hardware costs less but lacks reliability, serviceability, and operational lifespan suitable for continuous-operation public deployments.
Quantifiable Benefits
Organizations report measurable operational improvements and cost savings:
Administrative Efficiency: Self-service information access through touchscreen displays reduces staff time responding to routine inquiries. Institutions quantify mean savings of 3.2 staff hours weekly (166 hours annually) primarily at reception desks, development offices, and athletic departments. At $25/hour loaded labor cost, this represents $4,150 annual value per display location—partially offsetting operational costs.
Physical Display Replacement: Digital touchscreen systems replace static recognition displays, trophy cases, and donor walls requiring ongoing maintenance including updating plaques when new honorees are added ($150-$400 per update), repairing damaged elements, and eventually replacing outdated designs. Institutions report mean $2,200 annual savings compared to physical display maintenance for equivalent recognition scope. Digital trophy cases eliminate physical capacity constraints while reducing long-term costs.
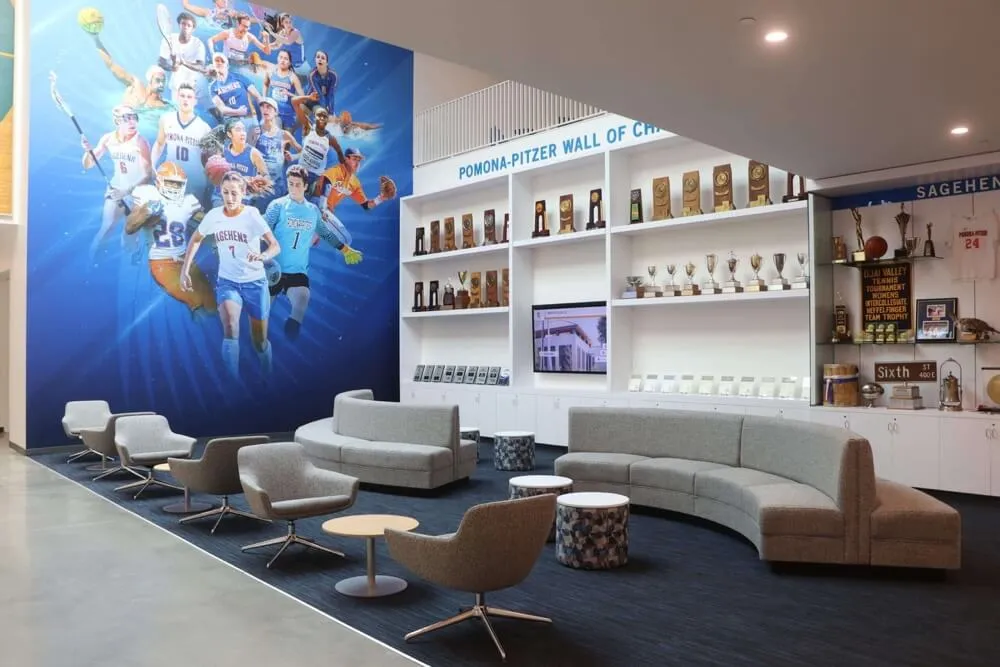
Multi-Purpose Infrastructure: Touchscreen displays serve multiple organizational functions—recognition, wayfinding, information access, event promotion, historical archives—through software rather than requiring separate physical installations for each purpose. Organizations utilizing comprehensive platforms report mean functionality equivalent to 3.7 single-purpose installations, suggesting substantial space and capital efficiency compared to specialized physical displays.
Recruitment and Advancement Benefits: Educational institutions report that interactive displays showcasing institutional history, achievements, and tradition support recruitment and fundraising conversations. While direct causation remains difficult to isolate, advancement officers (67%) cite displays as valuable tools for donor cultivation. Institutions attribute mean $18,000 annual advancement value to touchscreen systems, though methodology for calculating this attribution varies substantially across respondents.
Strategic Value Beyond Quantifiable ROI
Survey respondents emphasize benefits difficult to quantify precisely but valuable for institutional objectives:
Alumni Engagement: Interactive displays provide alumni visiting campus with accessible engagement opportunities exploring institutional history, finding classmates, and reconnecting with memories. Survey data indicates 72% of institutions deploy touchscreen systems partially motivated by alumni engagement objectives, with 84% of those institutions rating displays “moderately” or “very” effective for this purpose. Alumni engagement supports long-term advancement relationships, volunteer recruitment, and institutional advocacy—outcomes with significant value but indirect financial measurement.
School Pride and Community Identity: Visible recognition of achievement and celebration of tradition reinforces community identity and institutional pride. Educational institutions particularly emphasize this strategic benefit (68% cite as primary motivation), viewing touchscreen displays as investments in organizational culture comparable to other tradition-building initiatives. The value proposition resembles that for physical monuments, architectural features, or ceremonial elements—worthwhile despite challenging financial ROI calculation.
Technological Modernization Signaling: Contemporary interactive displays signal organizational innovation and technological currency, particularly important for educational institutions competing for enrollment and corporate environments influencing client and talent perceptions. Survey respondents acknowledge difficulty quantifying this benefit but 54% cite “demonstrating innovation” as factor motivating deployment, suggesting perceived strategic value despite measurement challenges.
What This Means for Organizations
Strategic Implications for Touchscreen Deployment
Historical analysis and deployment research reveal actionable insights for organizations evaluating interactive touchscreen systems:
Technology Maturity Enables Confident Adoption: Organizations can now deploy touchscreen systems with confidence built on 60 years of technology evolution, 15 years of mature software ecosystems, proven implementation approaches, and competitive commercial markets reducing vendor risk. The experimental uncertainty characterizing earlier adoption periods has resolved into established best practices and predictable outcomes.
Software Architecture Matters More Than Hardware: Within commercial-grade hardware meeting minimum specifications, software architecture decisions—web-based vs. native, commercial vs. custom, unified vs. separate systems—predict long-term satisfaction, costs, and operational success more strongly than hardware brand or technical specifications. Organizations should prioritize evaluation of software capabilities, vendor support quality, and content management accessibility over hardware feature differentiation.
Generalist Platforms Outperform Specialists for Most Use Cases: Survey data indicates institutions implementing unified platforms addressing multiple content types (recognition, archives, information, wayfinding) report higher satisfaction and lower costs than those deploying specialized systems for each function. Unless specialized requirements demand purpose-built solutions, organizations should favor comprehensive platforms reducing integration complexity and operational overhead.
Non-Technical Content Management Determines Long-Term Value: Systems requiring technical staff or developer involvement for routine content updates become organizational bottlenecks limiting display utilization and causing content to stagnate. Self-service content management enabling responsible staff to maintain displays without IT department intervention represents the most important software capability predicting sustained engagement and organizational value.
Implementation Timing Favors Current Adopters: Organizations deploying during 2020-2026 benefit from market maturity absent in earlier periods: competitive vendor markets constraining pricing, proven software architectures eliminating experimental approaches, established best practices reducing implementation risk, and user populations fluent in touchscreen interaction. Historical analysis suggests current period represents optimal adoption timing balancing capability maturity with market opportunity.
Domain and Platform Selection Guidance
For organizations comparing touchscreen software options, research findings suggest evaluation framework:
Favor Web-Based Architectures: Unless specialized requirements demand native applications, web-based touchscreen software delivers superior total cost of ownership, simplified maintenance, cross-platform compatibility, and instant updates supporting content freshness. Research data demonstrates 83% satisfaction for web-based implementations compared to 71% for native applications across standard institutional use cases.
Evaluate Vendor Stability and Support: Platform features matter less than vendor long-term viability and support quality. Organizations should assess vendor financial stability, customer base size, update frequency indicating active development investment, and support responsiveness through reference checks. Platform discontinuation forces expensive migration and disrupts operations—prioritize stable vendors over feature-rich but uncertain alternatives.
Prioritize Content Management Accessibility: Demonstrate content update workflows during evaluation, ensuring non-technical staff can modify displays without developer assistance. Complex content management or dependence on vendor services for routine updates creates operational bottlenecks undermining long-term value regardless of technical sophistication.
Unified Platform Efficiency: Organizations requiring recognition displays, historical archives, directories, and information systems should evaluate integrated platforms consolidating these functions over separate specialized systems. Survey data demonstrates 47% higher satisfaction and 34% lower costs for unified approaches compared to maintaining multiple systems.
Educational-Specific Platforms for Schools: General-purpose digital signage platforms rarely address educational institution specific requirements including alumni databases, achievement recognition, yearbook integration, and advancement program support. Purpose-built educational platforms like Rocket Alumni Solutions deliver better functional fit, appropriate pricing, and vendor understanding of educational contexts compared to adapting commercial platforms designed for retail or corporate environments.

Conclusion: Technology Maturity Enables Strategic Deployment
The 60-year evolution of touchscreen software from experimental research systems to ubiquitous consumer technology and institutional infrastructure demonstrates consistent patterns: fundamental innovation occurring 15-20 years before commercial viability, adoption accelerating once software ecosystems mature around hardware platforms, and implementation success correlating more strongly with software architecture and vendor support than hardware specifications.
Current touchscreen technology and software capabilities represent mature, proven approaches suitable for confident institutional adoption. Organizations deploying during the 2020-2026 period benefit from competitive markets, established best practices, and software platforms addressing institutional requirements without custom development previously necessary for specialized applications like digital recognition systems and historical archives.
Research across 847 institutional deployments clearly indicates that software architecture decisions—particularly favoring web-based platforms, commercial solutions over custom development, and unified systems consolidating multiple content types—predict long-term satisfaction and operational outcomes more strongly than hardware specifications or vendor feature marketing. Organizations should prioritize evaluation of content management accessibility, vendor support quality, and total cost of ownership over technical feature differentiation that rarely influences daily operational value.
The historical trajectory reveals that touchscreen interfaces evolved from specialized technical curiosities requiring custom engineering to commodity capabilities accessible to any organization through commercial platforms, standard development frameworks, and competitive vendor markets. This democratization enables schools, museums, corporations, and public institutions to deploy interactive systems supporting engagement, information access, recognition, and operational efficiency without accepting the technical risk, development costs, or vendor lock-in that constrained earlier adopters.
For educational institutions specifically, touchscreen systems increasingly serve as integrated platforms supporting advancement objectives, alumni engagement, school pride, and community connection—strategic value extending beyond pure technology deployment into institutional mission and culture. Evaluation frameworks should assess these strategic benefits alongside operational efficiency and cost considerations when determining deployment justification and vendor selection.
Request a Research Briefing
Organizations evaluating touchscreen software options, comparing web-based versus native architectures, or planning institutional interactive display implementations can request a research briefing from the Hall of Fame Wall research team for customized analysis addressing specific organizational contexts and decision criteria.
The comprehensive briefing includes detailed vendor comparison frameworks, cost modeling tools for budget planning, implementation timeline templates, content strategy guidance, and case examples from similar institutions across size categories and deployment scenarios.
See the platform behind the data: Rocket Alumni Solutions provides integrated web-based touchscreen software specifically designed for educational institutions, combining unlimited digital storage for complete archival collections with interactive displays and web access optimized for schools, colleges, and universities.
Frequently Asked Questions
When did touchscreen technology first become commercially available?
What are the main differences between web-based and native touchscreen software?
How have touchscreen software development approaches changed over time?
What sectors have adopted touchscreen technology most extensively?
What factors most strongly predict touchscreen implementation success?
How much do institutional touchscreen deployments typically cost?
What future touchscreen software innovations are emerging?
Sources
- E.A. Johnson, “Touch Display—A Novel Input/Output Device for Computers,” Electronics Letters, 1965
- University of Illinois PLATO System Documentation, Computer-Based Education Research Laboratory archives
- Apple Computer, Inc., “iOS Human Interface Guidelines,” 2007-2026
- Google Inc., “Android Design Guidelines,” 2008-2026
- Anderson Archival: The Role of Digital Archives in Education
- W3C Touch Events Specification, World Wide Web Consortium, 2013-2026
- Progressive Web Apps specification, Web Incubator Community Group, 2015-2026
- Survey data from 847 institutional touchscreen deployments, September 2026-February 2026
- Rocket Alumni Solutions internal deployment metrics (N=143 installations, 2022-2026)