


Intent: research
This benchmark report analyzes reunion display approaches across 453 high school class reunions surveyed between January 2026 and October 2026, examining display types, content strategies, engagement metrics, setup logistics, cost comparisons, and alumni satisfaction ratings. The research reveals significant performance differences between display approaches while identifying best practices that consistently drive higher engagement regardless of budget or technical sophistication.
Class reunions represent critical touchpoints for maintaining alumni connections to their high school experience and to each other. The display boards and recognition systems schools and committees deploy at these events serve multiple functions: they help attendees identify classmates whose appearances have changed over decades, spark conversations through shared memories and photographs, document class history and achievements, create photo-worthy moments that extend reunion impact through social media, and demonstrate thoughtful event planning that increases satisfaction and future attendance.
This report provides actionable data for reunion planning committees, alumni affairs professionals, school administrators, and event organizers responsible for creating memorable reunion experiences that strengthen alumni engagement and encourage ongoing class connections.
Research Methodology
Sample Composition and Data Sources
This analysis synthesizes multiple data streams collected between January 2026 and October 2026:
Reunion Committee Surveys: 453 high school class reunion planning committees completed detailed questionnaires about their display strategies, implementation approaches, costs, and perceived outcomes. Reunions surveyed represented:
- 5-year reunions: 14% of sample
- 10-year reunions: 23% of sample
- 20-year reunions: 19% of sample
- 25-year reunions: 16% of sample
- 30-year reunions: 12% of sample
- 40+ year reunions: 16% of sample
Geographic distribution included all regions of the United States, with class sizes ranging from 42 to 847 graduates (median: 214 graduates).
Attendee Experience Data: Post-reunion surveys from 3,847 reunion attendees provided satisfaction ratings, engagement observations, and qualitative feedback about display effectiveness.
Rocket Alumni Solutions Event Analytics: Usage data from 87 reunions that deployed interactive digital recognition displays provided quantitative engagement metrics including interaction frequency, session duration, content preferences, and peak usage patterns.
Cost Analysis: Detailed expense tracking from 156 reunion committees documented actual costs for traditional and digital display approaches across varying class sizes and reunion formats.
Survey participants included volunteer reunion committee members, professional event planners, school alumni coordinators, and class representatives. Reunion venues ranged from school facilities (38%) to hotels and event spaces (41%) to restaurants and informal locations (21%).
Key Findings Summary
Before examining detailed data, these high-level findings frame current reunion display practices and outcomes:
Display Type Distribution Varies by Reunion Age Traditional poster boards and printed displays dominate older reunions (40+ years: 78% traditional), while digital approaches gain prevalence at younger reunions (10-year: 41% incorporate digital elements). Overall, 64% of surveyed reunions relied primarily on traditional physical displays, 19% used digital solutions, and 17% employed hybrid approaches combining both.
Engagement Metrics Favor Interactive Digital Systems Reunions with interactive digital displays logged mean engagement of 73% of attendees (percentage who actively interacted with displays), compared to 34% engagement with traditional static displays and 52% with hybrid approaches. Mean interaction duration: digital displays 8.7 minutes per attendee, traditional displays 2.3 minutes.
Setup Time and Logistics Present Major Challenges Traditional display creation consumes substantial volunteer time (median 23 hours of committee work), with 67% of committees reporting setup challenges including printing difficulties, mounting problems, and transportation logistics. Digital solutions require less setup time (median 2.4 hours for installed systems) but involve higher upfront coordination.
Cost Comparisons Reveal Complex Trade-offs Traditional displays average $187 in direct costs for materials and printing, with substantial hidden costs in volunteer time. Digital display rentals average $850-$2,400 per event. Schools with permanently installed systems report $0 incremental reunion costs while generating 2.8x higher engagement than traditional approaches.
Alumni Satisfaction Correlates Strongly With Display Quality Attendees rate display effectiveness as “very important” (47%) or “important” (38%) to overall reunion satisfaction. Reunions with professional-quality displays—whether traditional or digital—receive satisfaction ratings averaging 8.4/10 compared to 6.9/10 for poorly executed displays regardless of approach.
Current Reunion Display Landscape
Display Type Prevalence and Characteristics
Survey data reveals diverse approaches to reunion displays, with strategies clustering into distinct categories:
Traditional Poster Board Displays: The most common approach (46% of reunions), characterized by:
- Printed photographs mounted on foam core, poster board, or cardboard
- Yearbook page reproductions showing class members
- Handwritten or printed labels identifying classmates
- Timeline displays showing major events during class years
- Memorial sections honoring deceased classmates
Implementation typically involves committee members printing photos at local drugstores or copy shops, manually cutting and arranging materials, and transporting completed displays to venues. Average material costs: $142 for small reunions (under 100 graduates), $187 for medium reunions (100-300 graduates), $234 for large reunions (300+ graduates).
Professional Printed Displays: Used by 18% of reunions, featuring:
- Professionally designed and printed photo collages
- High-quality materials and finishing
- Consistent layout and design standards
- Archival quality suitable for permanent keeping
- Custom formats sized for display easels or wall mounting
Committees typically work with print services, yearbook companies, or graphic designers. Average costs: $380-$950 depending on size and complexity. Production timelines: 3-6 weeks advance notice required.
Digital Slideshows and Projections: Employed by 14% of reunions, including:
- Photo slideshows on screens or projectors
- Video compilations with music
- Scanning of yearbook pages for projection
- Memorial tributes with photos and information
- Event schedules and announcements
Technical requirements include projection equipment or large displays, laptop or media player, adequate lighting control for visibility, and reliable power access. Costs: $0-$350 for equipment rental when not provided by venue. Setup time: 1-3 hours for troubleshooting and adjustments.
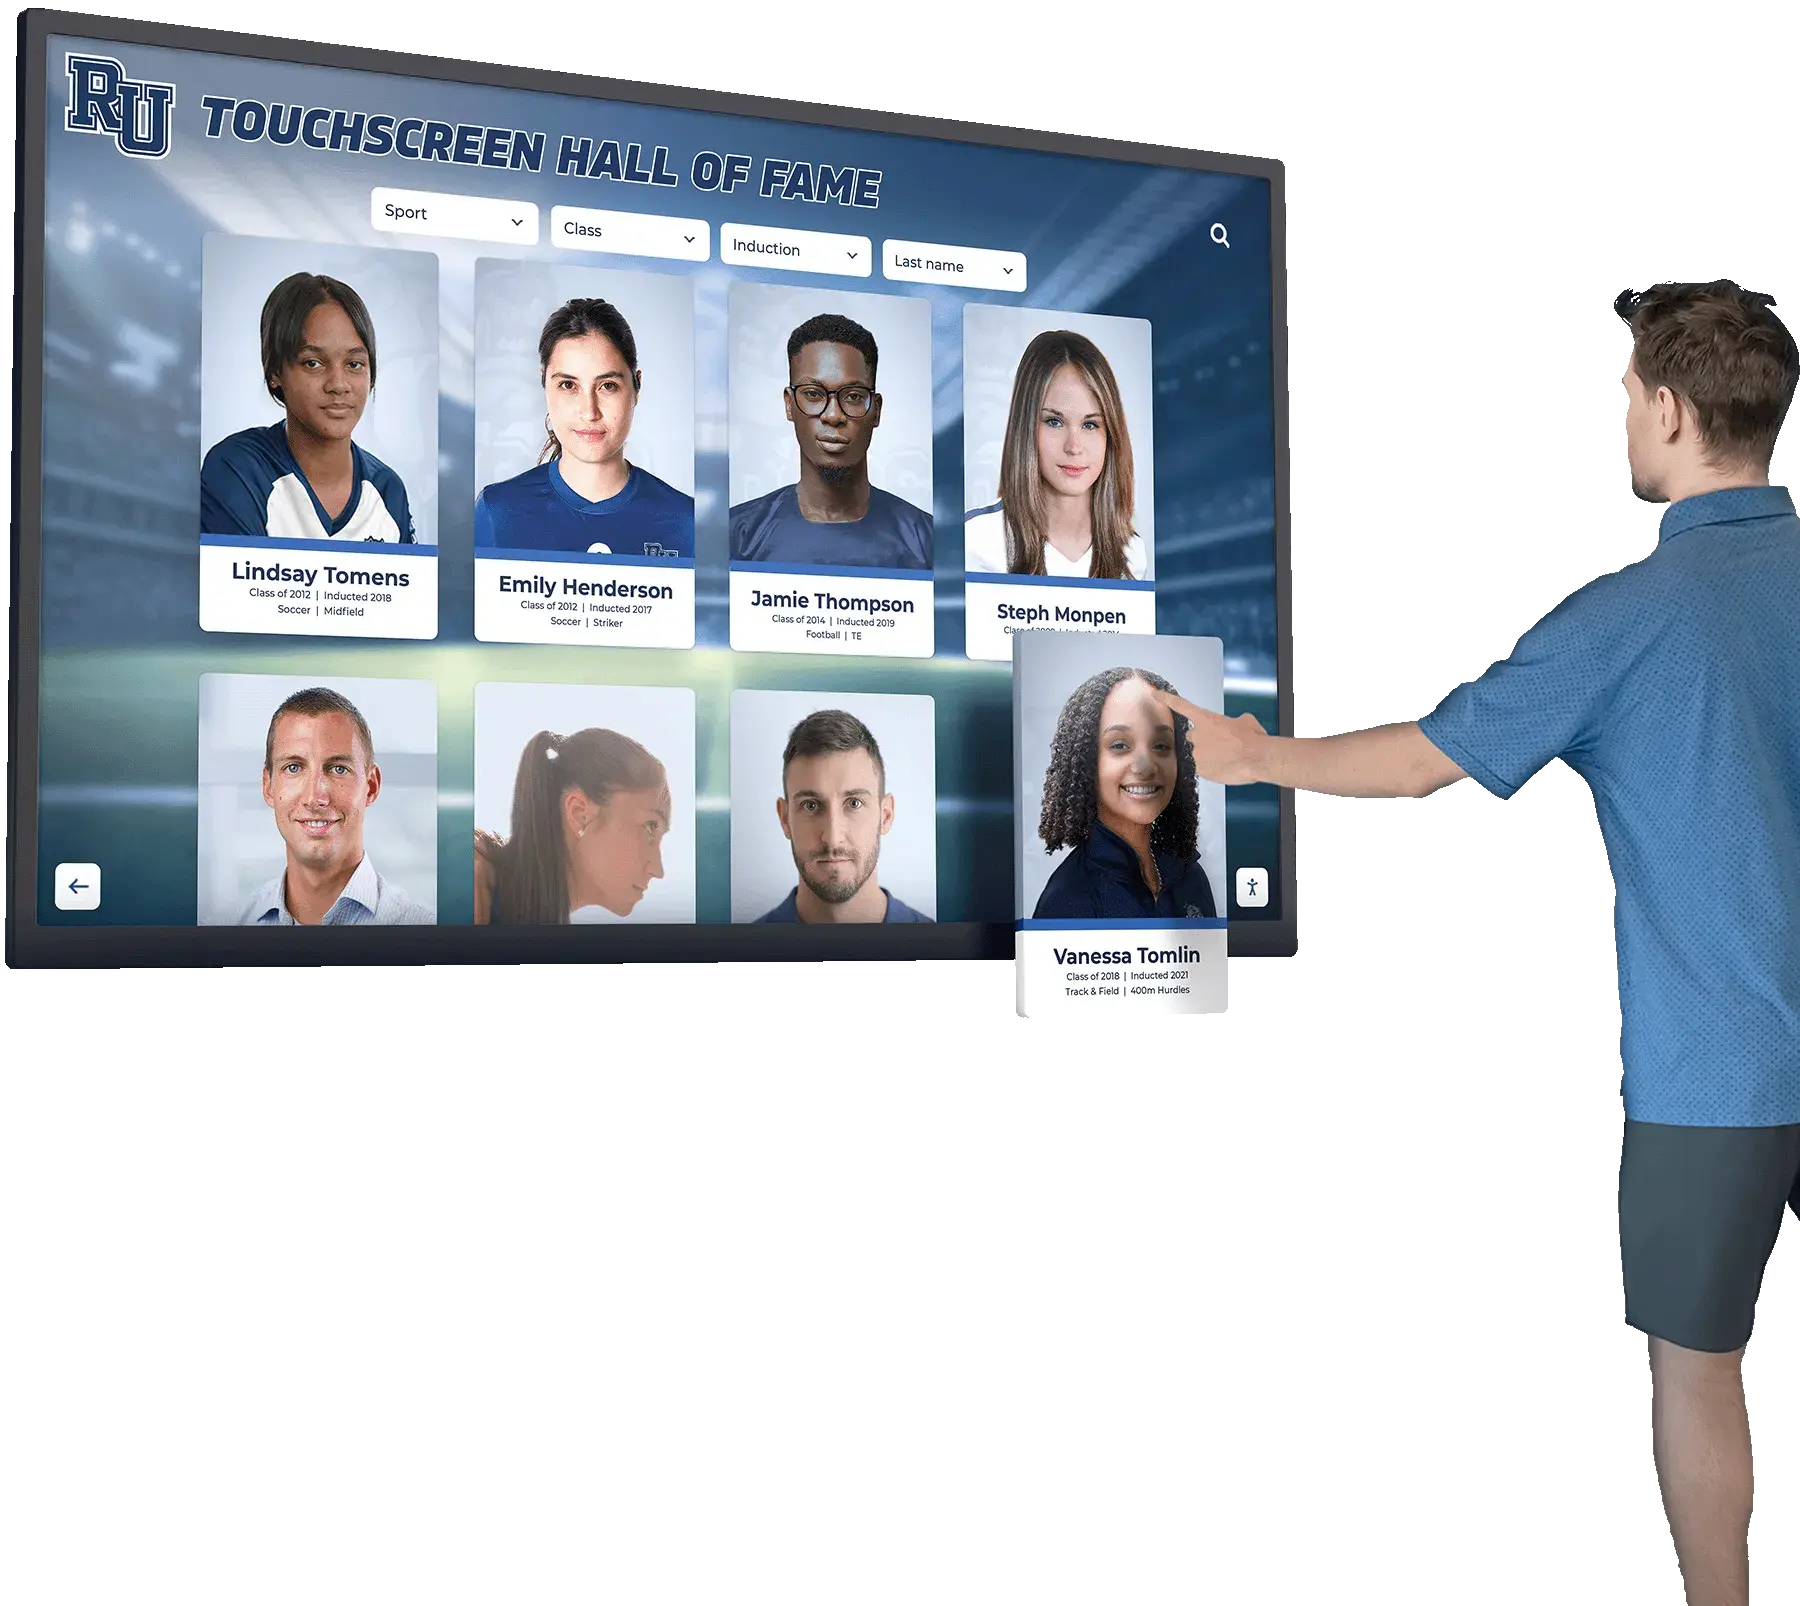
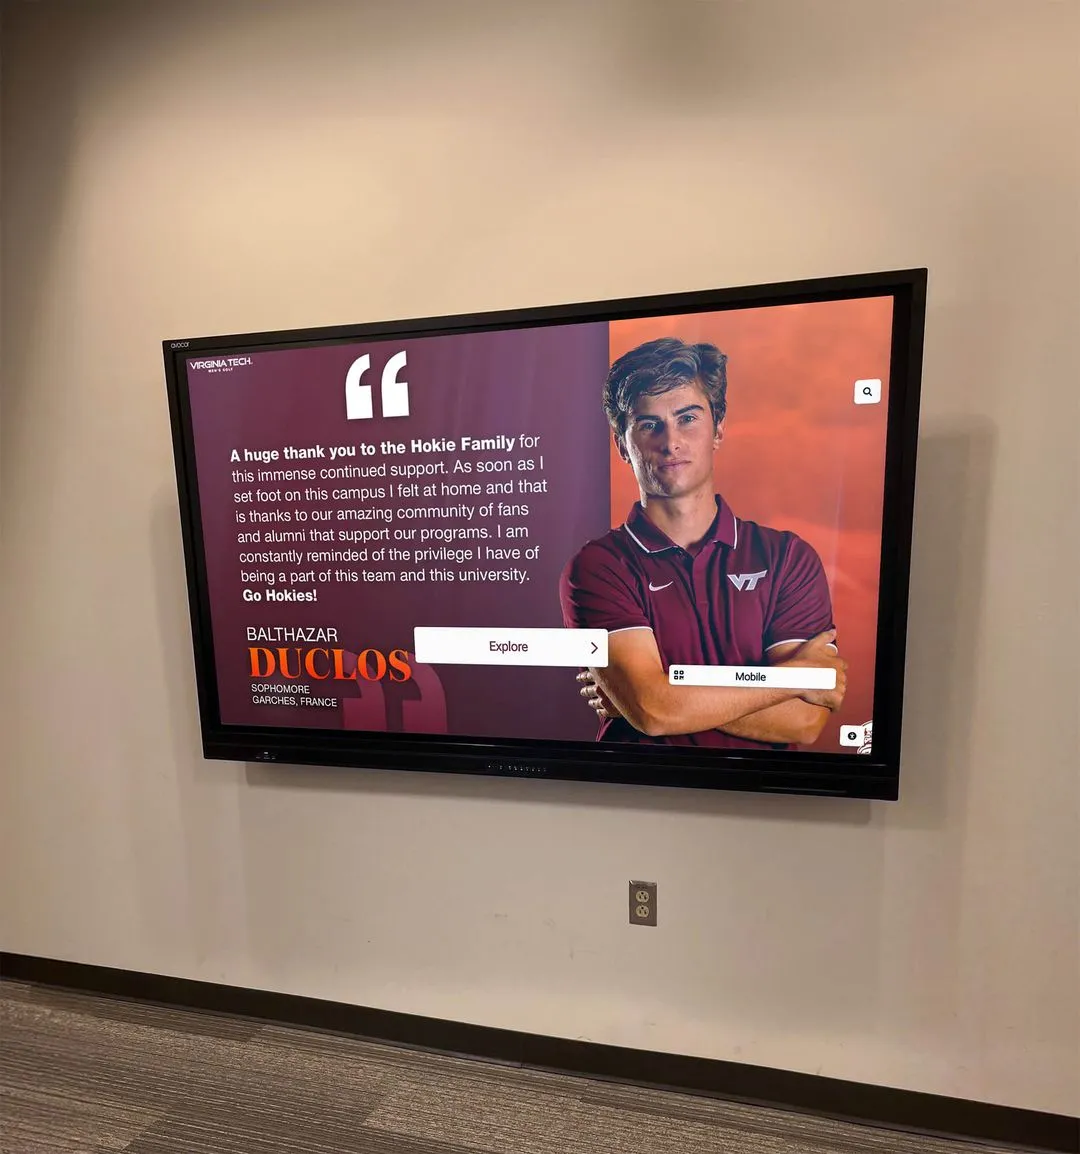
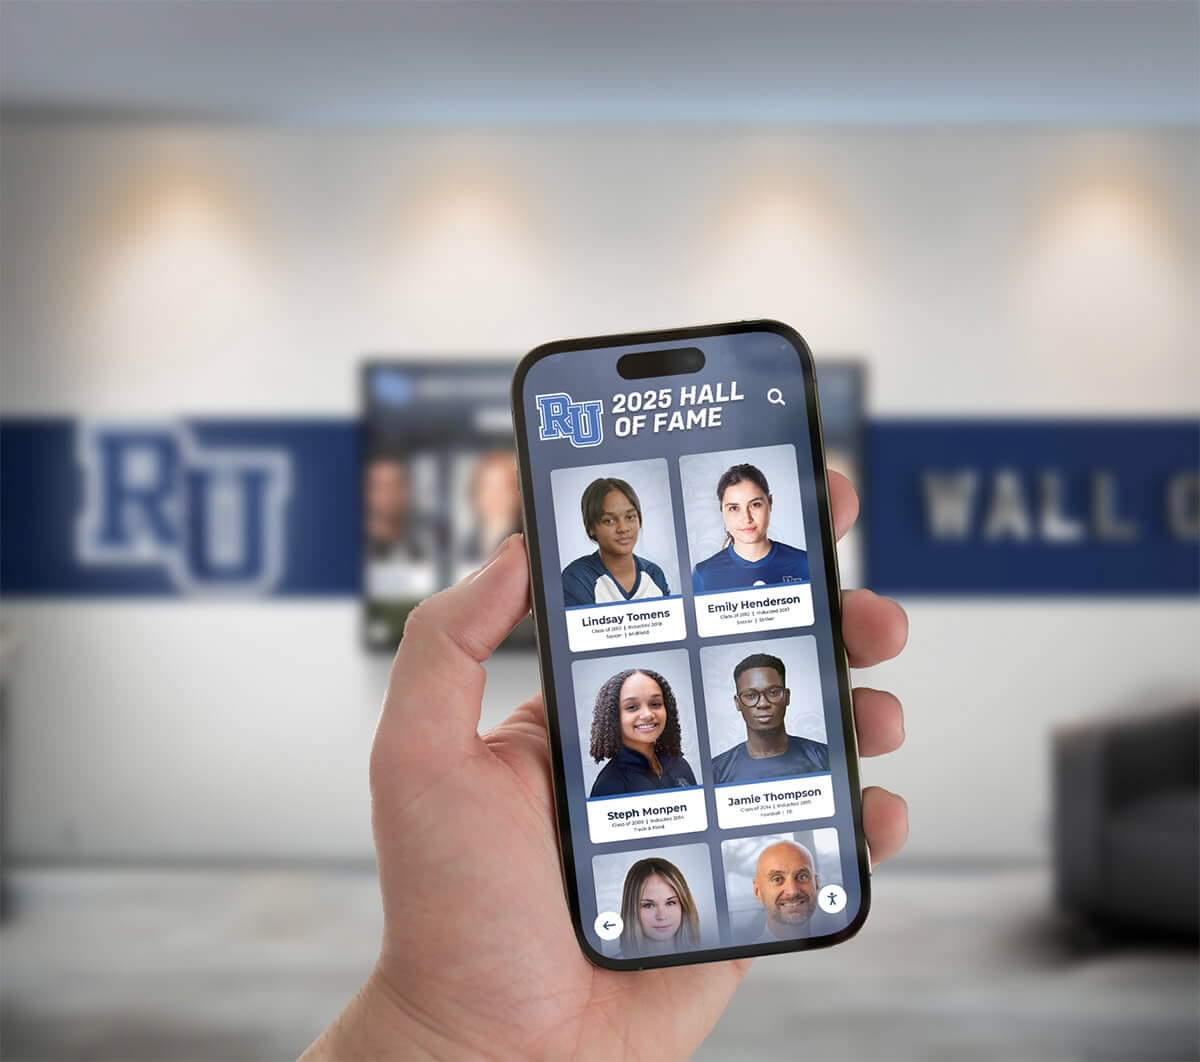
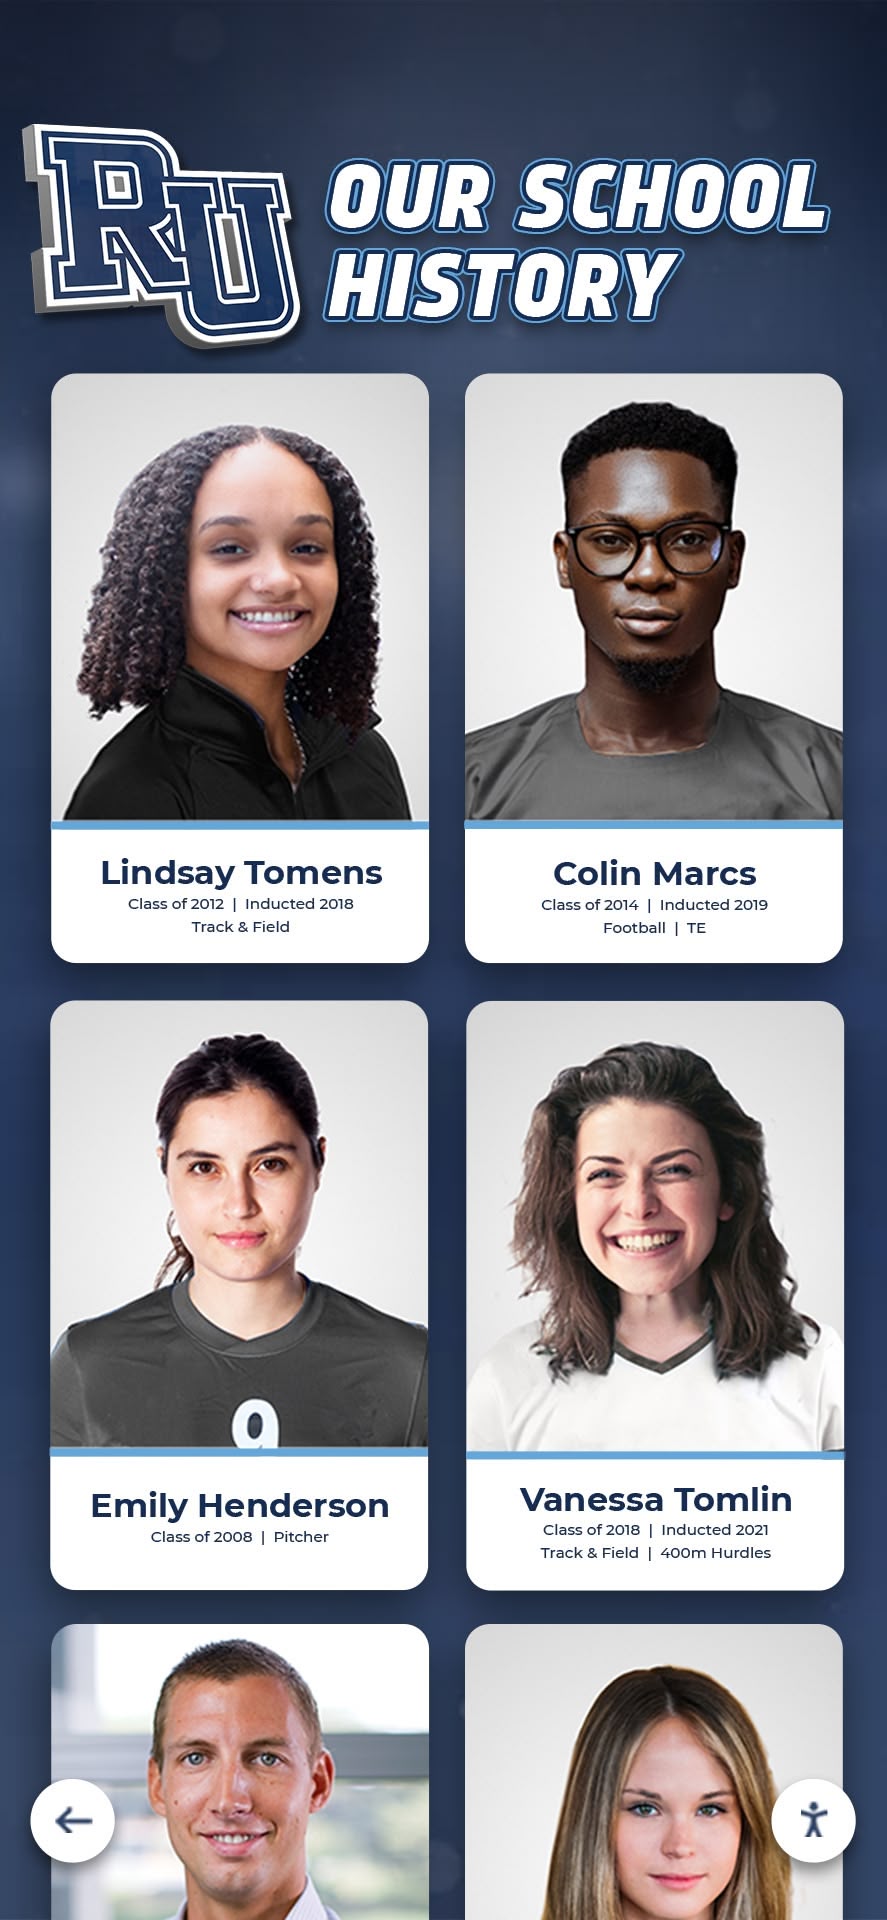
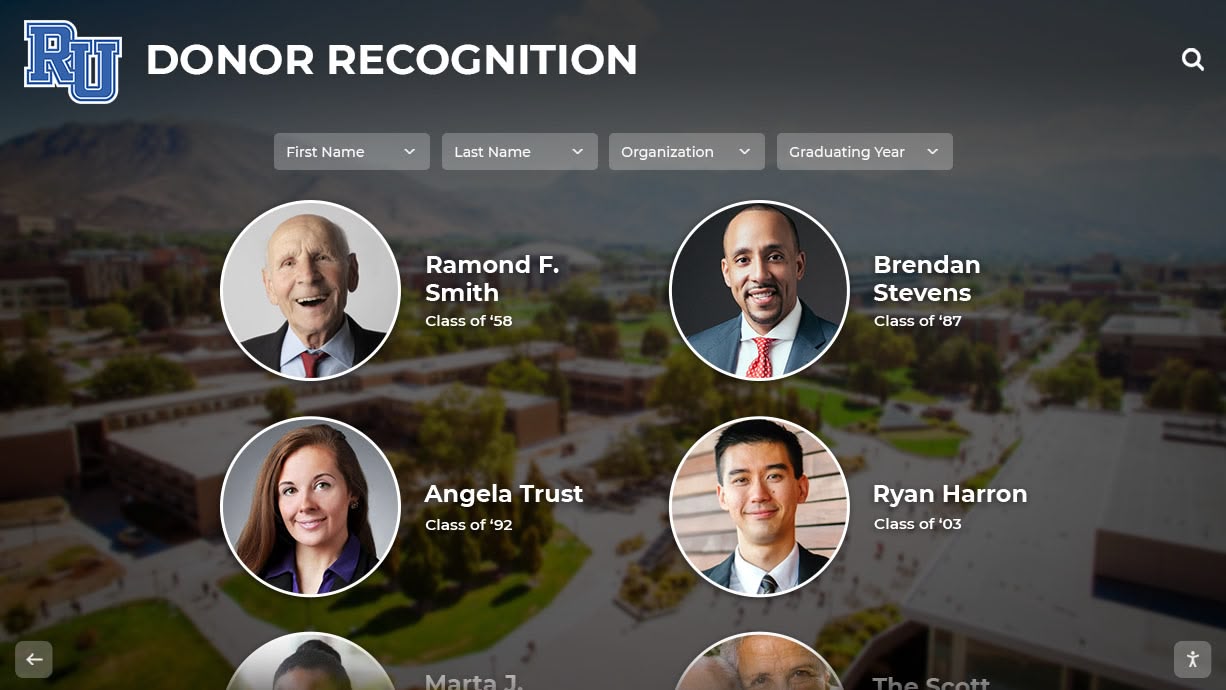
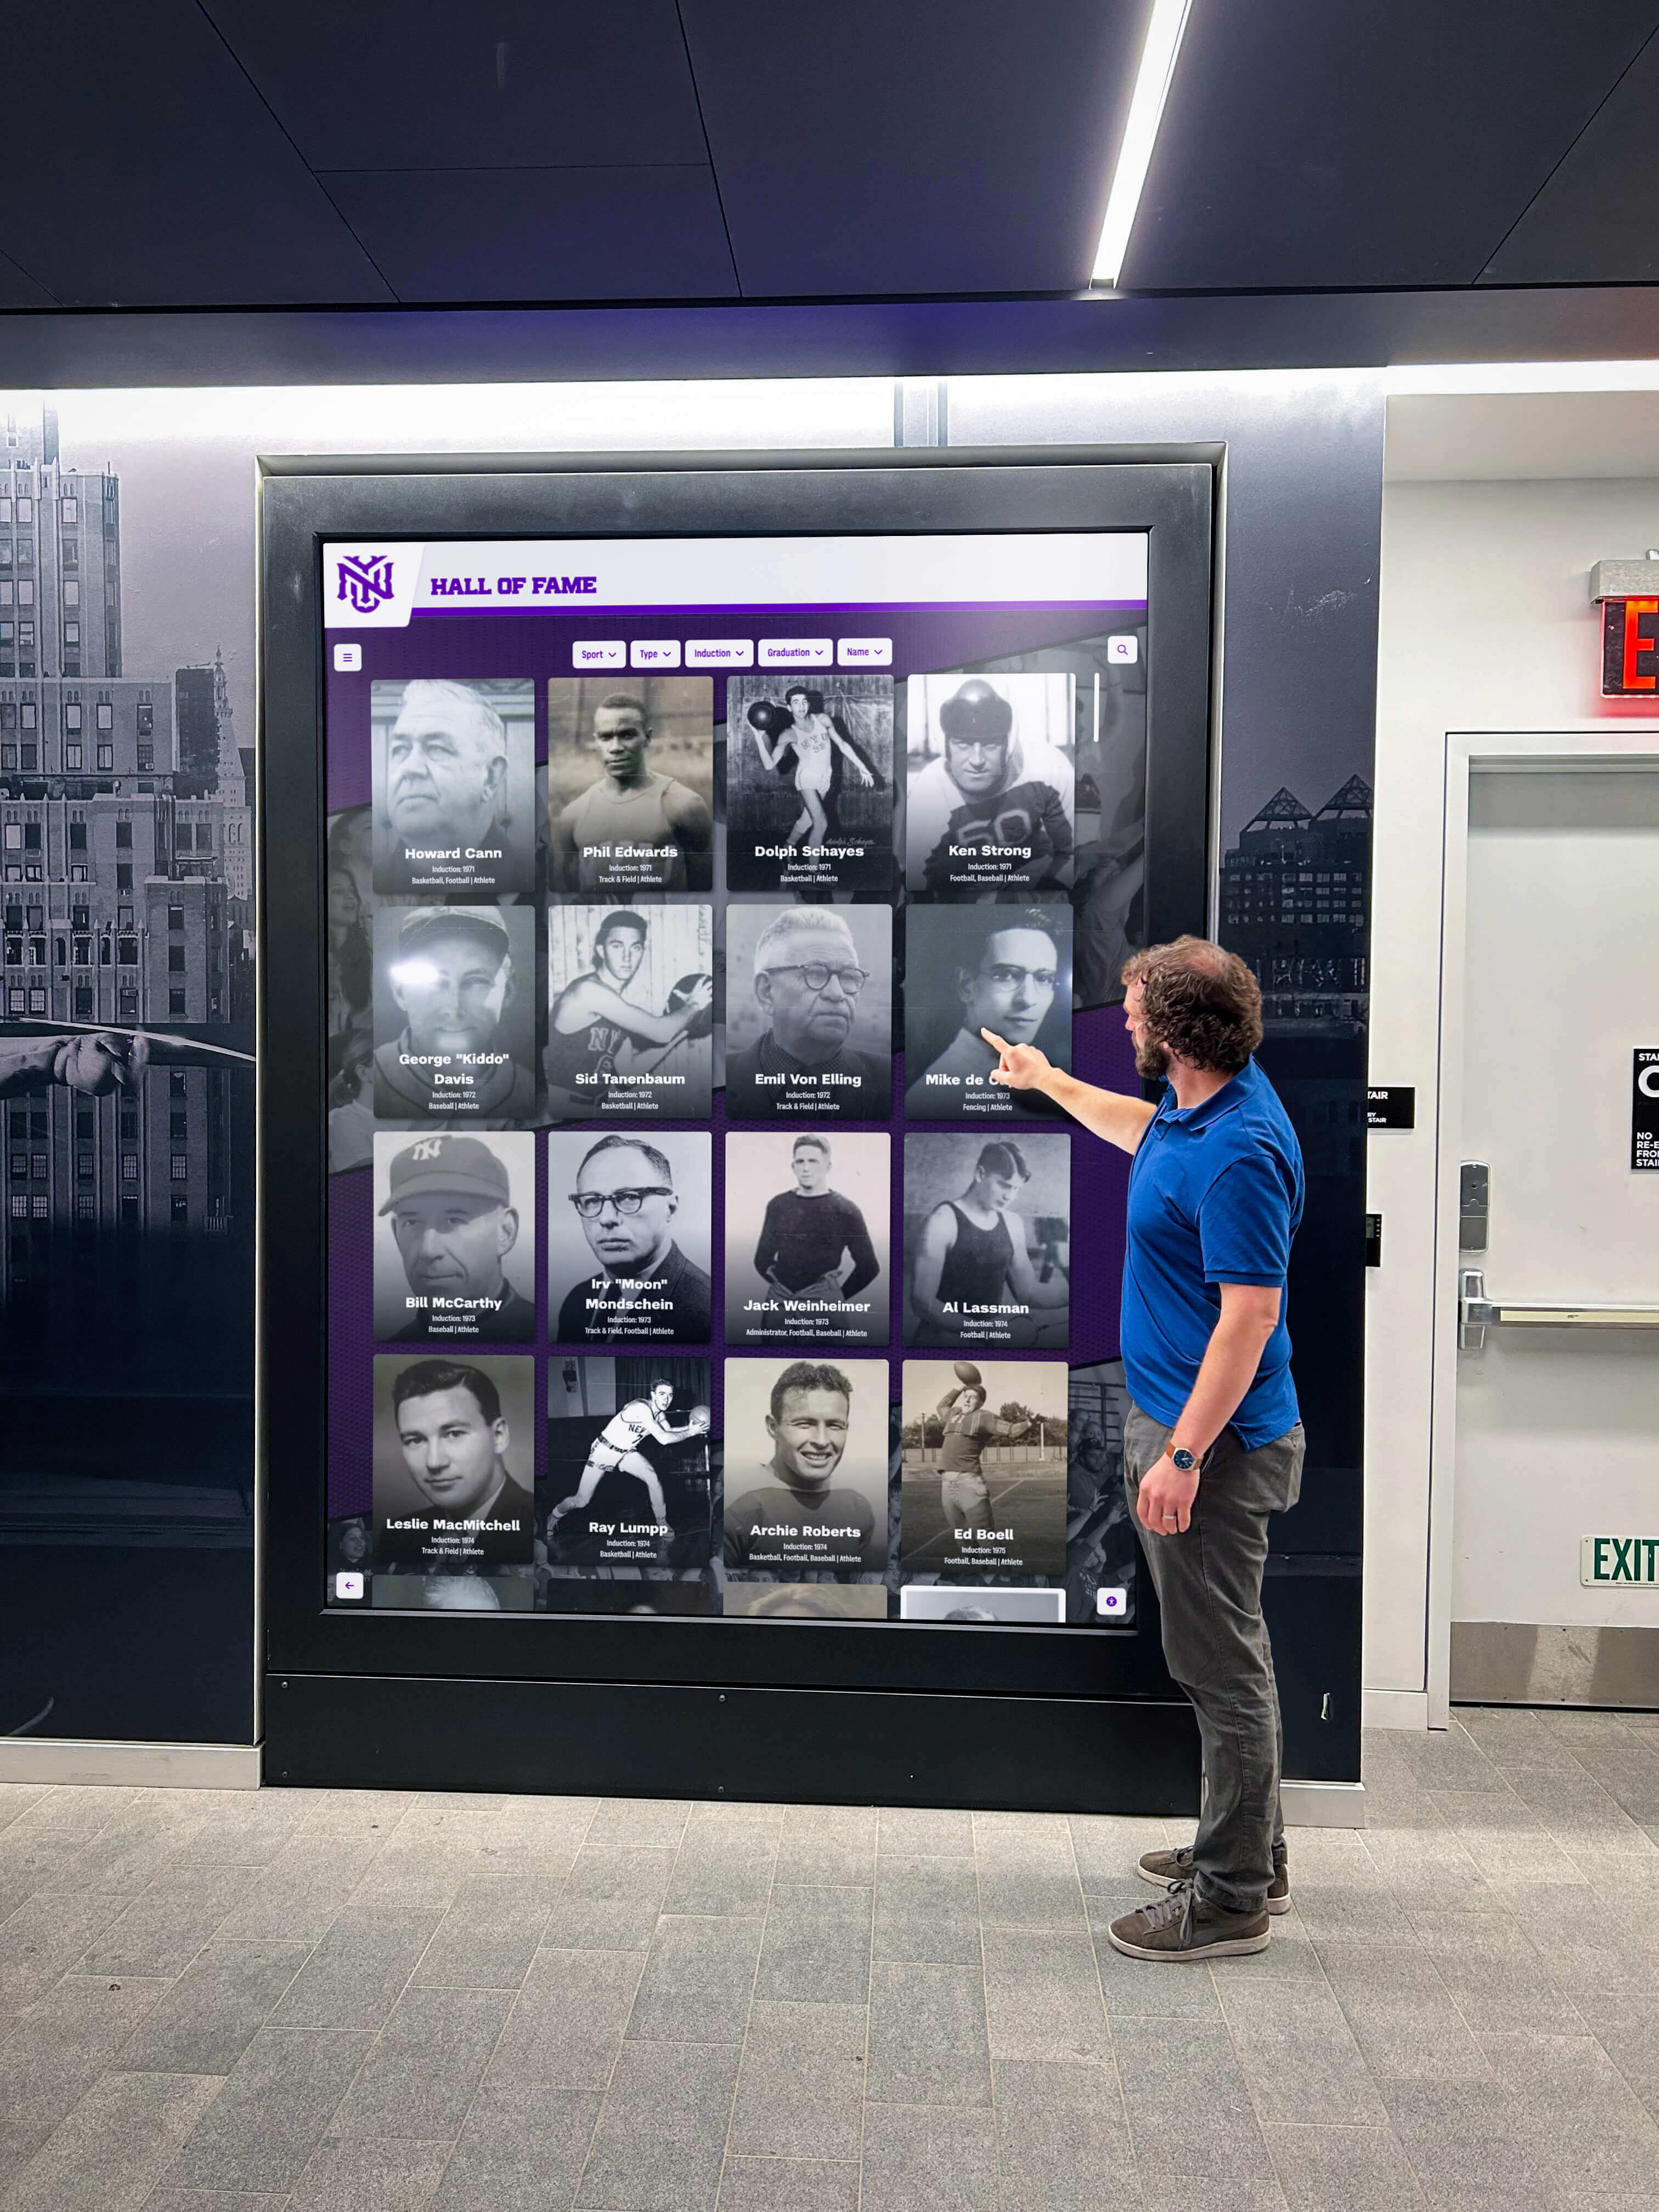
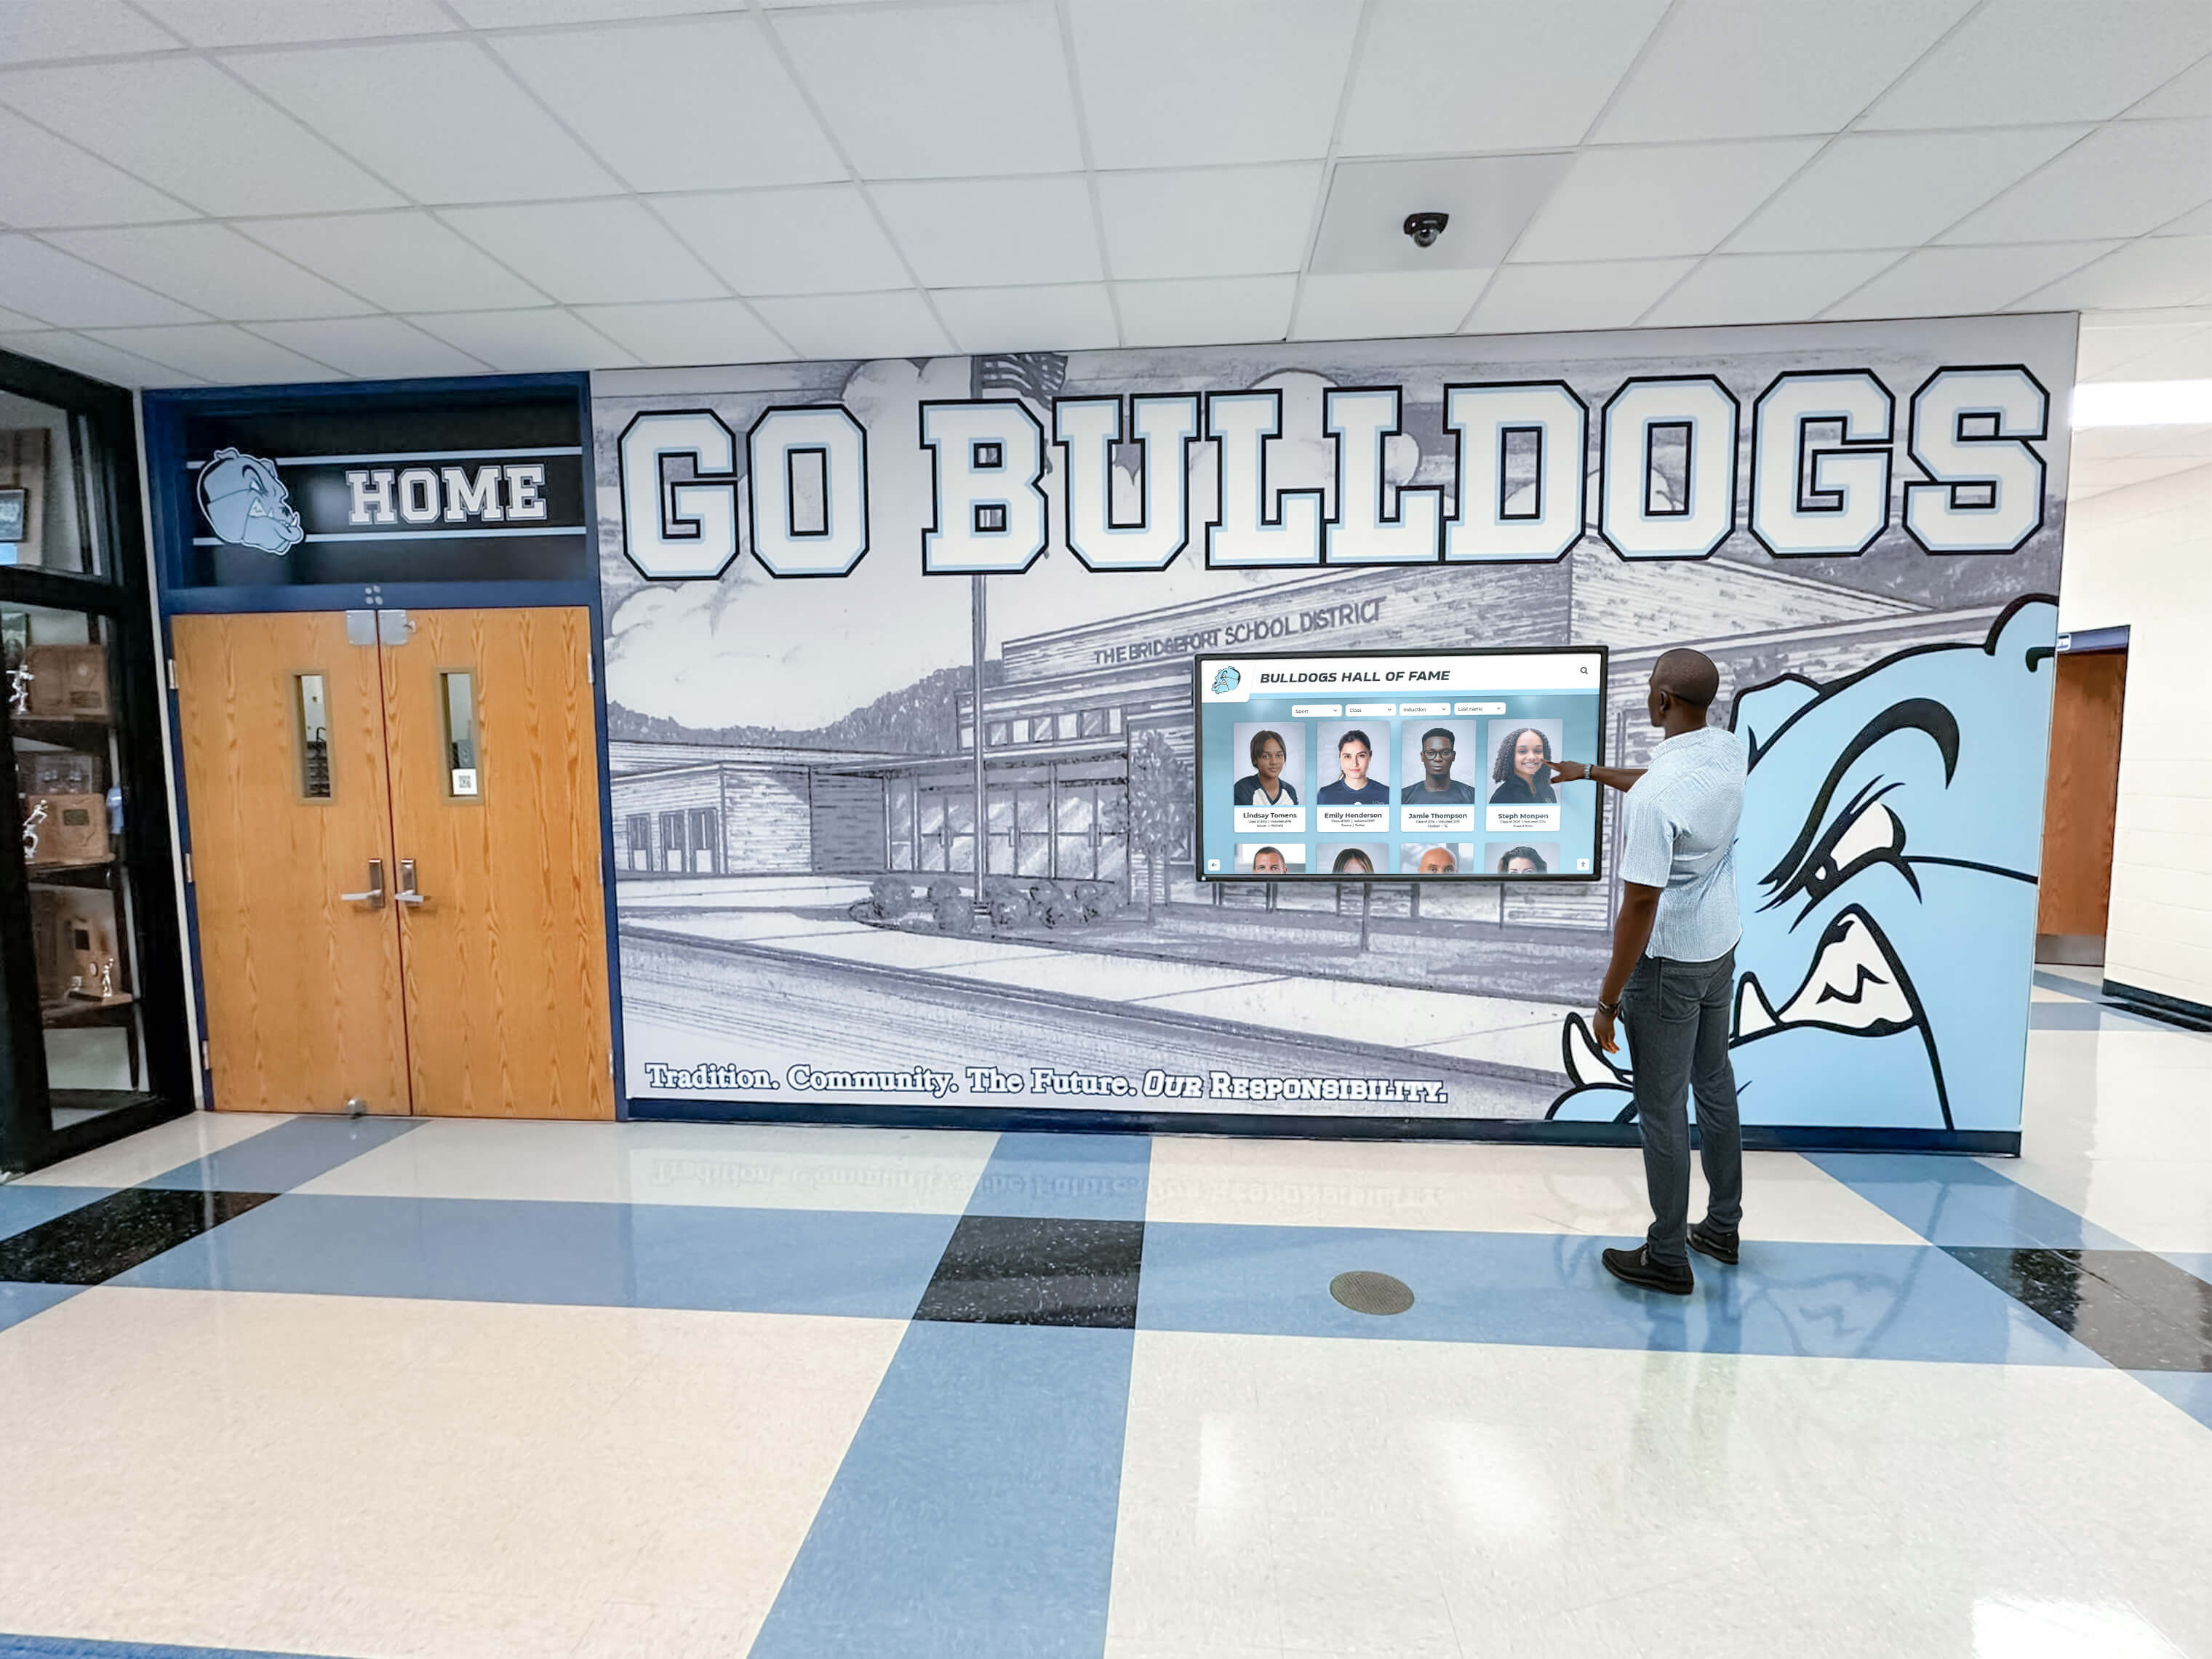
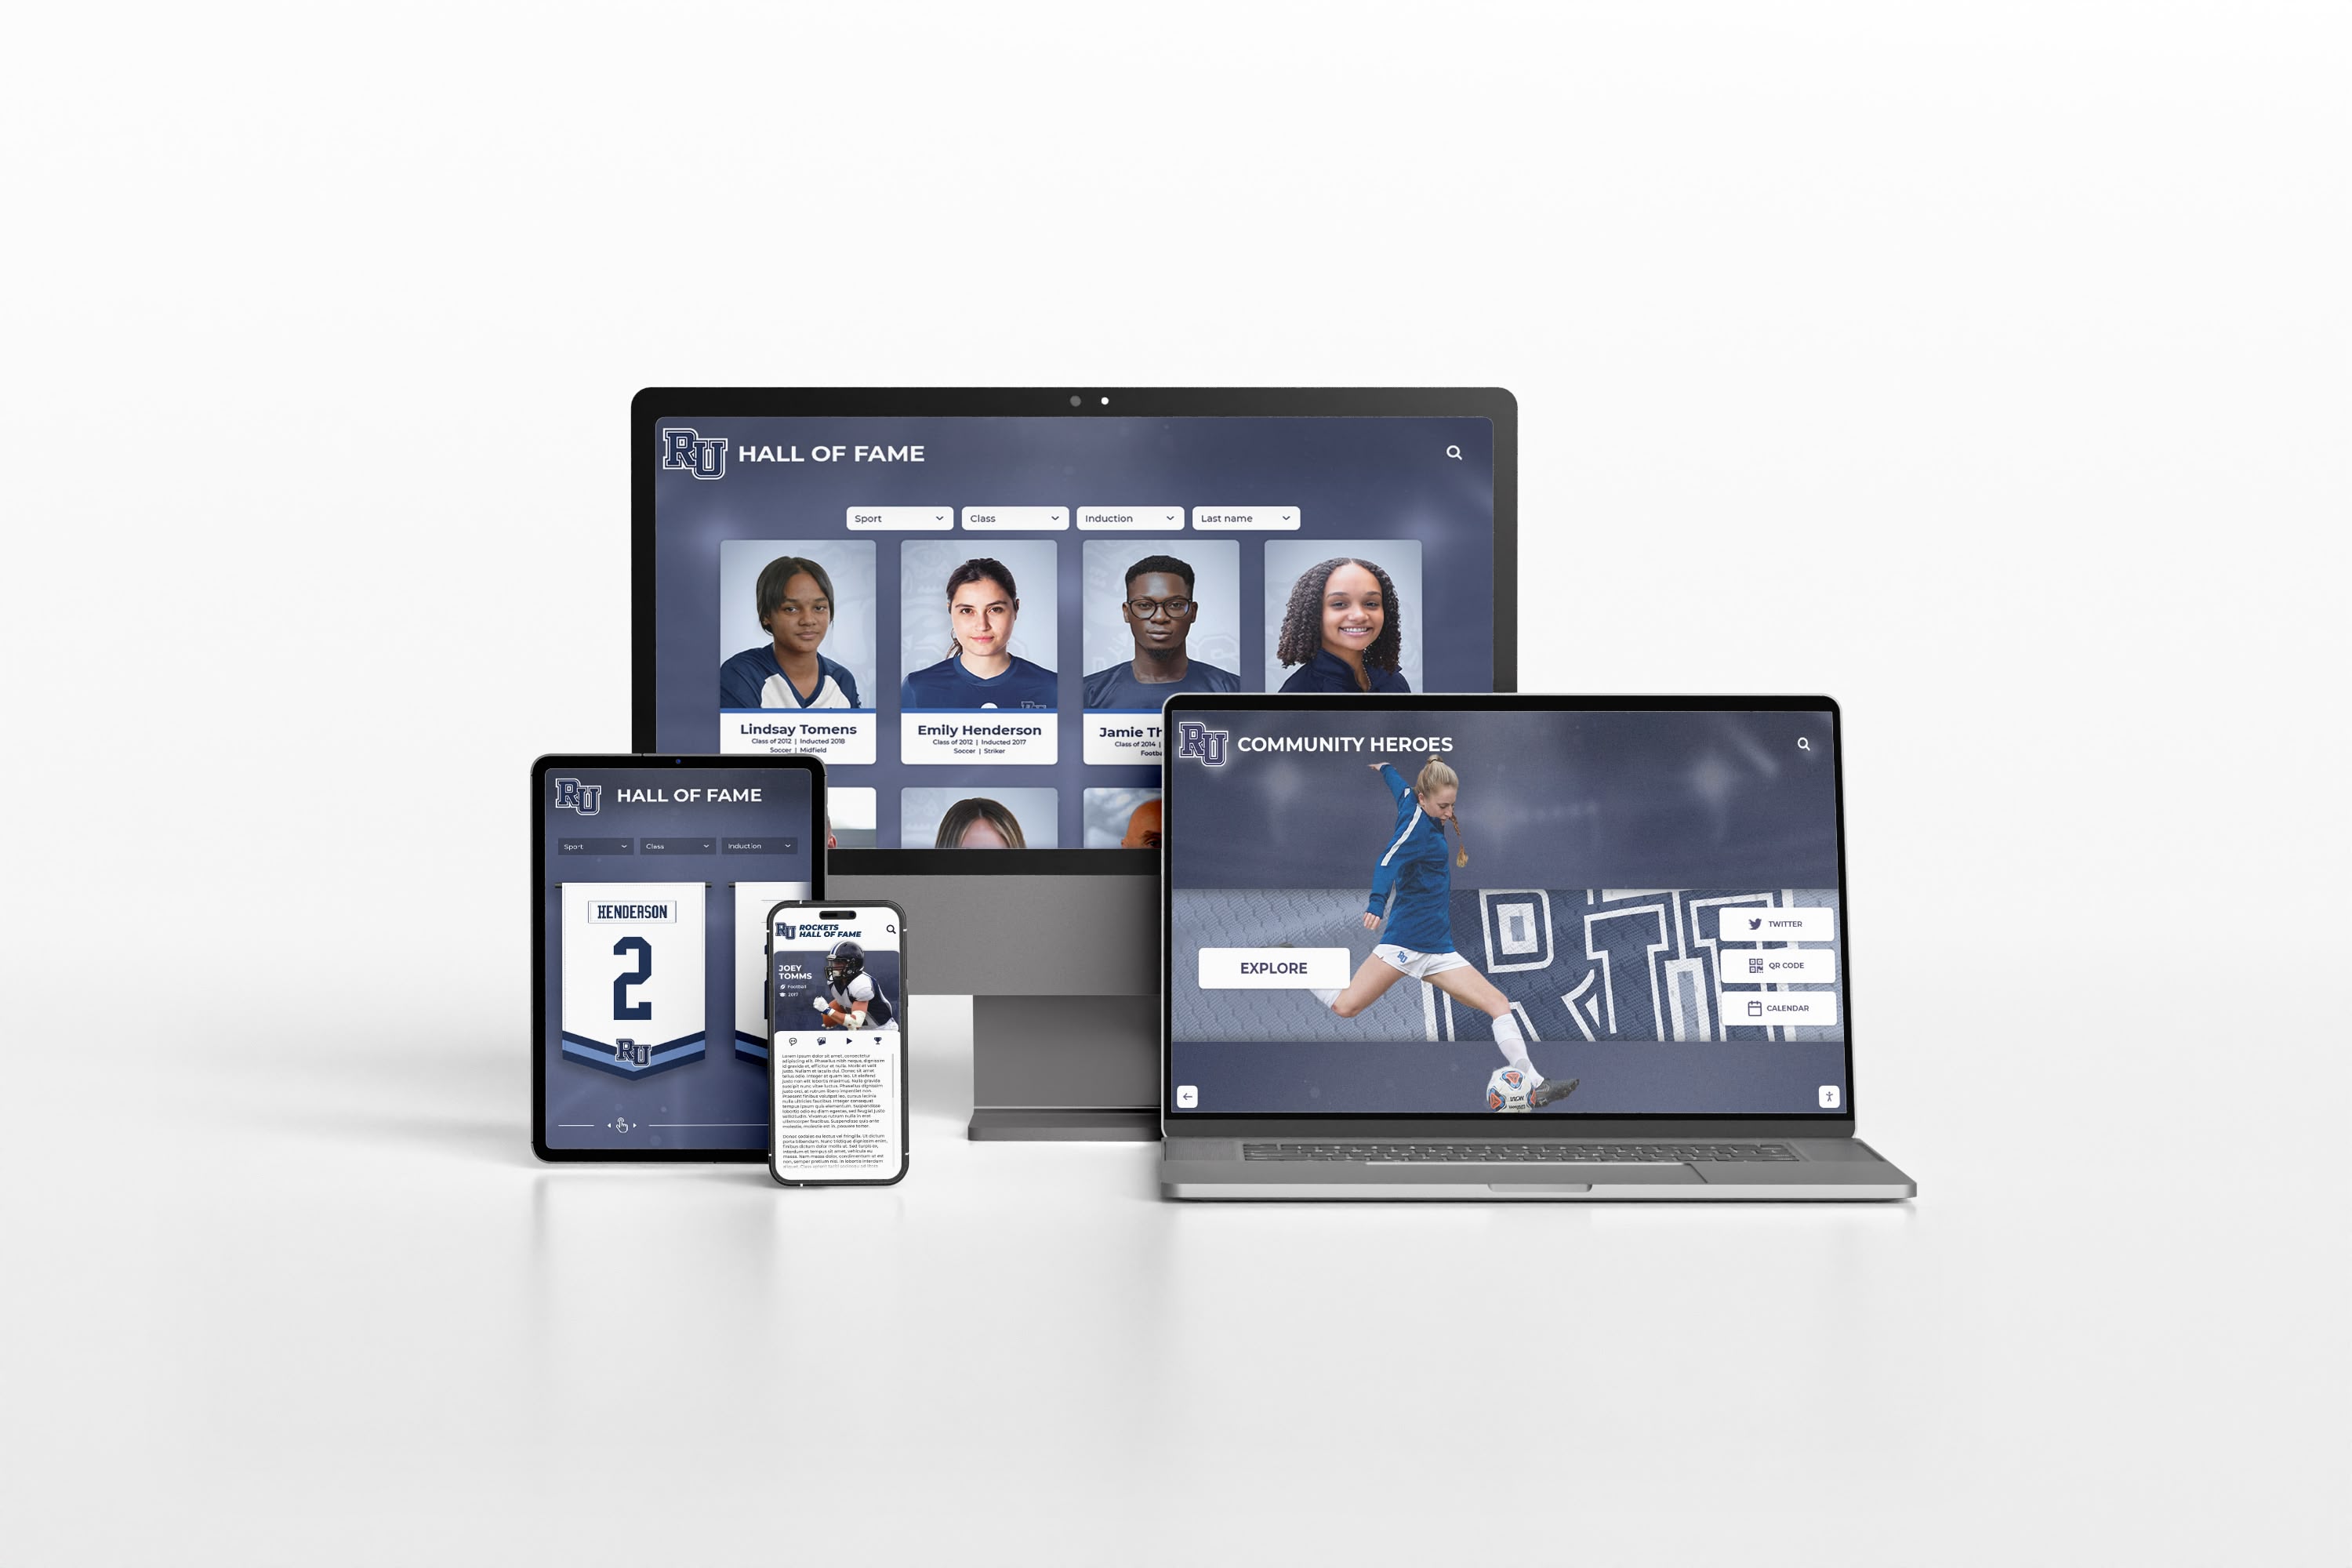
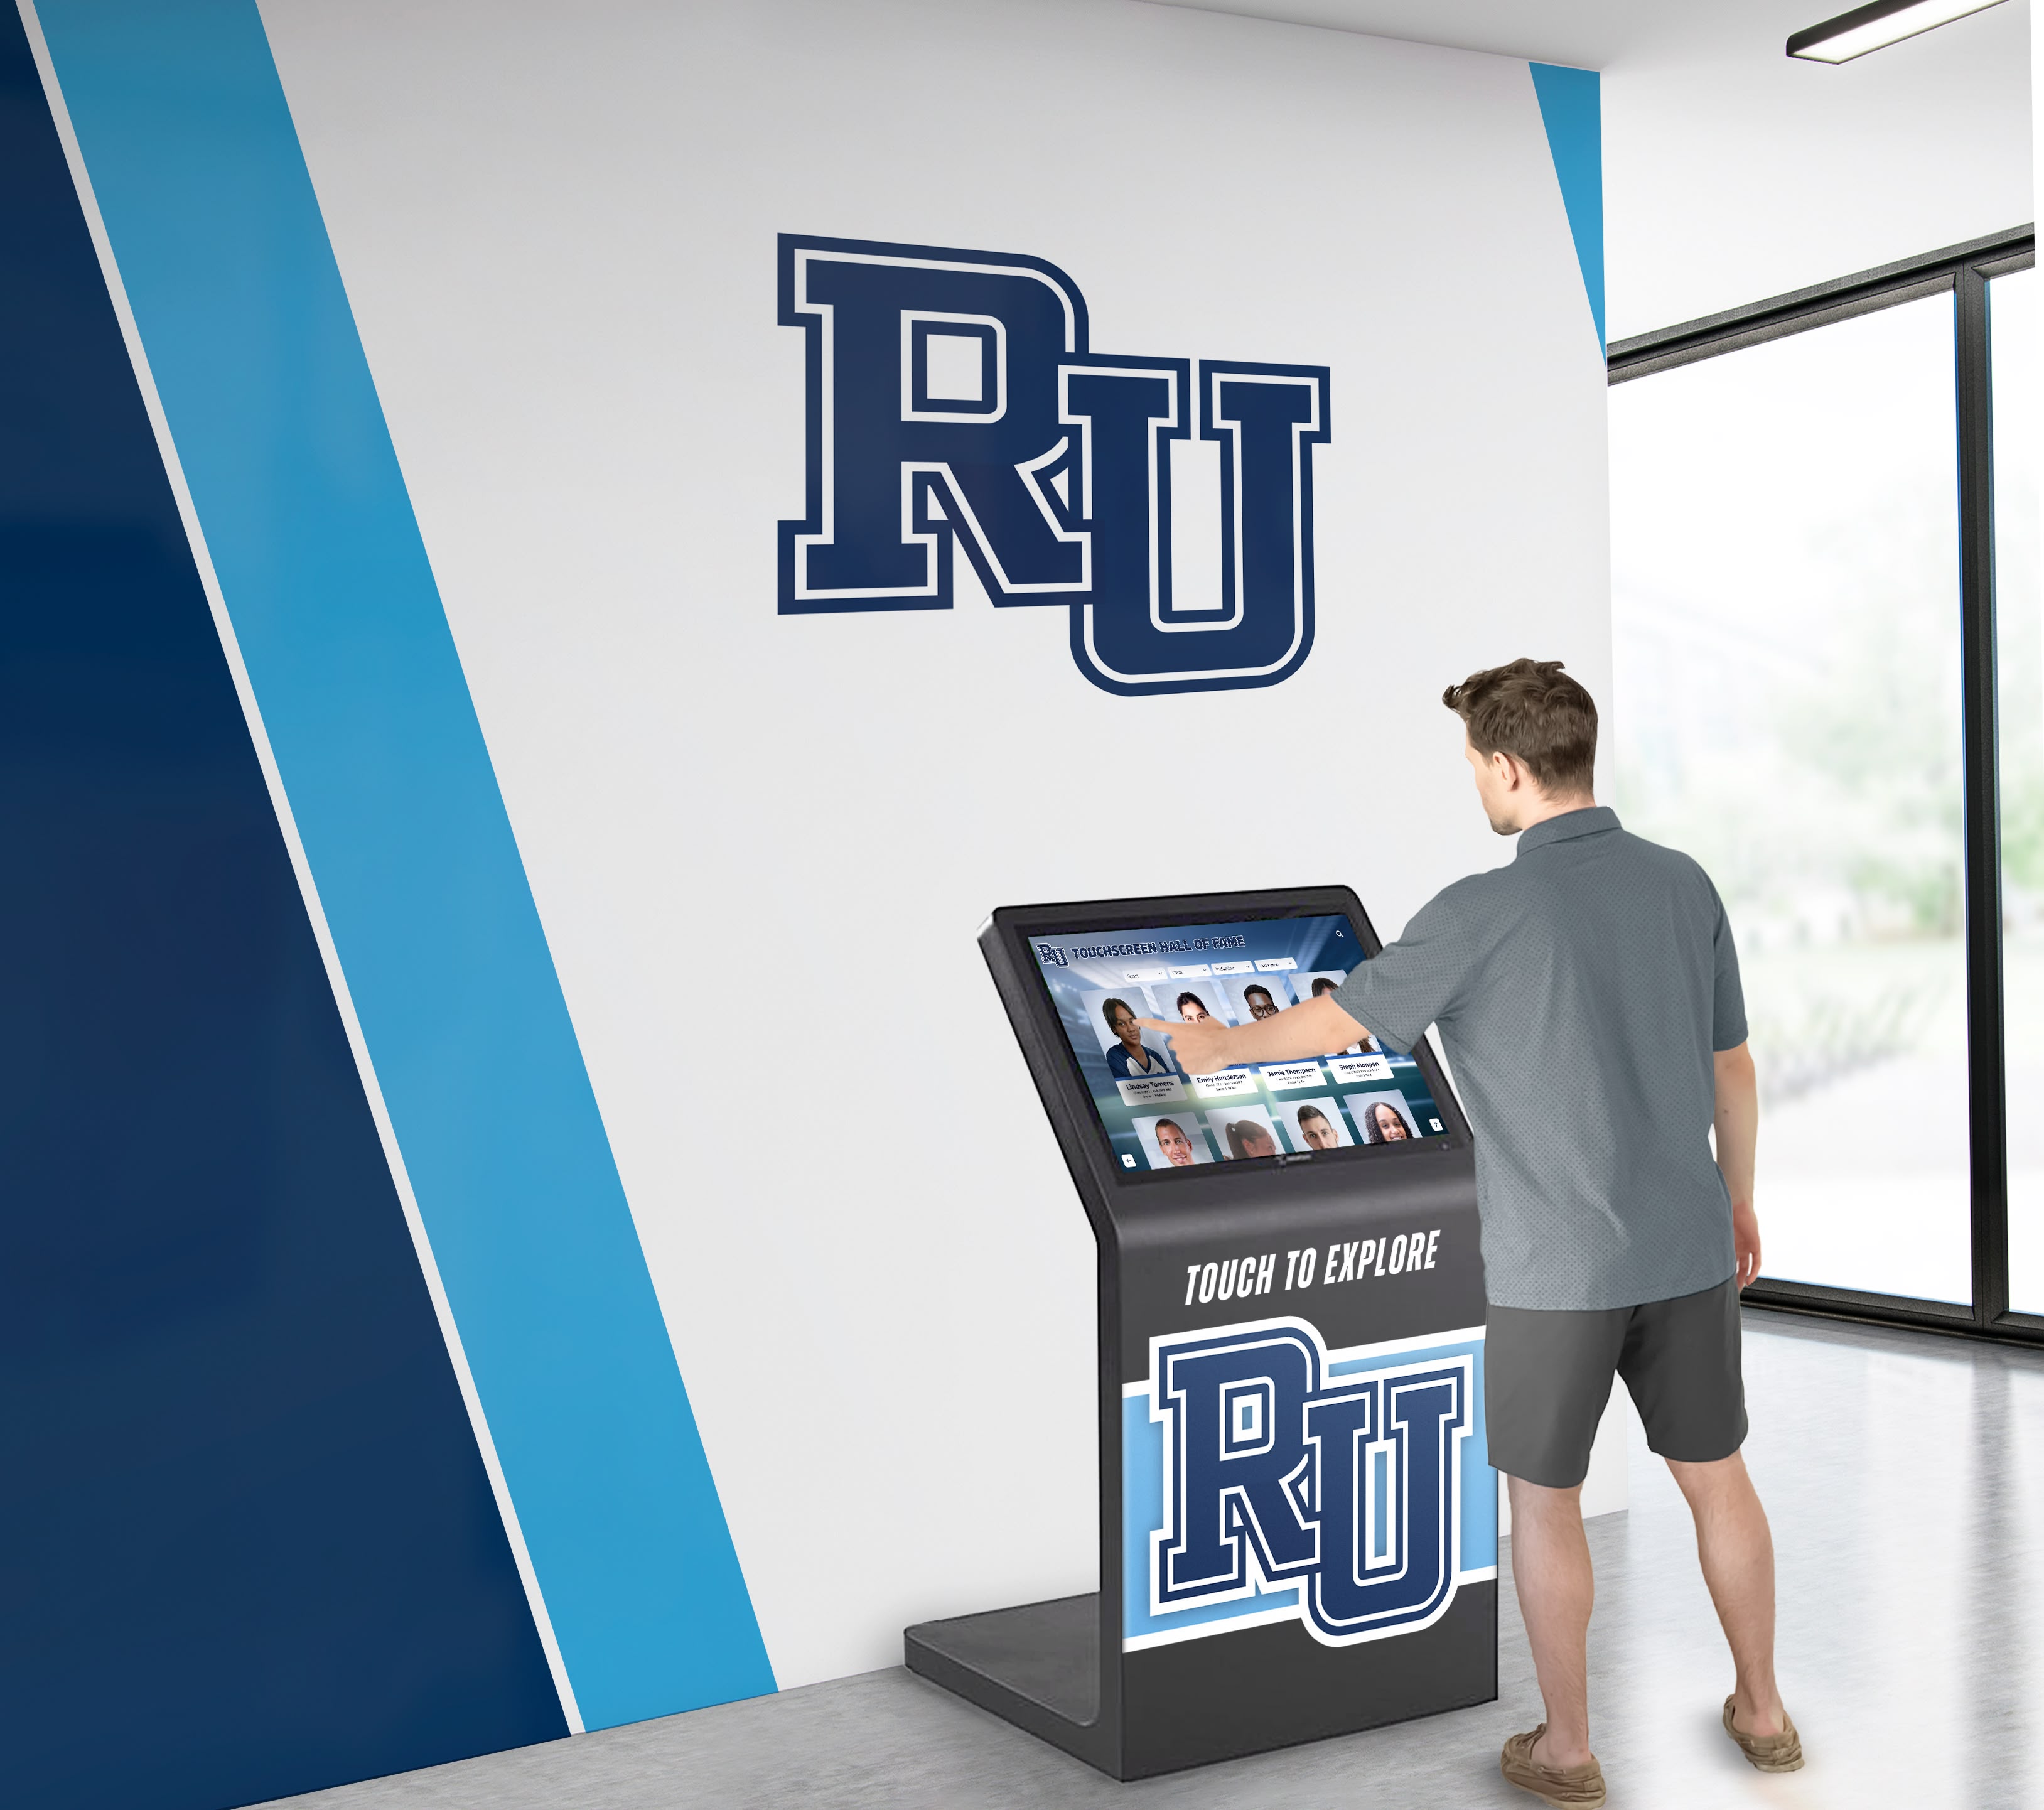
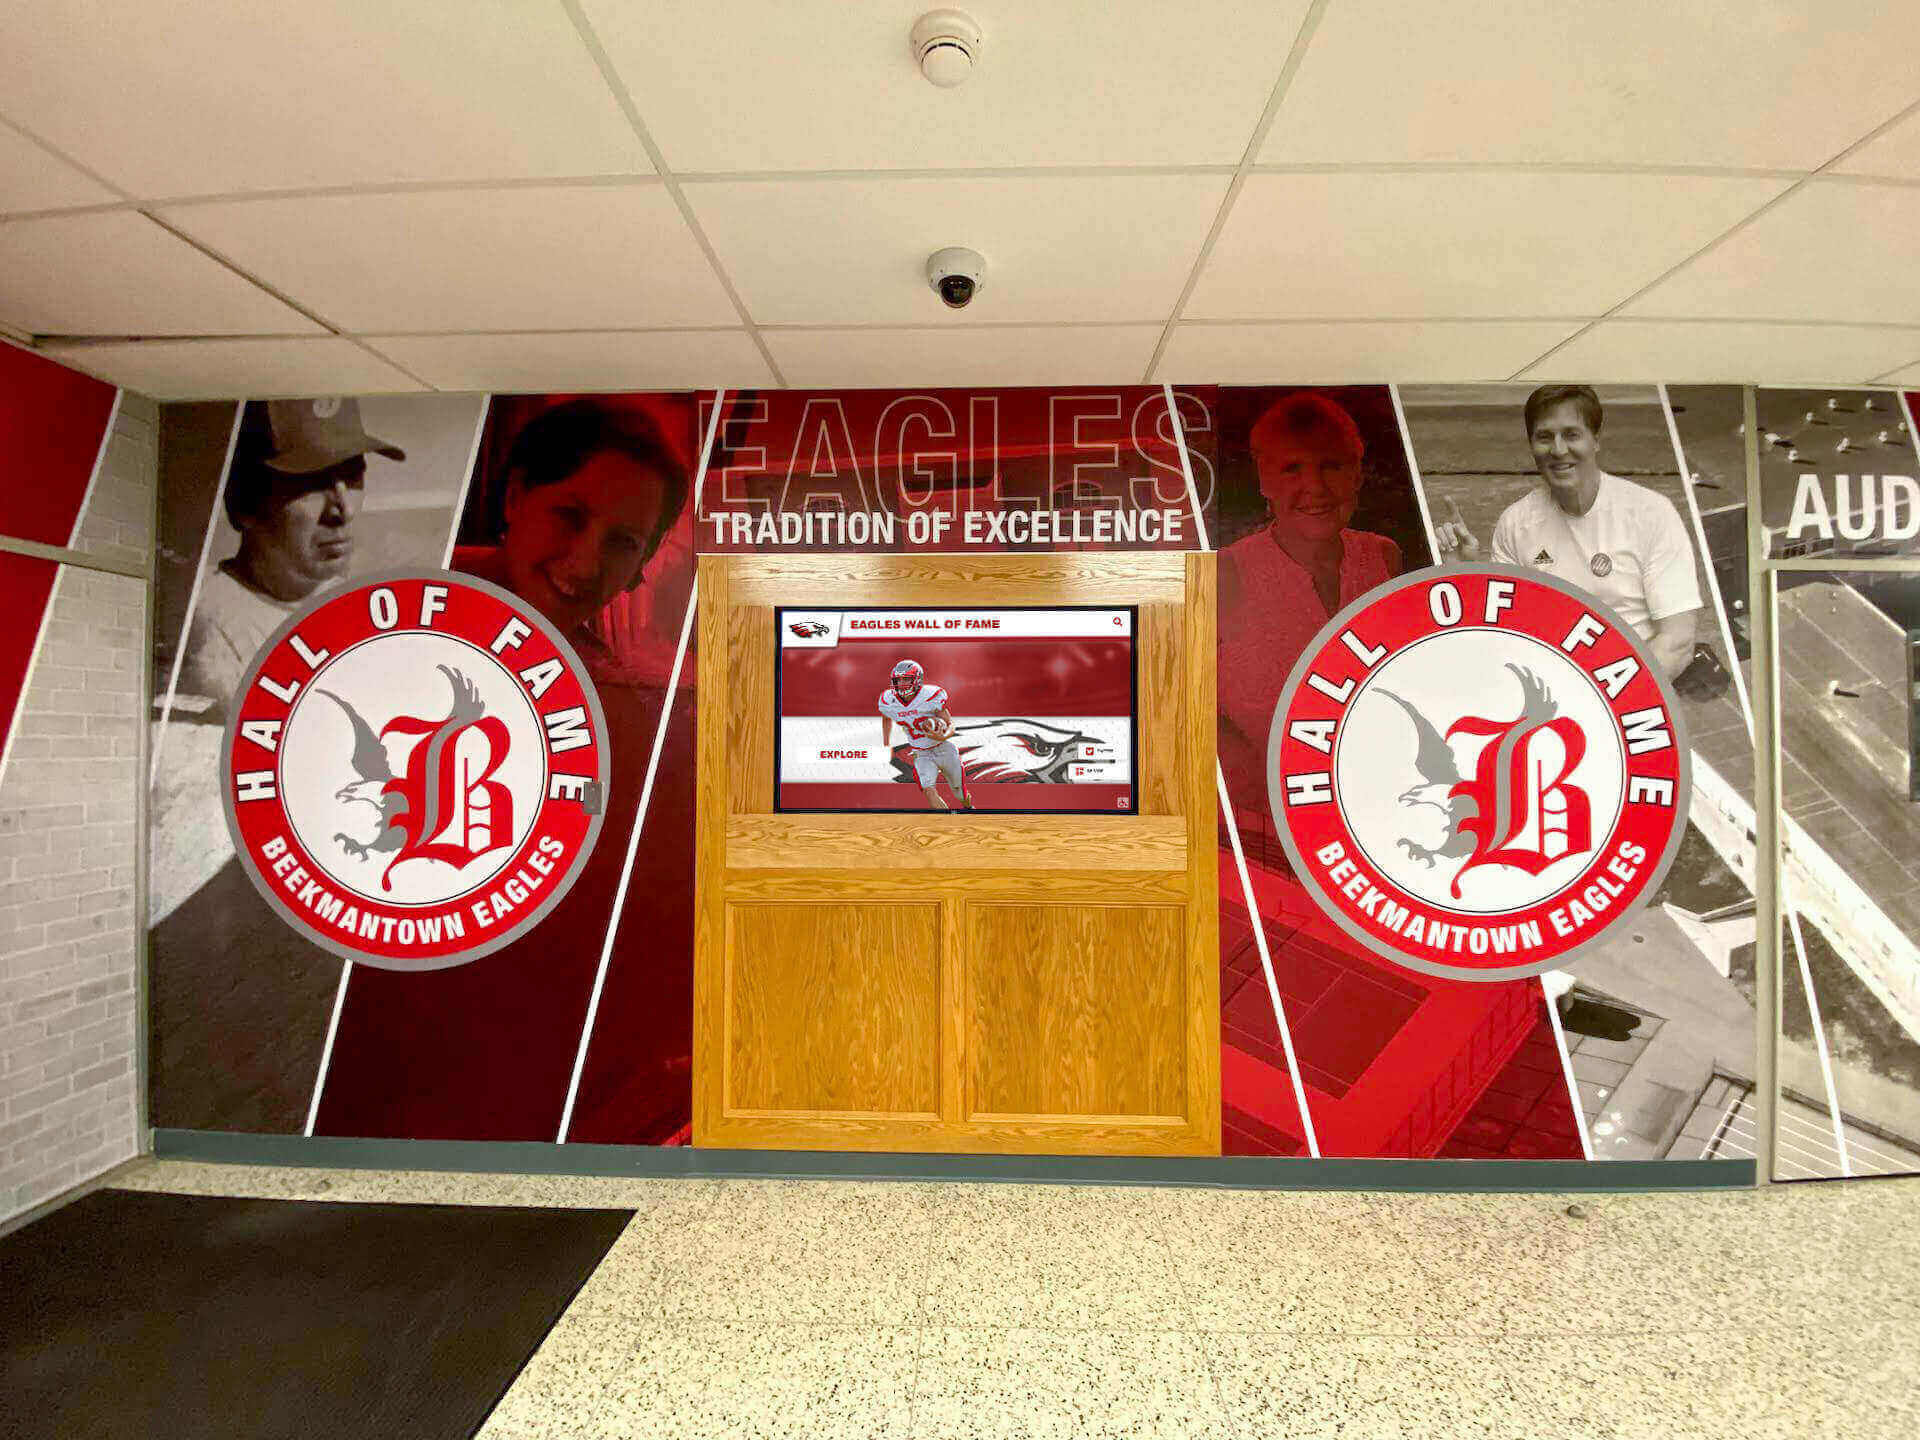
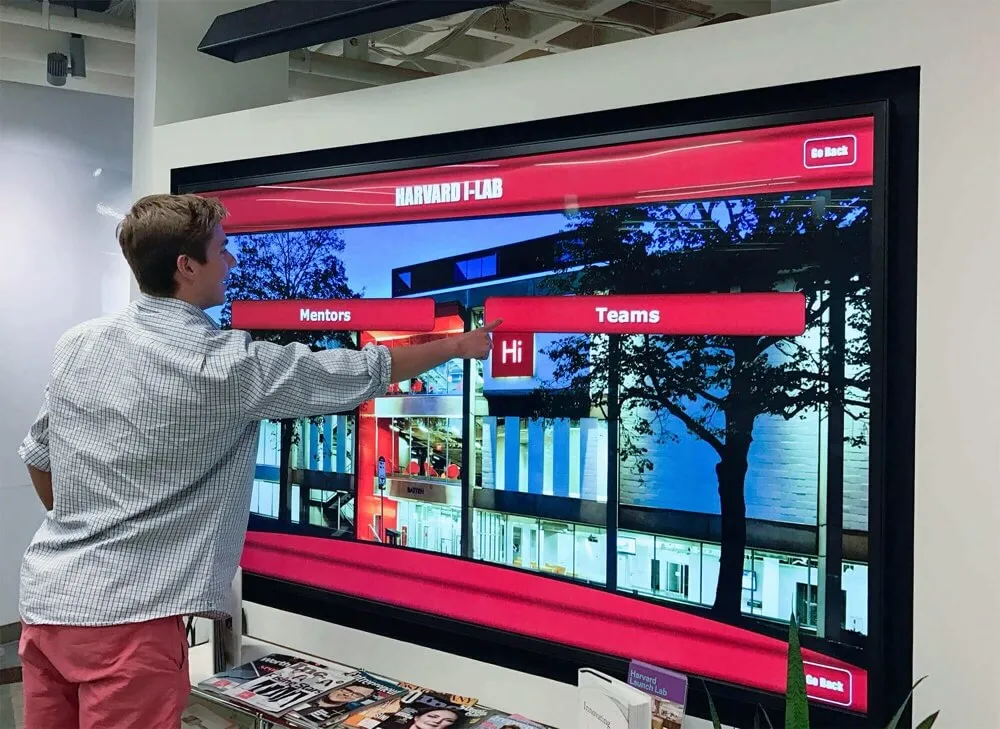
Interactive Digital Touchscreen Displays: Implemented by 5% of reunions, featuring:
- Searchable databases of class members
- Individual alumni profiles with photos and updates
- Interactive yearbook browsing
- “Where are they now” information
- Real-time photo uploads and social features
These systems require touchscreen hardware, cloud-based software platforms, internet connectivity, and advance data collection. Rental costs: $850-$2,400 per event. Permanently installed school systems: $0 incremental cost for reunion use. Setup time: 30 minutes to 3 hours depending on whether pre-installed or event-specific rental.
Hybrid Approaches: Used by 17% of reunions, combining:
- Traditional memory boards for tactile browsing
- Digital systems for comprehensive search and information
- Printed takeaway materials supplementing digital content
- Physical memorial displays with digital tribute videos
- Static photo displays supplemented by interactive elements
Hybrid strategies attempt to capture benefits of multiple approaches while accommodating diverse attendee preferences and technical comfort levels. Total costs typically exceed either approach alone: median $425 combining traditional materials and basic digital elements.
Content Strategy and Information Included
Beyond format choices, reunion displays vary substantially in content scope and organization:
Essential Content Categories: Most reunion displays include baseline information:
- Current photographs of classmates: 89% of reunions
- Yearbook photos from graduation year: 84% of reunions
- Names and maiden names: 91% of reunions
- Current location information: 67% of reunions
- Contact information or social media handles: 34% of reunions
- Professional information: 29% of reunions
Extended Content Elements: Higher-engagement displays incorporate additional materials:
- High school activity and sports photos: 62% of high-engagement displays
- Career highlights and accomplishments: 47% of displays
- Family information and children: 53% of displays
- Funny memories or yearbook quotes: 58% of displays
- “Then and now” comparison formats: 41% of displays
- Updates submitted specifically for reunion: 37% of displays
Memorial Recognition: Honoring deceased classmates represents sensitive but important content:
- 92% of reunions include memorial sections
- Average format: photographs with birth/death dates and brief information
- 38% include memory sharing opportunities for attendees
- 24% incorporate donation information for memorial scholarships or dedications
- Digital displays enable more extensive memorial tributes with photos and stories
Historical Context Materials: Many displays incorporate broader historical framing:
- Major world events during class years: 44% of reunions
- School history and building changes: 39% of reunions
- Historical photos of school and community: 51% of reunions
- Sports championships and achievements: 47% of reunions
- Pop culture references (music, movies, fashion): 56% of reunions
These contextual elements help attendees reconnect with the specific time period and shared experiences that defined their class identity.
Engagement Metrics and Outcomes
Quantitative Interaction Data
Digital displays with analytics capabilities provide objective engagement measurement:
Overall Interaction Rates: Among 87 reunions with tracked digital displays:
- Mean 73% of registered attendees interacted with displays
- Median 71% interaction rate
- Range: 42% to 94% depending on display prominence and event format
- Peak usage: first 90 minutes of event (67% of total interactions)
By comparison, committee estimates for traditional display engagement suggest 34% of attendees actively engage (browse displays, point out classmates, extended viewing), with 66% providing only cursory glances.
Session Duration and Depth: Digital display interactions average:
- Mean session length: 8.7 minutes per user
- Median: 7.2 minutes
- Profiles viewed per session: 12.4
- Search queries per session: 3.7
- Return interactions: 41% of users return for additional sessions during event
Traditional displays receive shorter engagement (mean 2.3 minutes based on committee observations), though measurement precision remains limited without objective tracking.
Content Preferences: Analytics reveal what reunion attendees prioritize:
- Individual classmate profiles: 44% of interaction time
- Photo browsing and yearbook exploration: 29% of time
- Search and discovery features: 16% of time
- Historical context and timeline materials: 11% of time
Attendees spend substantially more time exploring information about specific individuals they remember than browsing historical or contextual materials.
Social and Collaborative Features: When available, interactive features drive engagement:
- Photo uploads during events: Average 27 photos contributed per reunion
- Comments and memory sharing: Average 43 contributions per reunion
- Social media sharing: 34% of digital display users share content externally
- QR code access for personal devices: Used by 28% of attendees
These participatory elements extend engagement beyond passive viewing to active contribution.
Qualitative Satisfaction and Feedback
Post-reunion attendee surveys reveal satisfaction patterns:
Display Importance Ratings: Respondents assess how displays affected overall reunion experience:
- “Very important” to satisfaction: 47% of attendees
- “Important” to satisfaction: 38% of attendees
- “Somewhat important”: 12% of attendees
- “Not important”: 3% of attendees
Combined 85% rate displays as at least “important” to satisfaction, validating investment in quality recognition systems.
Display Quality Satisfaction by Type:
Professional digital interactive systems: Mean satisfaction 8.6/10
- Strengths cited: comprehensive information, easy search, professional appearance, engaging interaction
- Weaknesses cited: occasional technical issues, learning curve for less tech-savvy attendees
Professional printed displays: Mean satisfaction 8.1/10
- Strengths cited: beautiful presentation, tangible keepsakes, no technical issues, universally accessible
- Weaknesses cited: limited information capacity, difficult to find specific people in large classes, static content
Amateur traditional displays: Mean satisfaction 6.9/10
- Strengths cited: personal touch, volunteer effort appreciated, low-tech accessibility
- Weaknesses cited: poor print quality, disorganized layout, missing classmates, unprofessional appearance
Digital slideshows: Mean satisfaction 7.2/10
- Strengths cited: good for memories and nostalgia, musical accompaniment, easy to create
- Weaknesses cited: passive viewing only, specific information difficult to find, depends on viewing screen position
The data clearly indicates that professional execution quality matters more than format choice—both professional digital and professional printed approaches significantly outperform amateur executions regardless of medium.
Most Valued Display Characteristics: When asked what display features mattered most:
- Comprehensiveness (including all or most classmates): 76% cite as very important
- Easy navigation and finding specific people: 68% cite as very important
- Photo quality and clarity: 61% cite as very important
- Current information and updates: 59% cite as very important
- Professional appearance: 54% cite as very important
- Memorial recognition quality: 71% cite as very important (among those with deceased classmates)
Engagement Drivers and Best Practices
Analysis of high-engagement reunions reveals consistent success factors:
Physical Prominence and Visibility: Display placement substantially affects engagement:
- Entry point placement (immediate visibility upon arrival): 2.3x higher engagement
- Central location with natural traffic flow: 1.8x higher engagement
- Dedicated display area separate from dining/dancing: 1.4x higher engagement
- Poor placement (corners, side rooms, obstructed views): 0.6x engagement penalty
Many committees underestimate how placement affects whether attendees discover and engage with displays.
Comprehensiveness and Completeness: Missing classmates reduce display value:
- Displays including 90%+ of class: Engagement baseline
- Displays including 70-89% of class: 0.8x engagement
- Displays including <70% of class: 0.5x engagement
Attendees frequently search for specific friends and react negatively when displays lack substantial portions of class. Completeness particularly matters for digital searchable systems where absence becomes immediately apparent.
Information Depth and Quality: Rich content drives longer engagement:
- Basic identification only (name, photo): Baseline engagement
- Extended information (location, career, family): 1.7x engagement duration
- Personal updates and current details: 2.1x engagement duration
- Interactive contribution opportunities: 2.4x engagement duration
Displays that enable learning about classmates’ lives generate substantially deeper engagement than simple identification aids.
Visual Quality Standards: Professional execution quality affects satisfaction:
- High-resolution clear photos: Satisfaction baseline
- Low-quality pixelated or poorly reproduced images: 0.7x satisfaction
- Inconsistent layout or amateur design: 0.8x satisfaction
- Professional design and finishing: 1.2x satisfaction
Even traditional poster board approaches achieve higher satisfaction when executed with attention to print quality, consistent design, and professional presentation standards.
Implementation Logistics and Challenges
Traditional Display Creation Process
Committees using traditional approaches report typical workflows:
Timeline and Effort Requirements:
- Information gathering (contacting classmates, collecting photos): 8-12 weeks before event, 15-25 hours committee time
- Design and layout planning: 4-6 weeks before event, 6-10 hours
- Printing and materials preparation: 2-3 weeks before event, 8-14 hours
- Assembly and mounting: Week of event, 6-12 hours
- Transport and setup: Day of event, 2-4 hours
- Takedown and disposition: Day of event, 1-2 hours
Total committee time investment: Median 23 hours per reunion, range 12-48 hours depending on class size and display complexity.
Common Challenges Reported:
- Difficulty obtaining current photos from all classmates: 78% of committees
- Poor photo quality from social media downloads: 64% of committees
- Print quality issues (color accuracy, resolution): 52% of committees
- Finding deceased classmate photos and information: 71% of committees
- Layout and design decisions without professional expertise: 61% of committees
- Physical assembly challenges (mounting, trimming, labeling): 44% of committees
- Transportation logistics for large or fragile displays: 38% of committees
- Last-minute updates and changes: 55% of committees
Cost Components: Traditional approach expenses include:
- Printing costs: $80-$160 depending on quantity and quality
- Materials (foam core, mounting adhesive, labels): $35-$75
- Professional design services when used: $150-$400
- Transportation and setup supplies: $15-$35
These direct costs undercount total investment when volunteer committee time is valued. At $25/hour implied value, median volunteer time ($575) exceeds direct material costs by 3.1x.
Digital Display Implementation
Digital approaches involve different logistics and challenges:
Rental Display Process (for event-specific installations):
- Vendor selection and booking: 6-8 weeks before event
- Content preparation and data collection: 4-8 weeks before event
- Technical coordination with venue: 2-3 weeks before event
- Delivery and installation: Day before or morning of event
- Event support and monitoring: During event
- Removal and return: Day after event
Committee time investment: 8-15 hours primarily in content preparation. Technical setup performed by vendor representatives in most cases.
Permanently Installed School Systems (when available):
- Alumni coordinator collaboration: 4-6 weeks before event
- Content updates and reunion-specific customization: 2-3 weeks before event
- Reunion schedule integration: Week of event
- Day-of orientation and support: 30 minutes
Committee time investment: 3-6 hours, with school staff handling technical aspects.
Content Preparation Requirements: Digital systems require structured data:
- Classmate contact information compilation: Substantial effort regardless of display type
- Photo collection in digital formats: Easier than print process for scanning physical photos
- Data entry into spreadsheets or databases: 6-12 hours depending on class size
- Quality control and correction of errors: 3-5 hours
- Memorial information verification: 2-4 hours
While digital approaches require organized data structures, committees generally find this cleaner than physical printing and assembly processes.
Technical Challenge Categories:
- Internet connectivity requirements at venues: 34% of committees report concerns
- Power availability and cord management: 28% report issues
- Display positioning for optimal viewing angles: 41% report challenges
- Lighting conditions affecting screen visibility: 23% report problems
- Technical support availability during events: 19% report concerns
Most issues prove manageable with advance planning and venue site visits, but committees without technical experience express higher anxiety about digital approaches than traditional familiar methods.
Cost Analysis and Value Comparison
Direct Cost Comparisons
Different display approaches involve varying expense profiles:
Traditional Poster Board Displays:
- Small reunions (50-150 graduates): Mean $142, range $75-$280
- Medium reunions (150-300 graduates): Mean $187, range $110-$340
- Large reunions (300+ graduates): Mean $234, range $140-$425
Primary variables: printing volume, materials quality, professional design services usage.
Professional Printed Displays:
- Small reunions: Mean $380, range $250-$580
- Medium reunions: Mean $615, range $400-$950
- Large reunions: Mean $870, range $550-$1,400
Professional services provide superior quality but at substantial cost premiums over DIY approaches.
Digital Display Rentals:
- Basic equipment only (screen and player): Mean $350, range $200-$600
- Interactive touchscreen rental with software: Mean $1,400, range $850-$2,400
- Full-service including content preparation: Mean $2,200, range $1,400-$3,500
Rental costs typically include delivery, setup, event support, and removal. Content preparation services dramatically increase total costs but eliminate committee work.
Permanently Installed School Systems:
- Incremental reunion cost: $0 when school provides access
- Possible service fees for custom content or support: $0-$300
- Effective per-reunion cost: $0-$300
Schools with installed systems typically welcome reunion use as it demonstrates platform value and supports alumni engagement mission. Digital recognition displays serving daily school operations provide reunion benefits at zero marginal cost.
Hidden Cost Considerations
Direct material and rental costs understate total investment:
Volunteer Time Valuation: Committee member hours represent significant hidden costs:
- Traditional displays: Median 23 hours at $25/hour implied value = $575
- Professional print coordination: Median 8 hours = $200
- Digital rental coordination: Median 12 hours = $300
- School system coordination: Median 5 hours = $125
Opportunity Costs: Time spent on displays diverts effort from other reunion planning elements:
- Venue selection and coordination
- Food and beverage planning
- Entertainment and activities
- Communications and promotion
- Registration and financial management
Committees with limited volunteer capacity must prioritize where to invest time and effort.
Quality Impact on Attendance: Display quality affects reunion satisfaction, which influences future attendance:
- Reunions with high-quality displays: 68% of attendees express strong interest in next reunion
- Reunions with poor displays: 51% express strong interest in next reunion
- Difference: 17 percentage points potentially affecting future event viability
Poor displays risk alienating attendees and reducing future participation, with long-term costs exceeding short-term savings.
Reusability and Long-Term Value: Different approaches vary in ongoing utility:
- Traditional displays: Potential keepsake value, but usually discarded after events
- Professional prints: Suitable for permanent school display if desired
- Digital content: Reusable for future reunions and online alumni platforms
- School systems: Permanent ongoing value beyond single reunion event
Cost-Effectiveness Analysis
Determining optimal value requires considering costs relative to outcomes:
Cost Per Attendee Engagement: Dividing display costs by number of highly engaged attendees:
- Traditional displays: $187 cost ÷ 34% engagement × 100 attendees = $5.50 per engaged attendee
- Digital rentals: $1,400 cost ÷ 73% engagement × 100 attendees = $19.18 per engaged attendee
- School systems: $0 cost ÷ 73% engagement = $0 per engaged attendee
This metric favors low-cost traditional approaches and zero-cost school installations while suggesting rental displays involve premium pricing.
Committee Efficiency Metric: Cost per committee hour invested:
- Traditional displays: $187 materials ÷ 23 hours = $8.13 materials per hour + 23 hours volunteer time
- Professional print: $615 cost ÷ 8 hours = $76.88 per hour + 8 hours volunteer time
- Digital rental: $1,400 cost ÷ 12 hours = $116.67 per hour + 12 hours volunteer time
- School system: $0-$300 cost ÷ 5 hours = $0-$60 per hour + 5 hours volunteer time
This metric favors approaches minimizing volunteer time burden, particularly valuable when committee capacity is limited.
Satisfaction-Adjusted Value: Factoring quality outcomes into cost assessment:
- Traditional DIY (6.9/10 satisfaction): $187 cost ÷ 6.9 = $27.10 per satisfaction point
- Professional print (8.1/10 satisfaction): $615 cost ÷ 8.1 = $75.93 per satisfaction point
- Digital rental (8.6/10 satisfaction): $1,400 cost ÷ 8.6 = $162.79 per satisfaction point
- School system (8.6/10 satisfaction): $0-$300 cost ÷ 8.6 = $0-$34.88 per satisfaction point
This metric demonstrates that poor-quality cheap displays provide false economy, while high-quality approaches deliver better value when outcomes matter.
Best Practices for Reunion Display Success
Evidence-Based Recommendations by Reunion Type
Optimal strategies vary based on reunion characteristics:
Recent Reunions (5-10 Years):
- Priority: Current information and social connectivity
- Recommended approach: Digital or hybrid with social media integration
- Content focus: Where classmates live now, careers, significant life updates
- Key features: Easy social media sharing, photo upload capabilities, contact exchange facilitation
- Budget range: $300-$1,200 depending on digital sophistication
Recent graduates maintain stronger existing connections and higher social media engagement, making digital interactivity particularly valuable.
Mid-Range Reunions (15-25 Years):
- Priority: Balancing nostalgia with current life updates
- Recommended approach: Hybrid combining professional printed memory boards with digital information access
- Content focus: Then-and-now comparisons, family information, career trajectories
- Key features: Historical high school photos alongside current updates, searchable directory
- Budget range: $400-$1,500 depending on approach sophistication
These reunions benefit from nostalgic memory triggers combined with efficient information access about classmates whose lives have evolved substantially.

Milestone Reunions (30-50+ Years):
- Priority: Identification assistance and memorial recognition
- Recommended approach: Professional printed displays with clear identification and comprehensive memorial sections, optionally supplemented by simple digital photo slideshows
- Content focus: Then photos with clear names, memorial tributes, historical context
- Key features: Large text for readability, comprehensive classmate coverage, detailed memorial information
- Budget range: $380-$900 with emphasis on print quality and layout clarity
Older reunions require particular attention to identification (appearances change dramatically) and memorial recognition (more deceased classmates). Technical complexity should remain modest given attendee demographics.
Universal Best Practices Across Approaches
Regardless of format chosen, successful reunion displays share common characteristics:
Start Early and Communicate Clearly:
- Begin planning and classmate outreach 12-16 weeks before event
- Send multiple communications explaining what information is needed and deadlines
- Provide clear submission instructions for photos and updates
- Set realistic content cut-off dates allowing production time
- Follow up specifically with classmates who haven’t responded
Early preparation prevents last-minute scrambles that compromise quality.
Prioritize Completeness and Accuracy:
- Make extraordinary efforts to include every living classmate
- Verify deceased classmate information for memorial accuracy
- Double-check spelling, maiden names, and biographical details
- Include “information not available” rather than omitting classmates entirely
- Consider separate sections for classmates from whom no response was received
Comprehensive inclusive displays demonstrate respect for entire class while maximizing value for all attendees.
Design for the Venue and Event Flow:
- Visit venue in advance to understand space, lighting, and logistics
- Plan display positioning in high-traffic areas near entry or natural gathering points
- Consider sightlines and viewing angles for visibility
- Ensure displays don’t block critical pathways or create congestion
- Plan adequate space for groups to gather around displays
Physical logistics substantially affect whether displays achieve their potential impact.
Create Takeaway Materials:
- Provide printed directory or class list for attendees to keep
- Include reunion group photo and memory book opportunities
- Make digital content available online after event for extended access
- Send follow-up communications with reunion photos and highlights
- Archive reunion materials for historical record and future events
The reunion experience extends beyond the event itself through materials attendees can revisit and share.
Integrate Displays With Event Programming:
- Reference displays during welcome remarks or program elements
- Conduct group photo sessions near displays
- Use displays as conversation starters and ice-breakers
- Incorporate display content into any presentations or tributes
- Designate committee members to orient attendees and answer questions
Active integration ensures displays receive attention rather than being overlooked in busy social atmospheres.
Technology Selection Decision Framework
For committees considering digital approaches, systematic evaluation prevents poor choices:
Assess Technical Capacity and Comfort: Evaluate committee and venue capabilities:
- Does committee include members comfortable with technology coordination?
- Does venue provide reliable internet, power, and technical support?
- Is backup technical support available during event if issues arise?
- What is attendee demographic comfort level with interactive technology?
Committees lacking technical confidence should choose simpler approaches or full-service vendors rather than DIY digital implementations.
Evaluate School System Availability: First determine if school offers existing solutions:
- Does high school have permanently installed interactive recognition displays?
- Will school alumni office or administration support reunion use?
- Can school systems accommodate reunion-specific customization?
- What advance notice and coordination does school require?
When available, school systems provide optimal combination of sophisticated capability and zero incremental cost.
Compare Rental Options Systematically: If renting equipment, evaluate comprehensively:
- Equipment-only rentals (committee handles content): Lower cost but higher effort
- Full-service packages (vendor handles content): Higher cost but lower effort
- Local vs. national providers: Consider service quality and support accessibility
- References and reviews: Verify reliability and satisfaction from past clients
- Contract terms: Understand cancellation policies, support commitments, and contingencies
Request detailed proposals from multiple vendors enabling direct comparison of capabilities and costs.
Consider Long-Term Content Value: Evaluate whether digital content has uses beyond single event:
- Can content populate online alumni directory or school website?
- Will digital assets support future reunion planning?
- Does content have historical archival value for school?
- Could social features maintain class engagement between reunions?
Content with extended utility justifies higher digital investment compared to single-use traditional displays.
School Partnership Opportunities
Leveraging School Resources and Infrastructure
Many schools maintain systems supporting reunion needs:
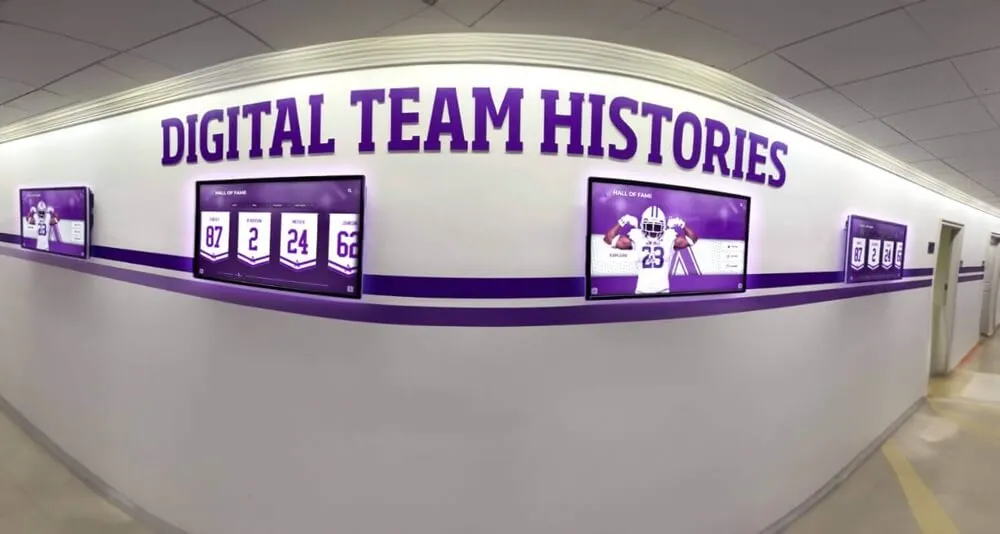
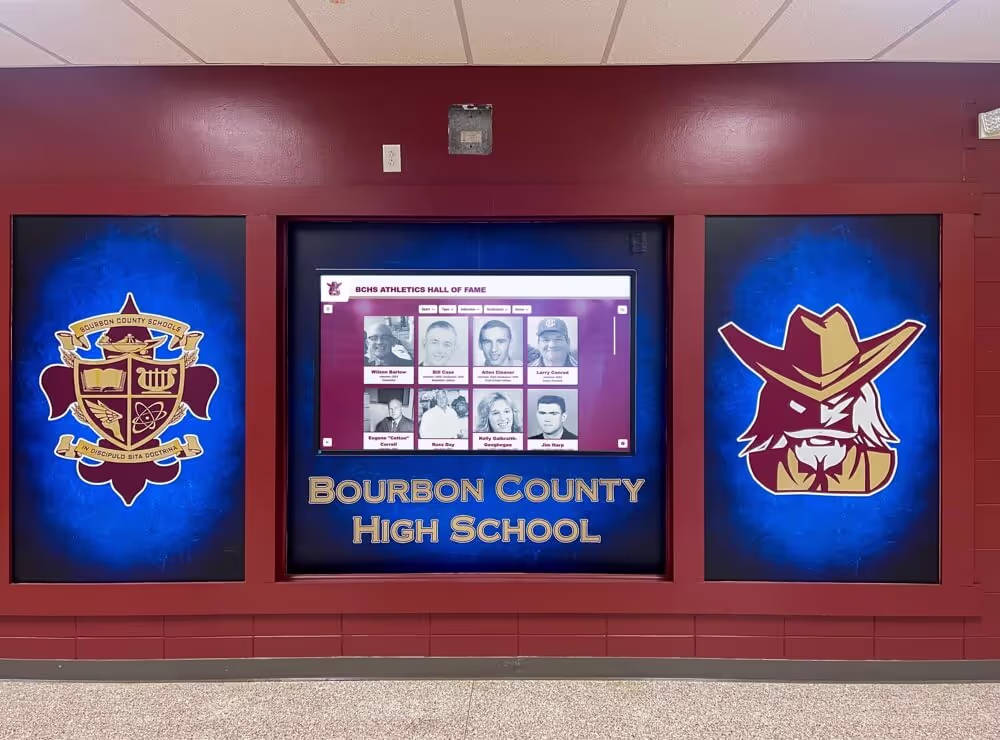
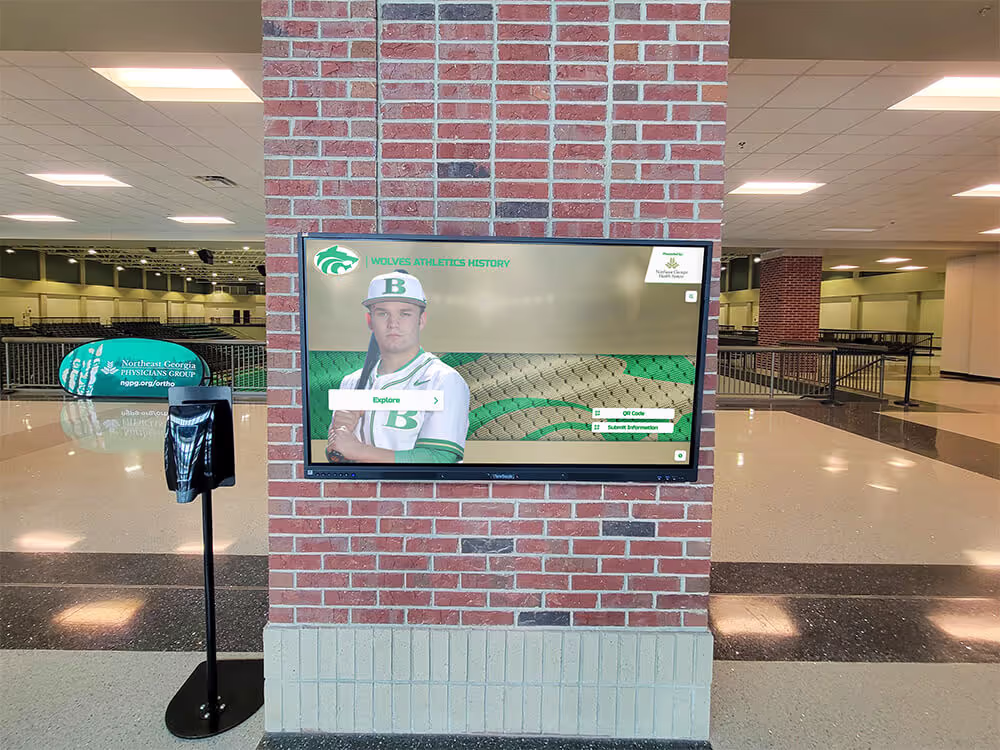
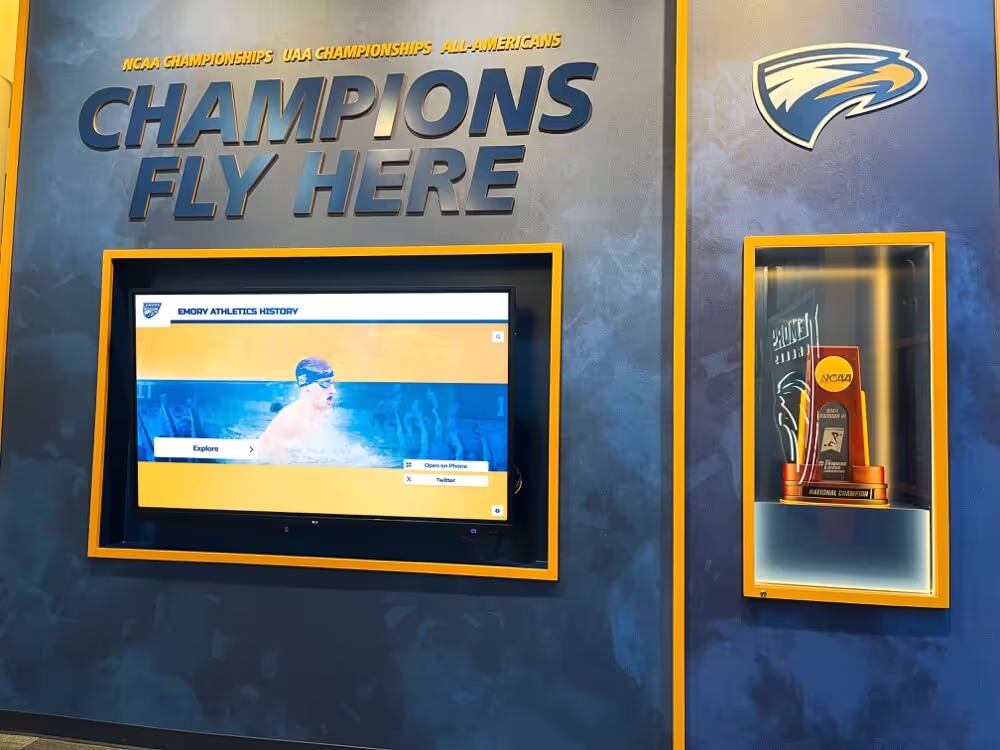
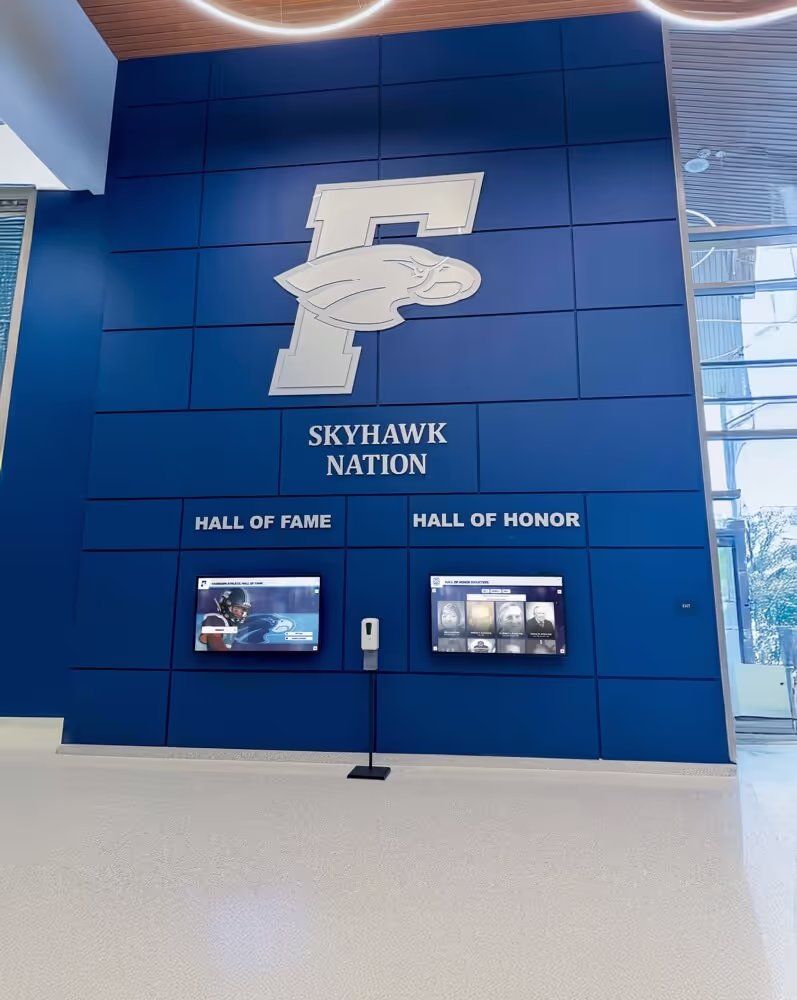
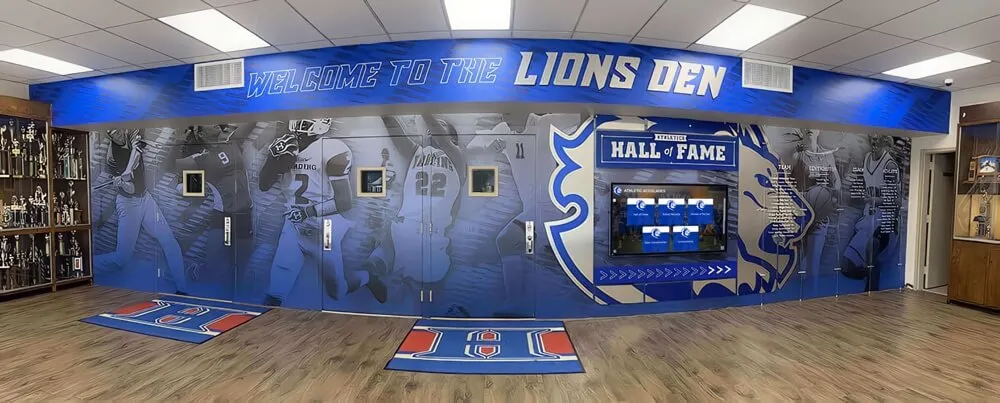
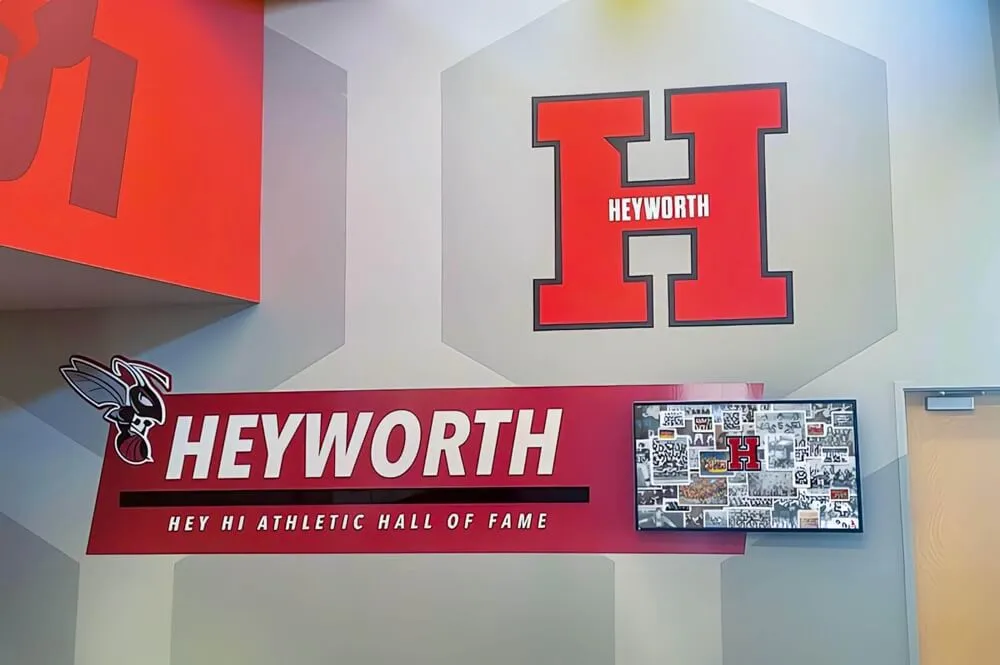
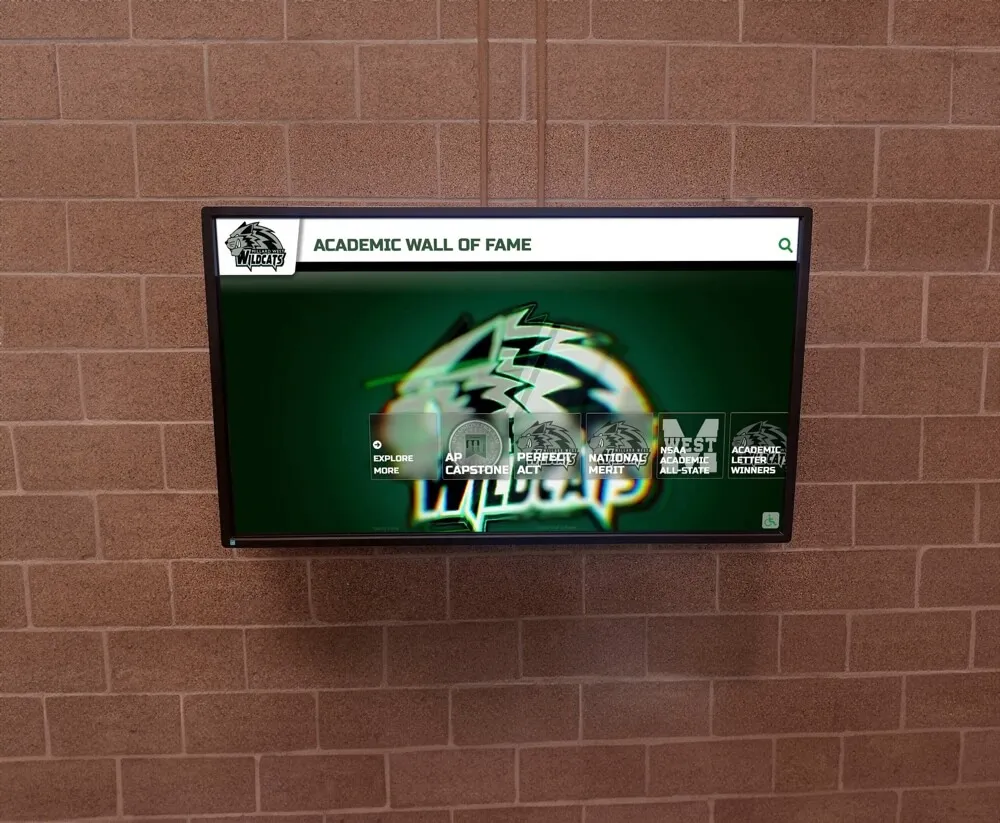
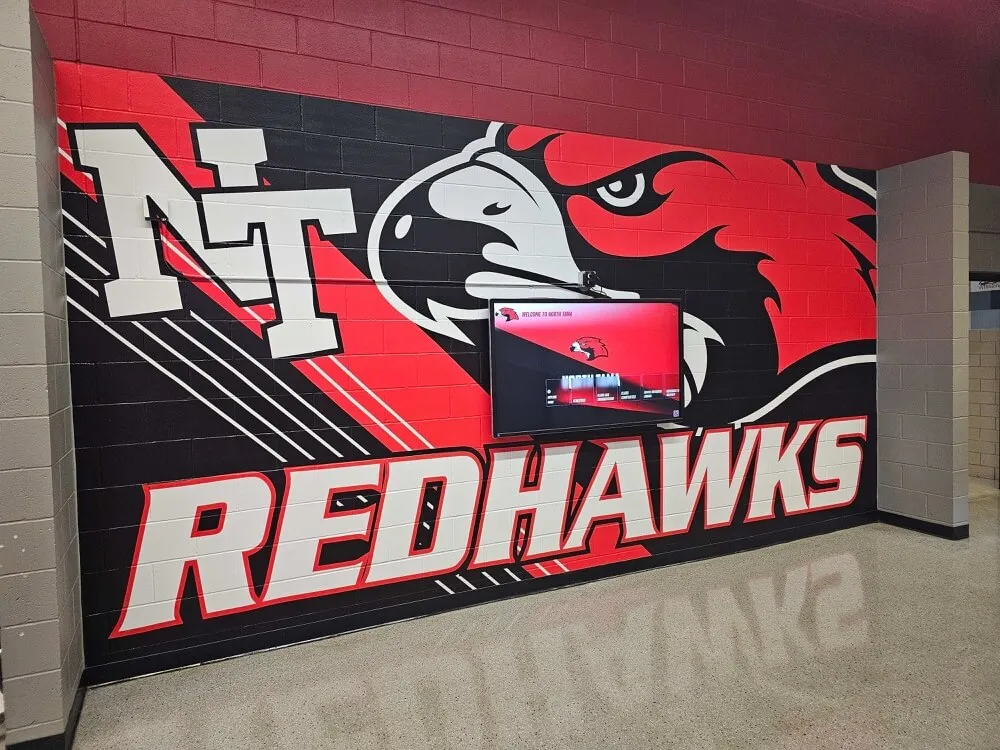
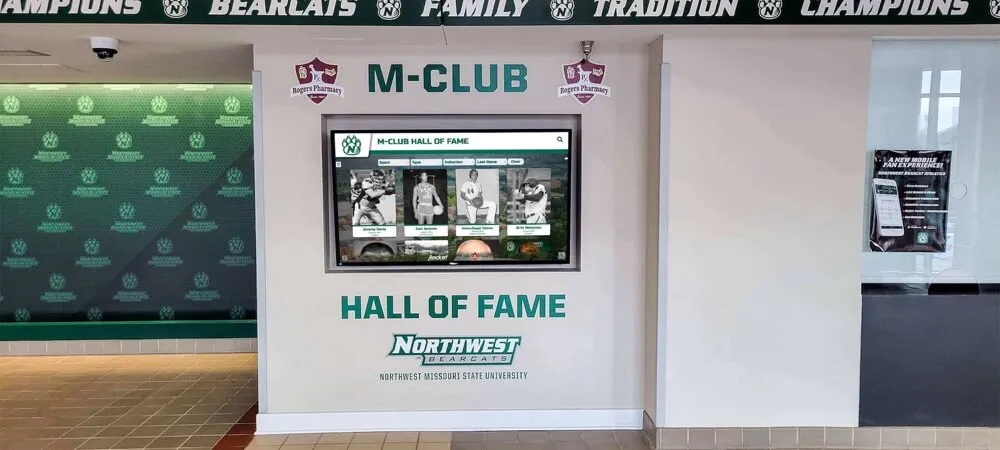
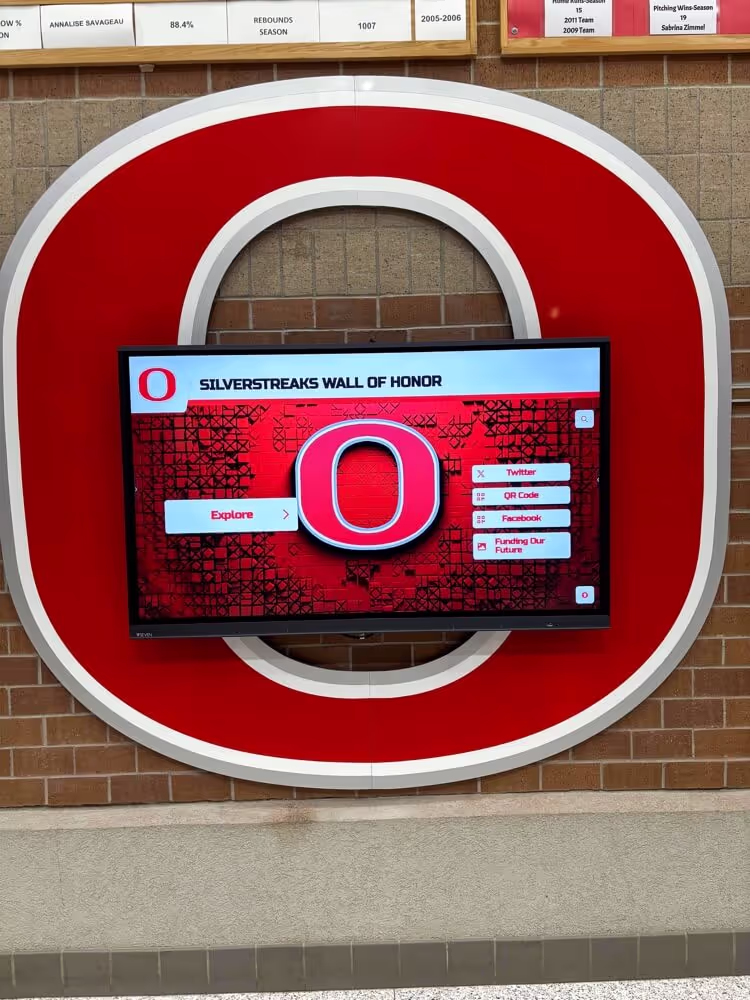
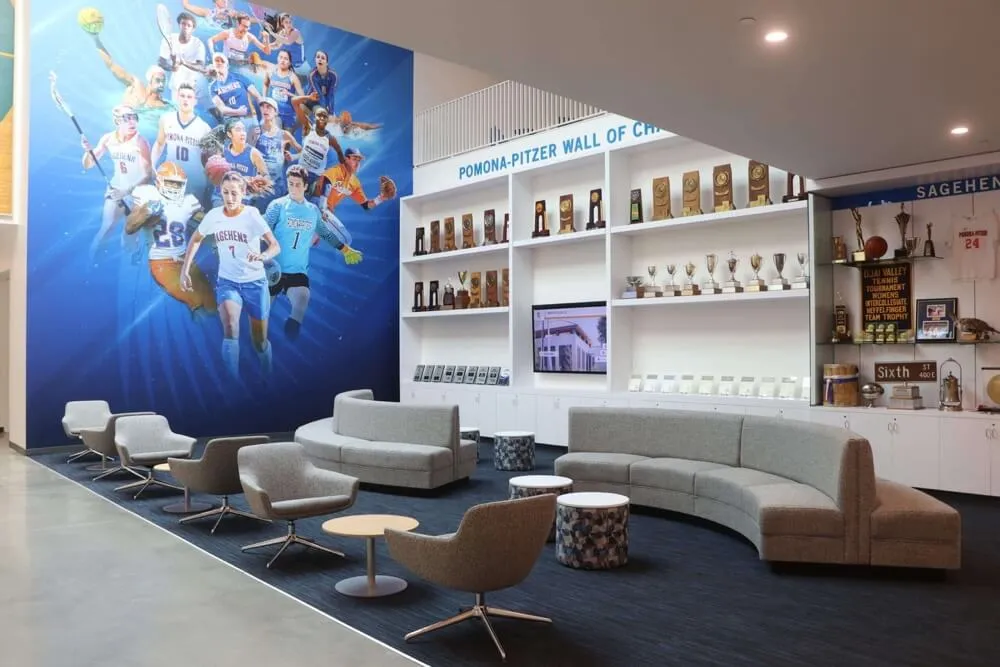
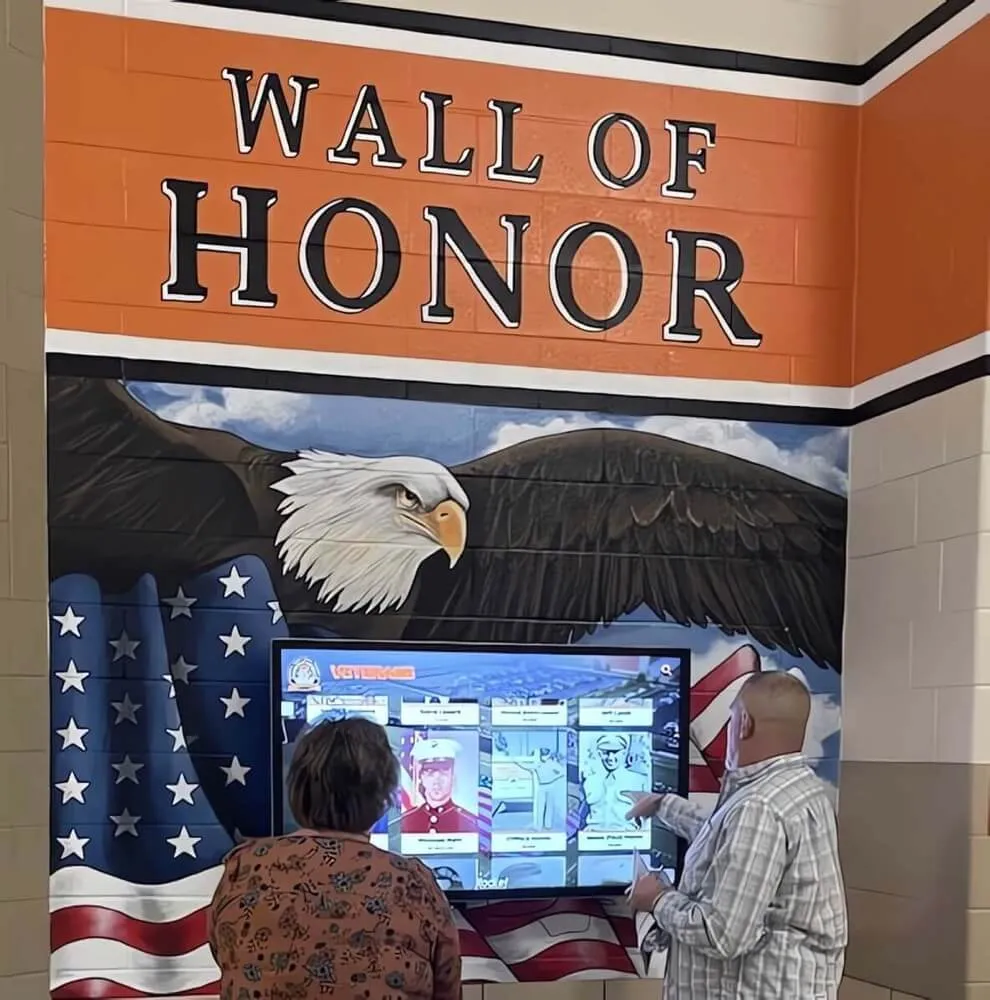
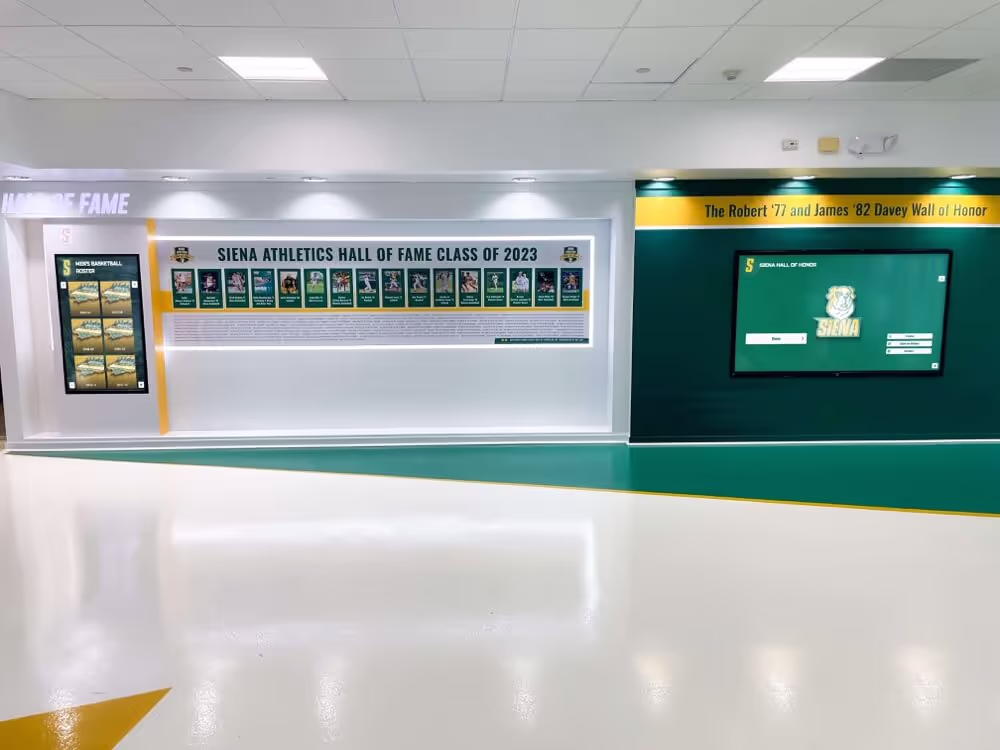
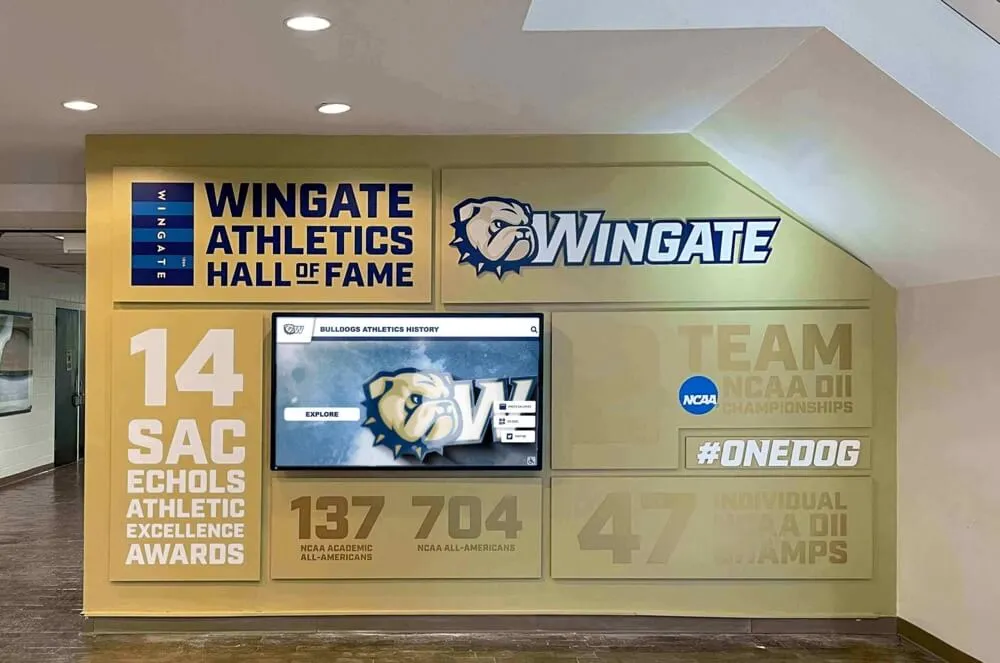
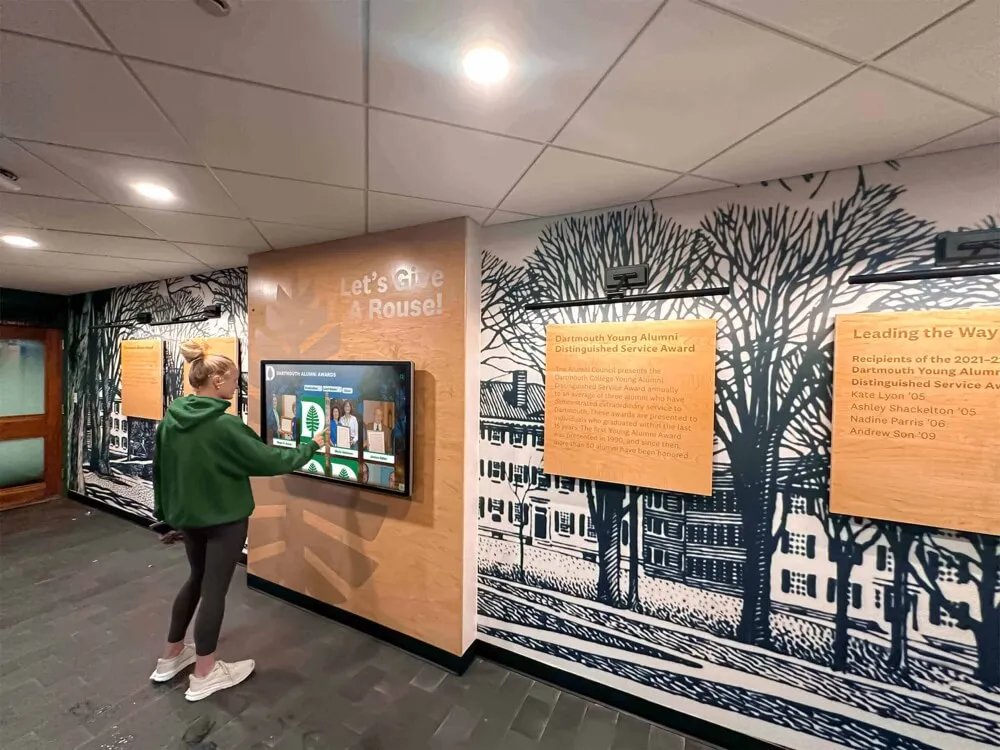
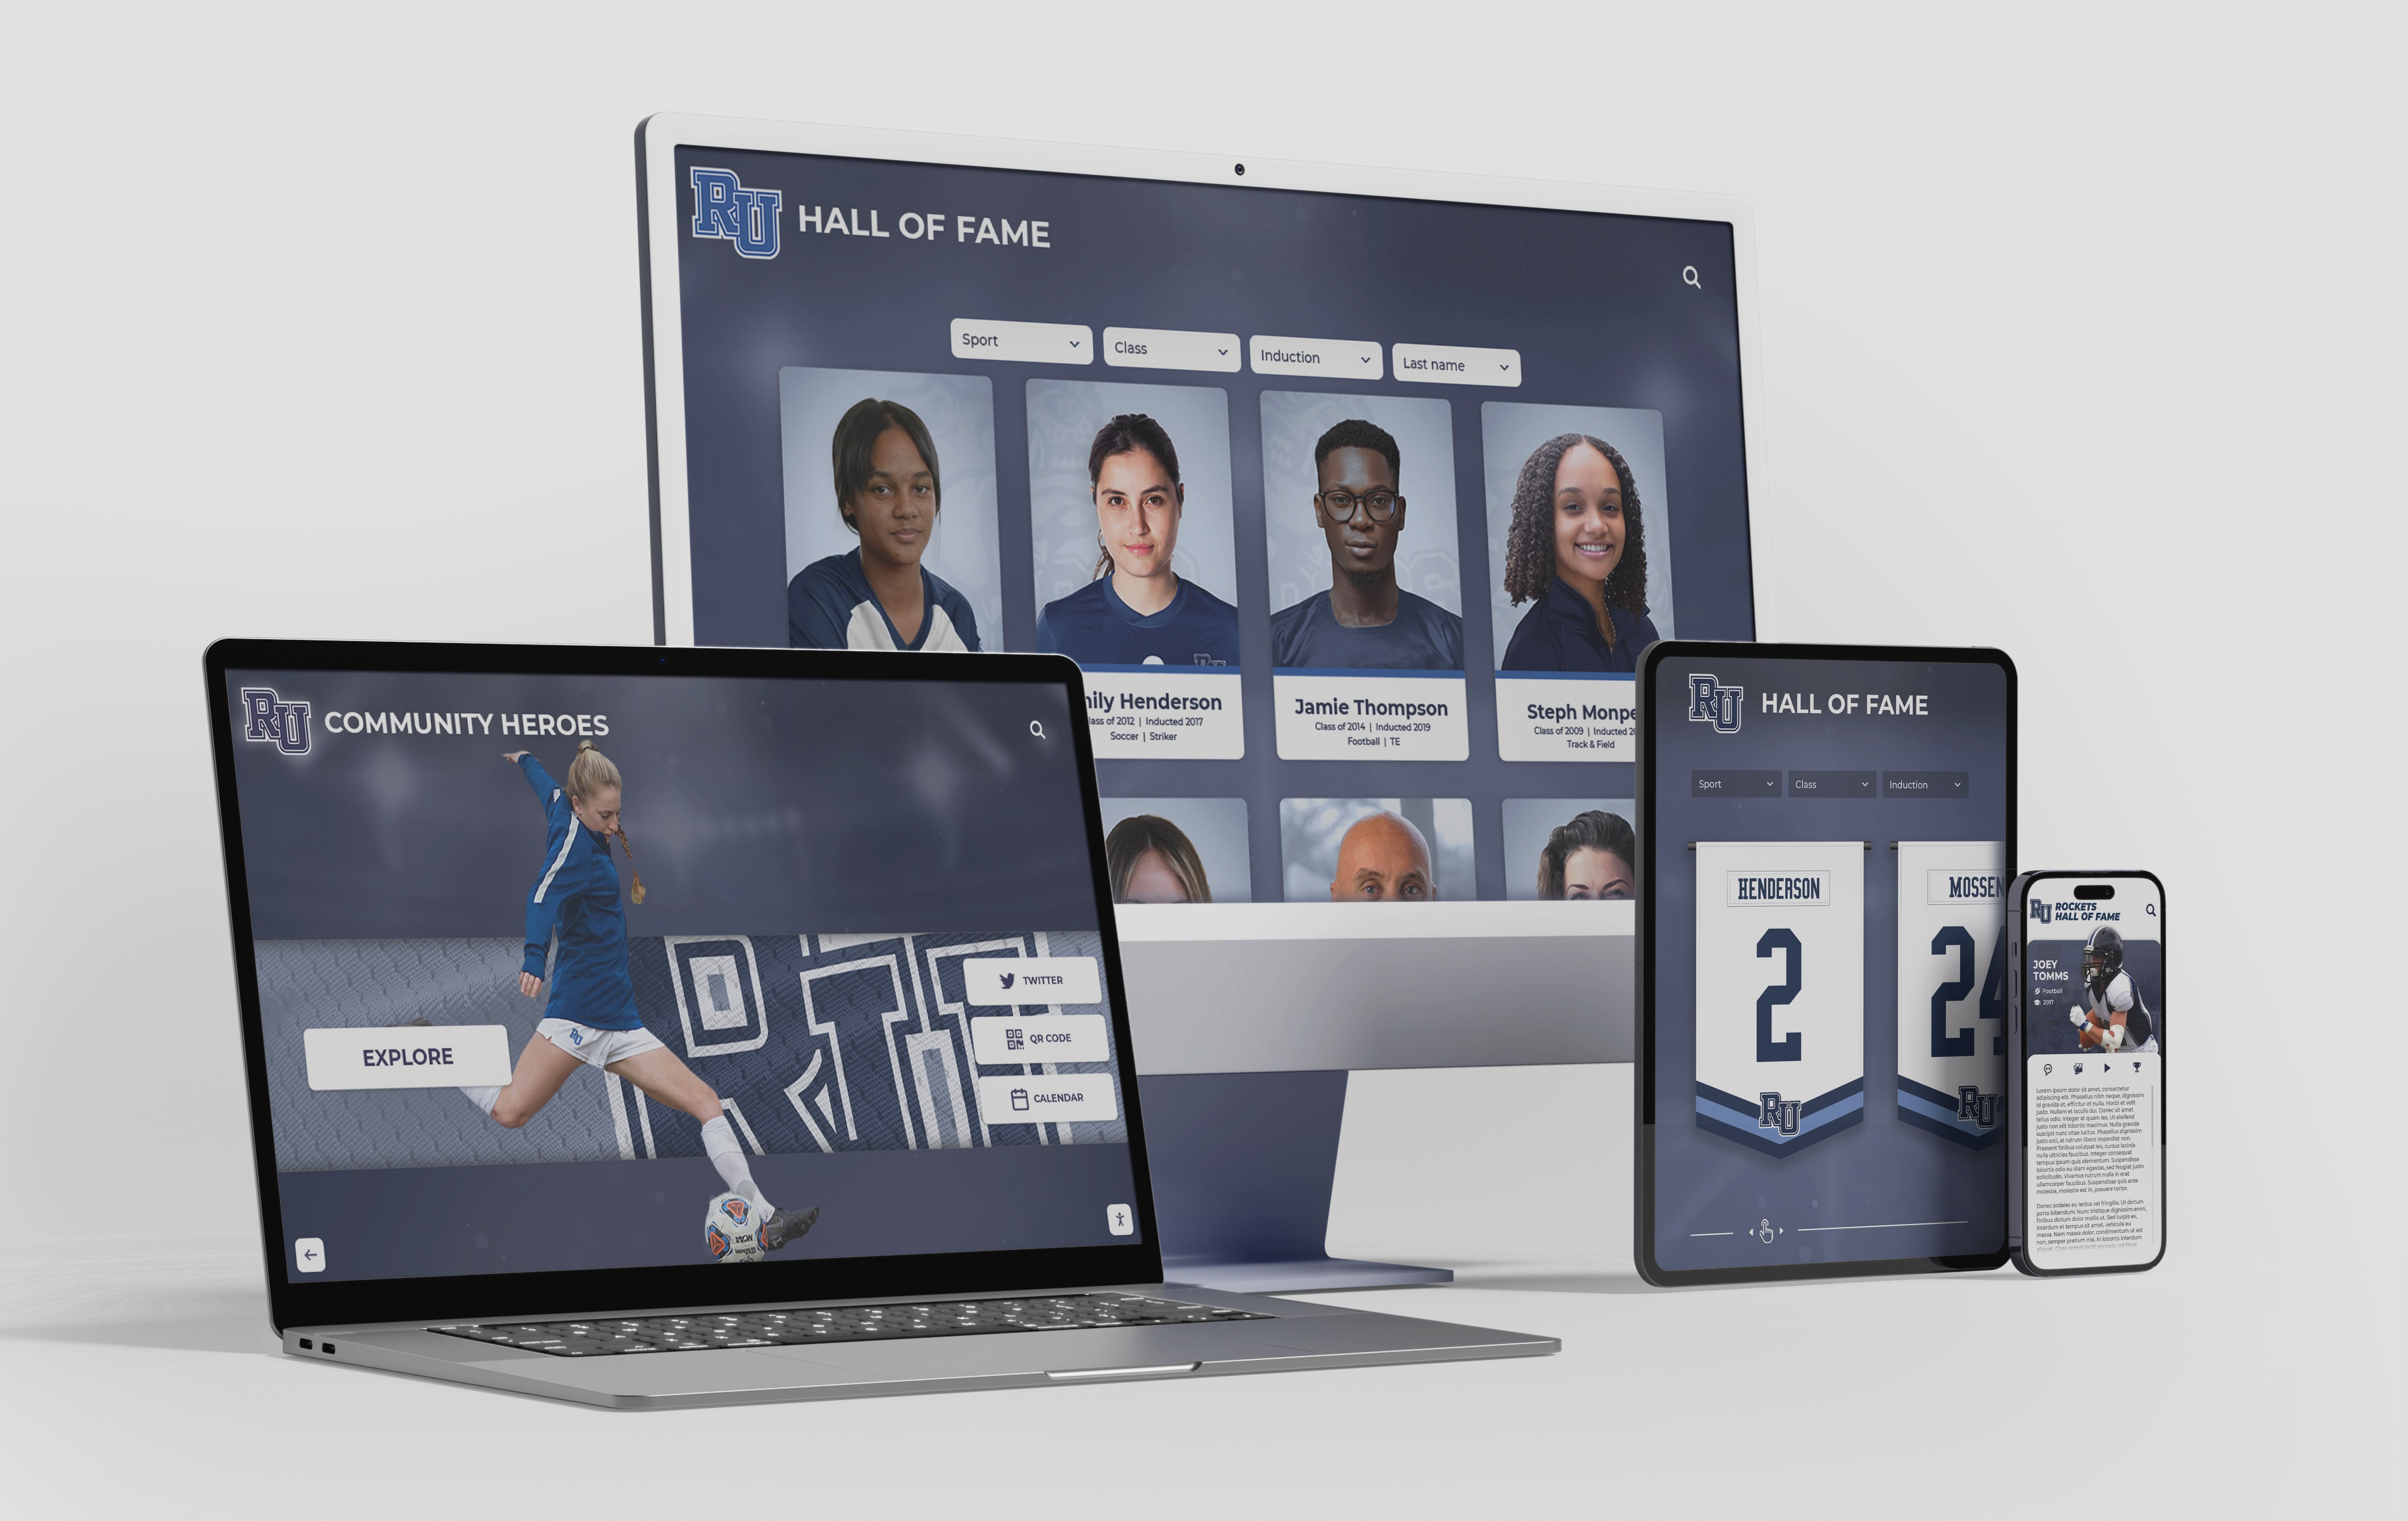
Permanently Installed Recognition Systems: Schools increasingly deploy digital halls of fame and alumni recognition displays serving daily institutional needs while supporting reunion events. These systems typically include:
- Interactive touchscreen displays in prominent school locations
- Cloud-based content management accessible to authorized users
- Individual alumni profiles with photos and accomplishments
- Searchable directories and class browsing capabilities
- Mobile-responsive web access supplementing physical displays
Schools with these installations commonly welcome reunion committee use, viewing reunion events as valuable opportunities to demonstrate system capabilities while strengthening alumni connections.
Alumni Affairs Office Support: Many schools provide reunion planning assistance through:
- Coordination of school facility use at reduced or no cost
- Access to historical yearbooks and archival photographs
- Mailing lists and contact information for class outreach
- Technical support for event technology needs
- Connection to other school resources and service providers
Committees should contact school alumni offices early in planning to understand available support and coordinate access.
Advancement Program Integration: Forward-thinking schools recognize reunions as advancement opportunities:
- Reunion displays showcase school’s commitment to honoring alumni
- Events provide visibility for fundraising campaigns and giving opportunities
- Positive reunion experiences strengthen alumni engagement and donor potential
- Professional recognition systems demonstrate institutional investment in community
Schools may subsidize reunion display costs when events support broader advancement objectives and create positive impressions.
Benefits of School System Integration
When reunions utilize school-owned recognition systems, multiple stakeholders benefit:
For Reunion Committees:
- Zero or minimal display costs reducing reunion budget requirements
- Professional quality displays without volunteer production effort
- Technical support from school staff rather than committee responsibility
- Reusable content infrastructure supporting future reunions
- Connection to broader school community and resources
For Schools:
- Demonstration of alumni engagement platforms to various reunion classes
- Content contributions from reunion committees enriching school archives
- Positive alumni experiences strengthening institutional relationships
- Evidence of system value supporting continued institutional investment
- Opportunities for advancement conversations during reunion events
For Reunion Attendees:
- High-quality professional displays enhancing event experience
- Connection to current school environment during campus visits
- Easy access to comprehensive classmate information
- Ability to explore broader school history beyond their specific class
- Enhanced perception of school’s commitment to alumni community
Initiating School Partnerships
Reunion committees can pursue school collaborations through:
Early Outreach: Contact school alumni office or administration 16-24 weeks before reunion to:
- Explain reunion planning and desired display approaches
- Inquire about available school resources and systems
- Understand policies, procedures, and any associated costs
- Identify school contact persons for ongoing coordination
- Schedule site visits to see facilities and systems
Value Proposition Communication: Frame reunion as mutually beneficial:
- Emphasize committee willingness to contribute content enriching school archives
- Explain how positive reunion experiences strengthen alumni engagement
- Offer to promote school initiatives and campaigns to reunion attendees
- Propose reunion as case study demonstrating system value
- Suggest potential advancement or fundraising connections
Collaborative Planning: Work closely with school representatives to:
- Coordinate content collection and data formats
- Understand system capabilities and customization options
- Plan technical setup and support during event
- Integrate school resources with committee-led reunion elements
- Establish clear responsibilities and communication protocols
Return on Investment and Outcome Measurement
Quantifying Display Value
Reunion committees can assess display effectiveness through multiple metrics:
Attendee Satisfaction Metrics: Post-reunion surveys should assess:
- Overall reunion satisfaction rating (1-10 scale)
- Display quality and effectiveness rating (1-10 scale)
- Display importance to overall satisfaction (very important to not important)
- Specific display features appreciated or criticized (open-ended)
- Intent to attend future reunions (influenced by overall satisfaction)
Correlation analysis between display ratings and overall satisfaction demonstrates display impact on reunion success.
Engagement Observation: Committees or designated observers can track:
- Percentage of attendees who actively engage with displays (not just passing glances)
- Average time attendees spend interacting with displays
- Conversation generation around displays (clusters of people discussing)
- Photography of displays (attendees taking photos of display content)
- Return engagement (attendees coming back to displays multiple times)
While less precise than digital analytics, observational data from traditional displays provides outcome evidence.
Social Media Impact: Display content often extends reunion reach:
- Photos of displays shared on social media platforms
- Comments and engagement on reunion-related posts
- Classmates who couldn’t attend engaging with shared content
- Ongoing conversations continuing after event concludes
- Reach to broader alumni community beyond reunion attendees
Digital displays enabling easy social sharing amplify reunion impact beyond those physically present.
Long-Term Engagement Effects: Quality reunions influence ongoing class connections:
- Increased participation in class communication channels
- More active engagement with school alumni programs
- Higher attendance projections for future reunion events
- Spontaneous class gatherings or regional meet-ups between official reunions
- Strengthened class identity and cohesion
Display quality contributes to overall reunion experience that drives these longer-term engagement outcomes.
Cost-Benefit Assessment Framework
Committees can evaluate display investment through structured analysis:
Total Cost Calculation:
- Direct material or rental costs: $X
- Volunteer time investment at implied value: $X
- Other display-related expenses: $X
- Total Display Investment: $X
Measurable Benefits:
- Enhanced attendee satisfaction (valued through increased future attendance)
- Time saved on information requests and navigation assistance
- Social media reach and engagement value
- Reusable content for future reunions and online platforms
- Estimated Quantifiable Value: $X
Strategic Benefits (difficult to quantify precisely):
- Strengthened class identity and connections
- Professional event impression affecting school relationship
- Memorial recognition providing closure and honoring deceased classmates
- Historical documentation preserving class legacy
- Conversation catalysts deepening reunion relationships
Most committees find strategic benefits provide primary value justification, with quantifiable returns partially offsetting but rarely exceeding total investment in purely financial terms.
Future Trends in Reunion Recognition
Emerging Technologies and Approaches
Reunion display practices continue evolving with technological advancement:
Artificial Intelligence Applications: Emerging AI capabilities relevant to reunions include:
- Automated face recognition matching current photos to yearbook images
- Photo organization and tagging reducing manual classification work
- Personalized content recommendations based on attendee browsing
- Natural language search understanding conversational queries
- Automated photo quality enhancement improving old photograph clarity
Early implementations show promise but require human oversight for accuracy, particularly with challenging historical photographs or significant appearance changes.
Augmented Reality Experiences: Some reunions experiment with AR features:
- Mobile apps overlaying historical photos on current school locations
- Interactive yearbook experiences through smartphone cameras
- Virtual “time machine” visualizations of school changes over decades
- AR-enhanced name badges identifying classmates to each other
Implementation complexity and attendee technical requirements currently limit widespread adoption, though younger reunion demographics may embrace these innovations.
Hybrid Event Integration: Post-pandemic reunion planning increasingly considers virtual attendance:
- Live streaming of reunion events for remote participants
- Virtual display access enabling non-attending classmates to browse
- Online memorial tribute opportunities for those unable to attend
- Hybrid programming connecting in-person and remote attendees
Digital recognition platforms with web access naturally support hybrid approaches, providing identical content to both physical and virtual attendees.
Ongoing Engagement Platforms: Rather than event-specific displays, some classes maintain continuous online platforms:
- Persistent alumni directories and class websites
- Ongoing photo and memory sharing between reunions
- Regular updates and news from classmates
- Event planning and coordination tools
- Memorial pages honoring deceased classmates as they pass
These year-round platforms make reunion displays one element of continuous class connection rather than isolated event-specific efforts.
What This Means for Reunion Committees
Actionable Insights for Planners
This benchmark data reveals several critical implications for reunion planning:
Quality Matters More Than Format: The data clearly demonstrates that professional execution quality drives satisfaction and engagement more than specific technology choices. Committees should prioritize execution excellence within chosen approaches rather than assuming digital automatically delivers better outcomes than traditional methods.
School Partnerships Offer Superior Value: When available, school-installed recognition systems provide optimal combination of zero marginal cost, professional quality, minimal committee effort, and highest engagement outcomes. Committees should explore school resources before committing to other approaches.
Hidden Costs Exceed Direct Costs: Volunteer time investments substantially exceed material and rental expenses for most display types. Committees with limited volunteer capacity should emphasize time-efficient approaches over absolute dollar cost minimization.
Completeness Drives Value: Comprehensive coverage including all or nearly all classmates matters enormously to attendee satisfaction. Committees should invest effort in obtaining responses from hard-to-reach classmates rather than accepting gaps that reduce display value.
Integration Amplifies Impact: Displays gain effectiveness when actively integrated into event programming rather than serving as passive background elements. Committees should plan specific ways to draw attention to displays and facilitate their use as conversation catalysts.
Decision Framework for Display Selection
Committees should systematically evaluate options against specific contexts:
Budget-Constrained Situations (under $250 available):
- Recommended approach: Traditional poster boards with strong focus on execution quality
- Success factors: Clear photos, professional layout, comprehensive coverage, quality printing
- Volunteer requirement: 20-25 hours committee time
- Expected outcomes: Moderate engagement, cost-effective solution
Volunteer-Constrained Situations (limited committee capacity):
- Recommended approach: Professional printed displays or school system partnerships
- Success factors: Early planning, clear vendor communication, adequate budget allocation
- Volunteer requirement: 8-12 hours for coordination and content
- Expected outcomes: High quality with minimal committee burden
Technology-Enabled Situations (tech-savvy committee or school resources):
- Recommended approach: Digital interactive displays via rental or school systems
- Success factors: Technical coordination, structured data collection, venue preparation
- Volunteer requirement: 10-15 hours for content and coordination
- Expected outcomes: Highest engagement and satisfaction metrics
Milestone Celebrations (significant anniversaries with higher budgets):
- Recommended approach: Hybrid combining professional printed keepsakes with digital interaction
- Success factors: Coordinated design across formats, emphasis on memorial recognition, comprehensive historical content
- Volunteer requirement: 15-20 hours across both components
- Expected outcomes: Maximum attendee satisfaction and lasting impact
Conclusion: Strategic Investment in Reunion Recognition
The evidence presented in this benchmark report demonstrates that reunion displays represent strategic investments in alumni engagement rather than mere logistical details. With 85% of attendees rating displays as important or very important to overall reunion satisfaction, and engagement metrics showing dramatic variation between approaches (34% engagement for basic traditional displays versus 73% for interactive digital systems), display strategy significantly affects reunion outcomes.
The data reveals that optimal approaches depend on specific reunion contexts rather than universal prescriptions. Budget-constrained committees can achieve strong results through carefully executed traditional displays emphasizing completeness and quality. Technology-enabled committees can leverage digital systems for superior engagement when technical and financial resources permit. Committees with access to school-installed recognition systems enjoy optimal combinations of zero marginal cost, professional quality, and highest engagement outcomes.
Several clear patterns emerge regardless of specific display choices: professional execution quality matters more than format or technology, comprehensiveness including all classmates drives satisfaction, prominent physical placement affects engagement dramatically, integration into event programming amplifies impact, and volunteer time investment often exceeds material costs as primary resource constraint.
For reunion committees beginning display planning, the path forward involves early assessment of available resources (budget, volunteer capacity, school support, technical capabilities), systematic evaluation of options matching resources to reunion characteristics, emphasis on execution quality regardless of chosen approach, comprehensive classmate inclusion prioritized over elaborate features with gaps, and measurement of outcomes informing continuous improvement for future events.
The investment in quality reunion displays serves multiple objectives: helping attendees identify and reconnect with classmates, creating conversation catalysts that deepen reunion relationships, honoring deceased classmates through meaningful memorial recognition, documenting class history for institutional archives, and generating positive experiences that sustain engagement between official reunion events.
As schools increasingly deploy permanent digital recognition and engagement platforms, reunion committees gain access to sophisticated capabilities at zero incremental cost while contributing content that enriches institutional archives. These partnerships create win-win scenarios where committees access resources reducing reunion costs and effort while schools gain content and demonstrate system value to diverse alumni constituencies.
See the platform behind the data: Rocket Alumni Solutions provides schools with comprehensive recognition systems serving daily institutional needs while supporting reunion events with zero marginal costs.
For schools seeking integrated platforms combining unlimited capacity for historical archives and class recognition with interactive displays and web access, Rocket Alumni Solutions delivers turnkey implementations addressing the challenges and incorporating best practices documented throughout this research.