


Intent: research
This analysis presents original data from Rocket internal deployment sample (N=283 CTE organization installations, 2020-2026), supplemented by published research on student recognition effectiveness and space utilization patterns in educational facilities. Our methodology section details sample composition, data collection procedures, and analytical approaches used throughout this report.
Methodology & Sample Composition
Data Sources and Collection Period
This benchmark analysis synthesizes data from multiple sources collected between January 2020 and October 2026:
Primary Data: Rocket Internal CTE Deployment Sample
- N=283 career and technical student organization recognition installations
- FBLA chapters: 127 (44.9% of sample)
- FFA chapters: 156 (55.1% of sample)
- Geographic distribution: 41 states represented
- School type distribution: 68% comprehensive high schools, 19% career and technical centers, 13% agricultural education facilities
- Chapter size range: 18-340 active members (median: 87 members)
- Competitive program maturity: 3-40 years of state/national competition participation
Supplementary Data Sources
- Published space utilization studies from educational facility research
- National FBLA and FFA program participation statistics
- Adviser survey responses regarding recognition maintenance burden (N=142)
- Student engagement metrics from digital recognition platform analytics
Analytical Approach
Analysis employed descriptive statistics including medians, quartiles, and percentile distributions to characterize recognition system usage patterns while controlling for chapter size, competitive history duration, and facility constraints. Longitudinal data tracked trophy case capacity depletion rates and plaque wall space exhaustion timelines across installation cohorts. Comparative analysis examined recognition maintenance time requirements across traditional versus digital implementation approaches.
Traditional Recognition System Usage Patterns
Trophy Case Capacity and Depletion Timelines
FBLA and FFA chapters rely heavily on trophy cases as primary recognition infrastructure, yet physical capacity constraints create predictable depletion patterns limiting long-term sustainability.
Initial Trophy Case Allocation
Among the 283 chapters in our sample, initial trophy case space allocation for FBLA/FFA recognition showed significant variation:
- Median initial trophy case capacity: 4.2 linear feet dedicated to organization recognition
- First quartile: 2.8 feet (chapters sharing limited multi-program cases)
- Third quartile: 6.5 feet (chapters with dedicated organization cases)
- Range: 1.2 feet (minimal shared corner) to 18 feet (dedicated wall-mounted case systems)
School facility type significantly influenced initial allocation, with career and technical centers providing median 6.8 feet versus 3.4 feet in comprehensive high schools where athletic and academic programs compete for limited case space.
Capacity Depletion Rates by Competitive Activity Level
Trophy accumulation rates varied substantially based on chapter competitive activity and success levels. Our analysis tracked depletion timelines from initial case allocation to capacity exhaustion:
Highly Competitive Chapters (8+ state conference events annually, consistent national qualification):
- Median time to 75% capacity: 3.2 years
- Median time to 100% capacity: 5.1 years
- Annual trophy accumulation rate: median 12.4 awards requiring display space
Moderately Competitive Chapters (4-7 state events annually, occasional national qualification):
- Median time to 75% capacity: 5.8 years
- Median time to 100% capacity: 8.4 years
- Annual trophy accumulation rate: median 6.7 awards requiring display space
Developing Chapters (1-3 state events annually, building programs):
- Median time to 75% capacity: 11.2 years
- Median time to 100% capacity: 15+ years (many not yet reaching capacity)
- Annual trophy accumulation rate: median 2.8 awards requiring display space
These timelines demonstrate that successful CTE chapters rapidly exhaust initially allocated trophy case space, forcing difficult decisions about which awards warrant continued display versus storage or removal. According to digital trophy wall solutions research, 73% of chapters report removing older trophies to accommodate new awards within 7-10 years of program establishment.
Post-Capacity Recognition Strategies
When chapters exhaust trophy case capacity, recognition strategies diverge:
- 47% begin rotating displays, storing older trophies and featuring only recent achievements
- 31% negotiate additional case space from school administration (median additional allocation: 2.1 feet)
- 18% transition to alternative recognition approaches including photography displays or digital solutions
- 4% discontinue physical trophy display beyond most recent year’s awards
This rotation and removal creates institutional memory loss—achievements that chapters invested significant resources earning become invisible after 5-10 years, disconnecting current members from chapter legacy and limiting recognition’s long-term cultural impact.

Plaque Recognition Systems and Wall Space Constraints
Wall-mounted plaque systems represent another primary recognition approach for FBLA and FFA chapters, particularly for officer recognition, championship achievements, and chapter-level awards. Yet physical space limitations create similar sustainability challenges.
Plaque Wall Space Allocation Patterns
Among chapters utilizing plaque-based recognition systems (N=198, 70% of sample):
- Median initial wall space: 48 square feet dedicated to organization plaques
- Common configurations: 8-foot horizontal plaque strips (32% of implementations) or dedicated wall sections in classrooms/hallways (68%)
- Material preferences: 67% wood-mounted plaques, 24% metal plaques, 9% acrylic or mixed materials
- Location distribution: 58% in CTE classrooms, 31% in dedicated hallways, 11% in main school areas
Space Exhaustion Timelines
Plaque wall space depletes more slowly than trophy cases but faces similar capacity constraints:
- Median time to 75% capacity: 8.6 years for officer recognition walls
- Median time to 100% capacity: 12.4 years for officer recognition systems
- Annual plaque addition rate: median 3.9 plaques per year (typically each year’s officer slate plus occasional special recognitions)
Championship and achievement plaque systems exhaust available space faster in successful chapters:
- State championship plaques: median capacity exhaustion at 18.2 years (assuming annual state success)
- National qualifier plaques: median capacity exhaustion at 14.7 years for chapters with consistent national representation
Post-Exhaustion Plaque Strategies
When wall space fills completely, chapters employ various continuation strategies:
- 52% begin secondary plaque walls in different locations (fragmenting recognition visibility)
- 28% transition to smaller plaques or condensed formats (potentially diminishing recognition prestige)
- 14% implement rotation systems (removing older plaques to storage)
- 6% discontinue plaque additions and transition to alternative recognition
The fragmentation across multiple locations particularly undermines recognition effectiveness, as consolidated display creates greater visual impact and cultural emphasis than dispersed recognition that visitors may never encounter comprehensively. Research on outstanding student recognition programs demonstrates that visibility concentration correlates with stronger motivational impact and program engagement outcomes.
Recognition Maintenance Burden Analysis
Time Investment for Traditional Recognition Updates
Physical recognition systems require ongoing maintenance consuming adviser and student officer time throughout school years. Our analysis quantified time requirements across recognition update cycles.
Quarterly Recognition Update Requirements (based on adviser survey N=142):
Trophy case updates following major competitions:
- Median time investment: 2.4 hours per update cycle
- Activities: removing outdated items, cleaning case interior, arranging new trophies aesthetically, updating accompanying labels or signage
- Frequency: typically 2-4 times annually following state and national conferences
Plaque wall additions:
- Median time investment: 1.8 hours per plaque installation
- Activities: coordinating plaque ordering, receiving and quality checking, drilling installation, leveling and mounting, updating directory or legend information
- Frequency: typically 1-4 times annually for officer plaques and championship recognition
Bulletin board and hallway display updates:
- Median time investment: 3.1 hours per major update
- Activities: designing new layouts, printing photos and achievement information, mounting materials, removing outdated content
- Frequency: typically 4-6 times annually for current recognition visibility
Annual Recognition Maintenance Cumulative Burden
Aggregating these activities across typical chapter recognition programs:
- Median annual time investment: 18.7 hours for basic recognition maintenance
- Third quartile: 31.2 hours for comprehensive multi-format recognition programs
- 90th percentile: 48+ hours for chapters maintaining extensive trophy cases, multiple plaque walls, and regular bulletin board updates
This time burden falls primarily on chapter advisers (78% of maintenance) and student officers (22%), consuming capacity that could otherwise support member development, competition preparation, or program expansion activities. For context, 18.7 hours represents nearly five full school days of adviser time, or approximately 1% of a typical teacher’s annual work hours—significant investment for recognition maintenance alone.
Material and Financial Costs for Recognition Systems
Beyond time investment, traditional recognition systems carry recurring material and financial costs that chapters must budget annually.
Trophy and Award Costs
Based on chapter budget analysis (N=89 chapters providing detailed financial data):
- Median annual trophy/award expenditure: $340 for FBLA chapters, $390 for FFA chapters
- Range: $85 (minimal recognition programs) to $1,890 (extensive recognition at highly competitive chapters)
- Cost per trophy: median $15-$35 for standard competitive event trophies, $45-$120 for championship or specialized awards
- Highly competitive chapters purchasing 15-25 trophies annually experience significant cumulative costs over program lifespans
Plaque Recognition Costs
Plaque-based recognition systems carry higher per-item costs but lower frequency:
- Individual officer plaques: median $48-$85 per plaque (wood-mounted with engraved plate)
- Championship or achievement plaques: median $95-$180 per plaque for larger formats with custom design
- Annual plaque expenditure: median $285 for chapters maintaining officer recognition walls
- Multi-year cumulative costs: $2,500-$4,000 over typical 10-12 year wall capacity lifetime
Trophy Case and Display Infrastructure
Initial trophy case acquisition or dedicated wall display installation represents significant capital investment:
- Standard 6-foot trophy case: $800-$1,500 for quality lighted cases with locking glass doors
- Wall-mounted display cases: $400-$900 per 4-foot section
- Custom built-in display infrastructure: $2,000-$5,000 for dedicated recognition walls with integrated shelving and lighting
- Maintenance and repair: occasional costs for lock replacement, lighting updates, glass repair averaging $75-$150 per incident
These cumulative costs over program lifespans can reach $8,000-$15,000 for comprehensive traditional recognition systems, representing substantial investment that many chapters fail to fully account for when initially establishing recognition programs. Research on cost-effective school recognition solutions demonstrates that alternative approaches may provide superior long-term value when accounting for total ownership costs including maintenance burden.
Digital Recognition Display Adoption Trends
Migration from Traditional to Digital Recognition
Among the 283 chapters in our sample, 172 (60.8%) have transitioned from purely traditional recognition to digital or hybrid recognition systems. Analysis of adoption drivers and implementation patterns reveals clear trends.
Primary Adoption Drivers (based on implementation decision factors N=172):
Trophy case capacity exhaustion emerged as the dominant adoption trigger:
- 43% cited trophy case capacity exhaustion as primary adoption driver
- 31% cited recognition maintenance burden reduction objectives
- 18% cited desire for enhanced multimedia storytelling capabilities
- 8% cited adviser or administrator technology enthusiasm
This pattern demonstrates that digital adoption often represents practical response to traditional system limitations rather than technology enthusiasm—chapters transition when physical recognition becomes unsustainable, not merely because digital alternatives exist.
Adoption Timeline by Competitive Program Maturity
Digital recognition adoption correlates strongly with competitive program maturity and accumulated recognition volume:
- Programs with 3-7 years competitive history: 28% digital adoption rate
- Programs with 8-15 years competitive history: 64% digital adoption rate
- Programs with 16-25 years competitive history: 81% digital adoption rate
- Programs with 25+ years competitive history: 92% digital adoption rate
This progression suggests digital recognition becomes nearly inevitable for sustained successful programs as accumulated achievements overwhelm traditional display capacity regardless of initial resistance or preference for conventional approaches.
Hybrid Recognition System Prevalence
Rather than completely replacing traditional recognition, most chapters implement hybrid approaches combining physical and digital elements.
Common Hybrid Recognition Configurations
Among digitally-enabled chapters (N=172):
- 68% maintain trophy cases for recent premier achievements (typically past 2-5 years) while digital archives showcase complete history
- 54% preserve officer plaque walls for traditional visibility while digital displays provide multimedia officer profiles
- 71% retain physical championship banners or special recognition elements for symbolic and cultural value
- 89% implement digital displays as primary recognition infrastructure while maintaining selective traditional elements
Only 19 chapters (11% of digitally-enabled sample) completely eliminated traditional recognition in favor of fully digital approaches—demonstrating that technology typically augments rather than replaces conventional recognition, creating complementary systems leveraging strengths of both approaches.
Optimal Hybrid System Design Patterns
Chapters reported highest satisfaction (on 1-10 satisfaction scales, N=142 adviser surveys) with hybrid configurations that:
- Use trophy cases for rotating 2-3 year premier achievement displays (mean satisfaction: 8.7)
- Maintain officer plaque walls for traditional ceremonial recognition (mean satisfaction: 8.3)
- Deploy digital displays as comprehensive recognition archives showcasing complete chapter history (mean satisfaction: 9.1)
- Integrate physical and digital recognition in close proximity when possible (mean satisfaction: 8.9)
This suggests optimal recognition strategies combine traditional elements that chapters and communities value symbolically with digital infrastructure addressing capacity, maintenance, and storytelling limitations that physical systems cannot overcome.
Digital Recognition System Characteristics
Analysis of digital recognition implementations (N=172) reveals common platform characteristics and deployment patterns.
Platform Selection Patterns
- 78% implemented purpose-built educational recognition platforms (e.g., Rocket Alumni Solutions) specifically designed for school achievement display
- 16% adapted general digital signage systems (e.g., ScreenCloud, Rise Vision) for recognition content
- 6% developed custom solutions through school technology departments or student programming projects
Purpose-built platforms demonstrated significantly higher satisfaction ratings (mean 8.8 versus 6.4 for adapted general signage) and lower implementation challenges, suggesting that specialized recognition software provides superior outcomes despite potentially higher costs compared to generic alternatives. This aligns with findings from touchscreen software evaluation research demonstrating that domain-specific platforms reduce implementation complexity and enhance user engagement.
Hardware Deployment Characteristics
Display hardware selection patterns among digital recognition implementations:
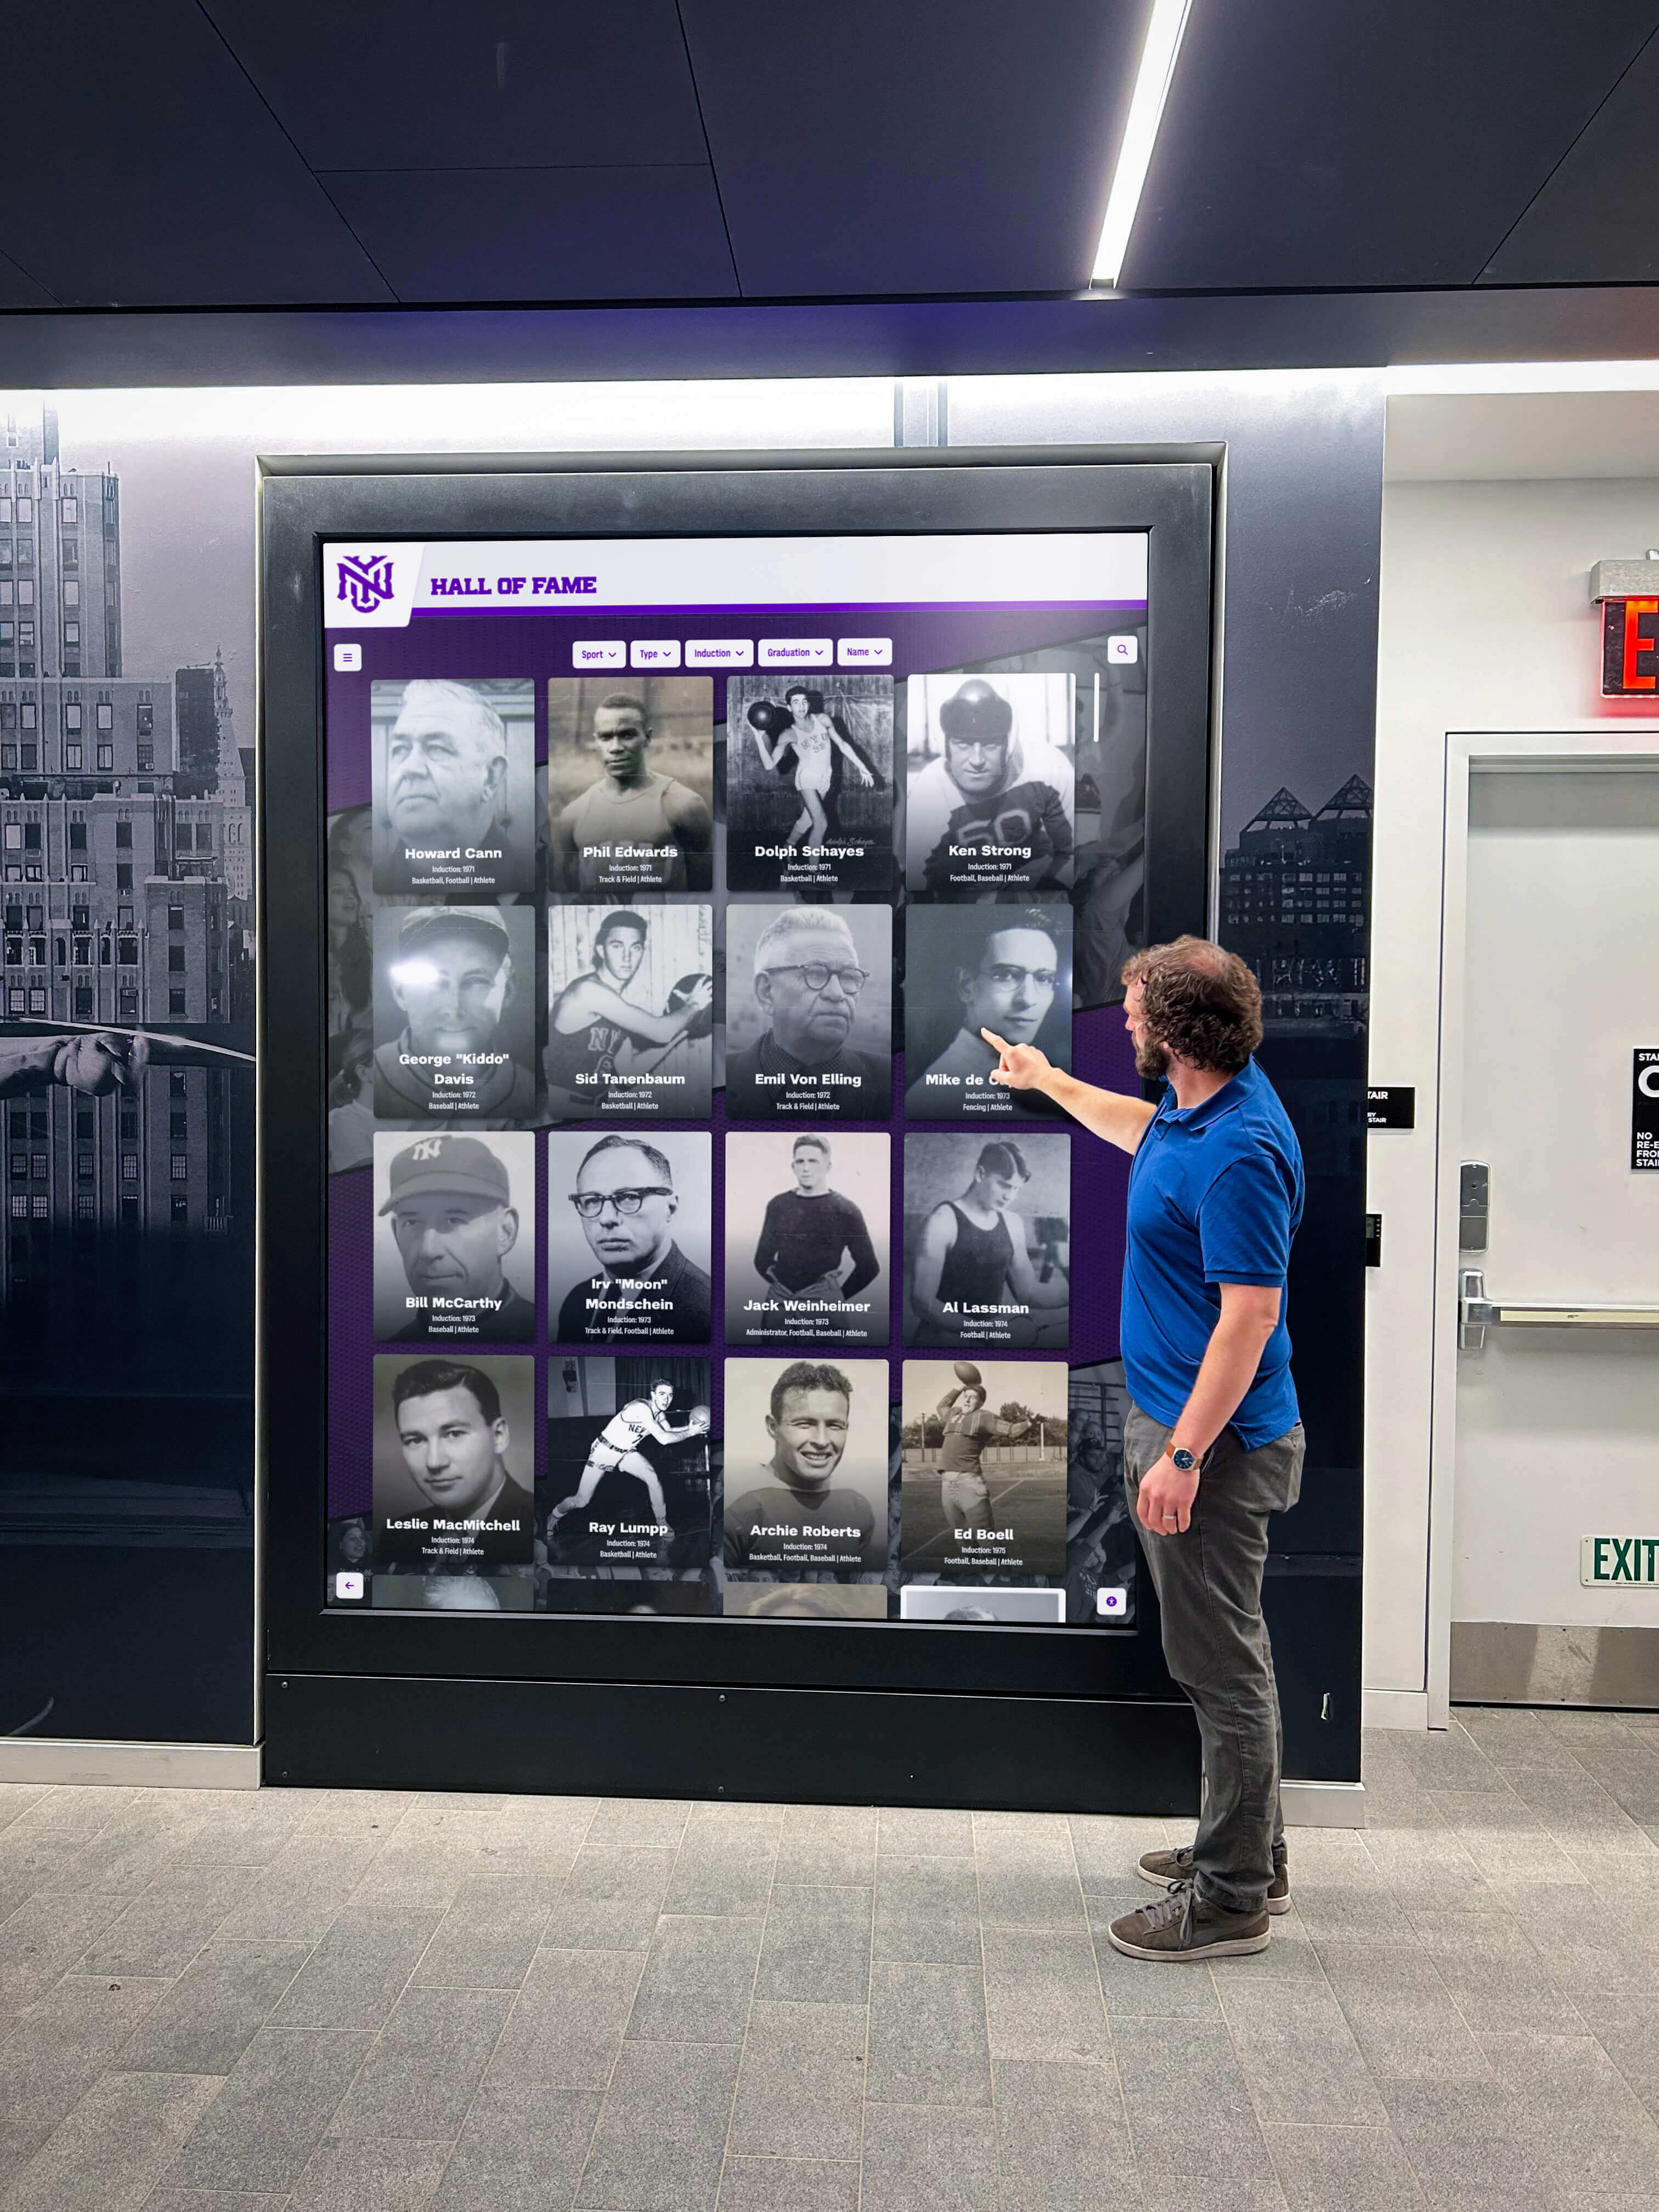
- Median display size: 55 inches (range: 43-86 inches)
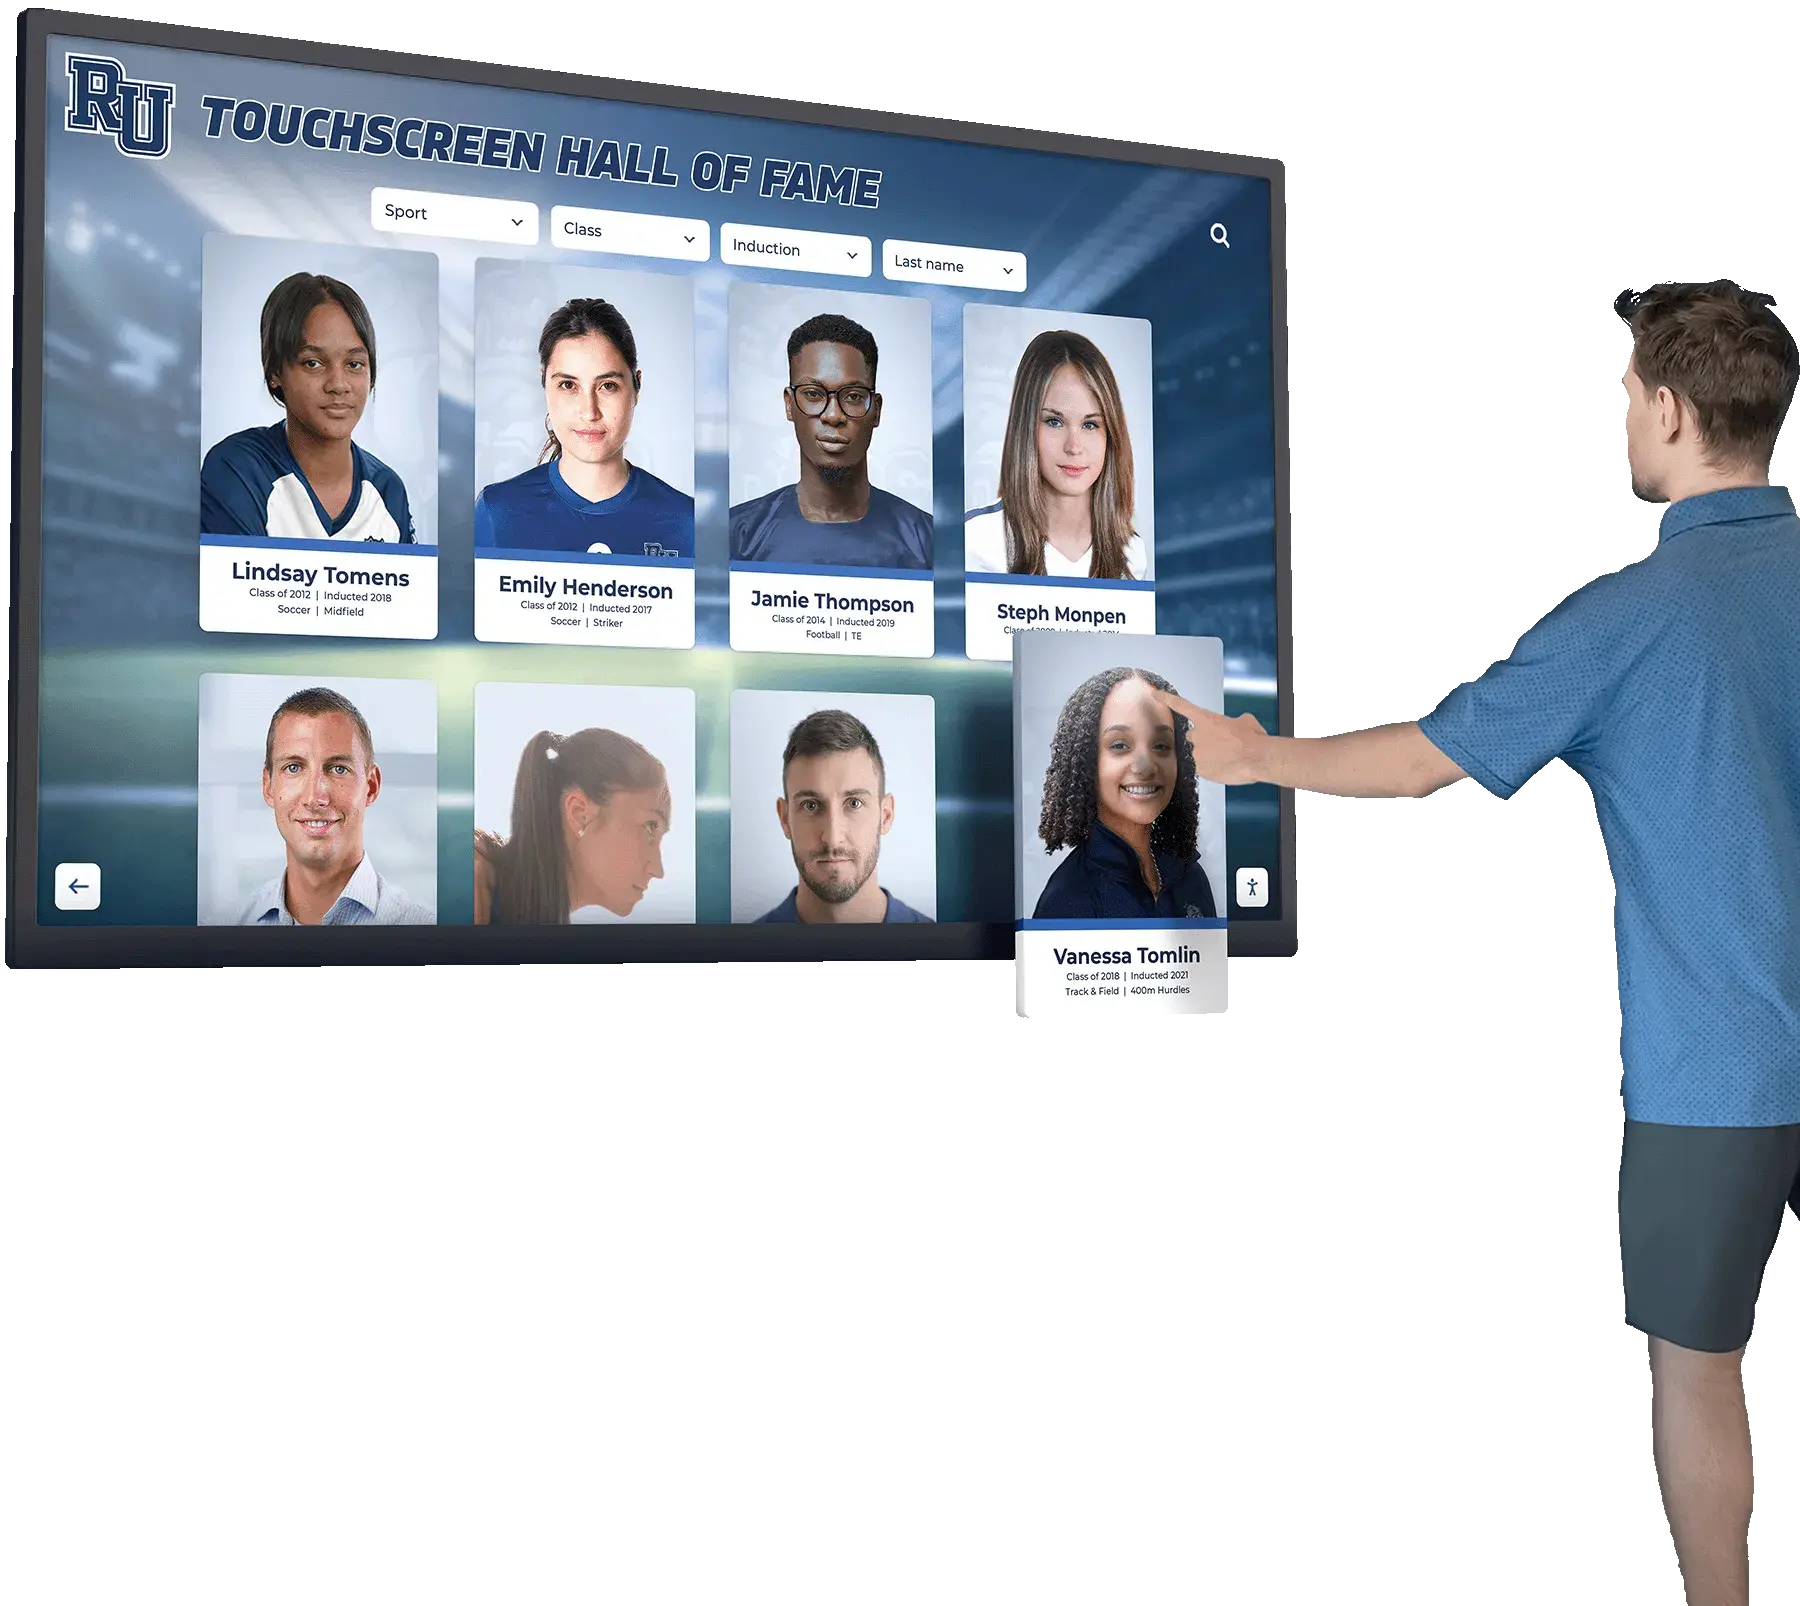
- Touchscreen adoption: 83% implemented interactive touchscreen displays versus 17% non-interactive displays
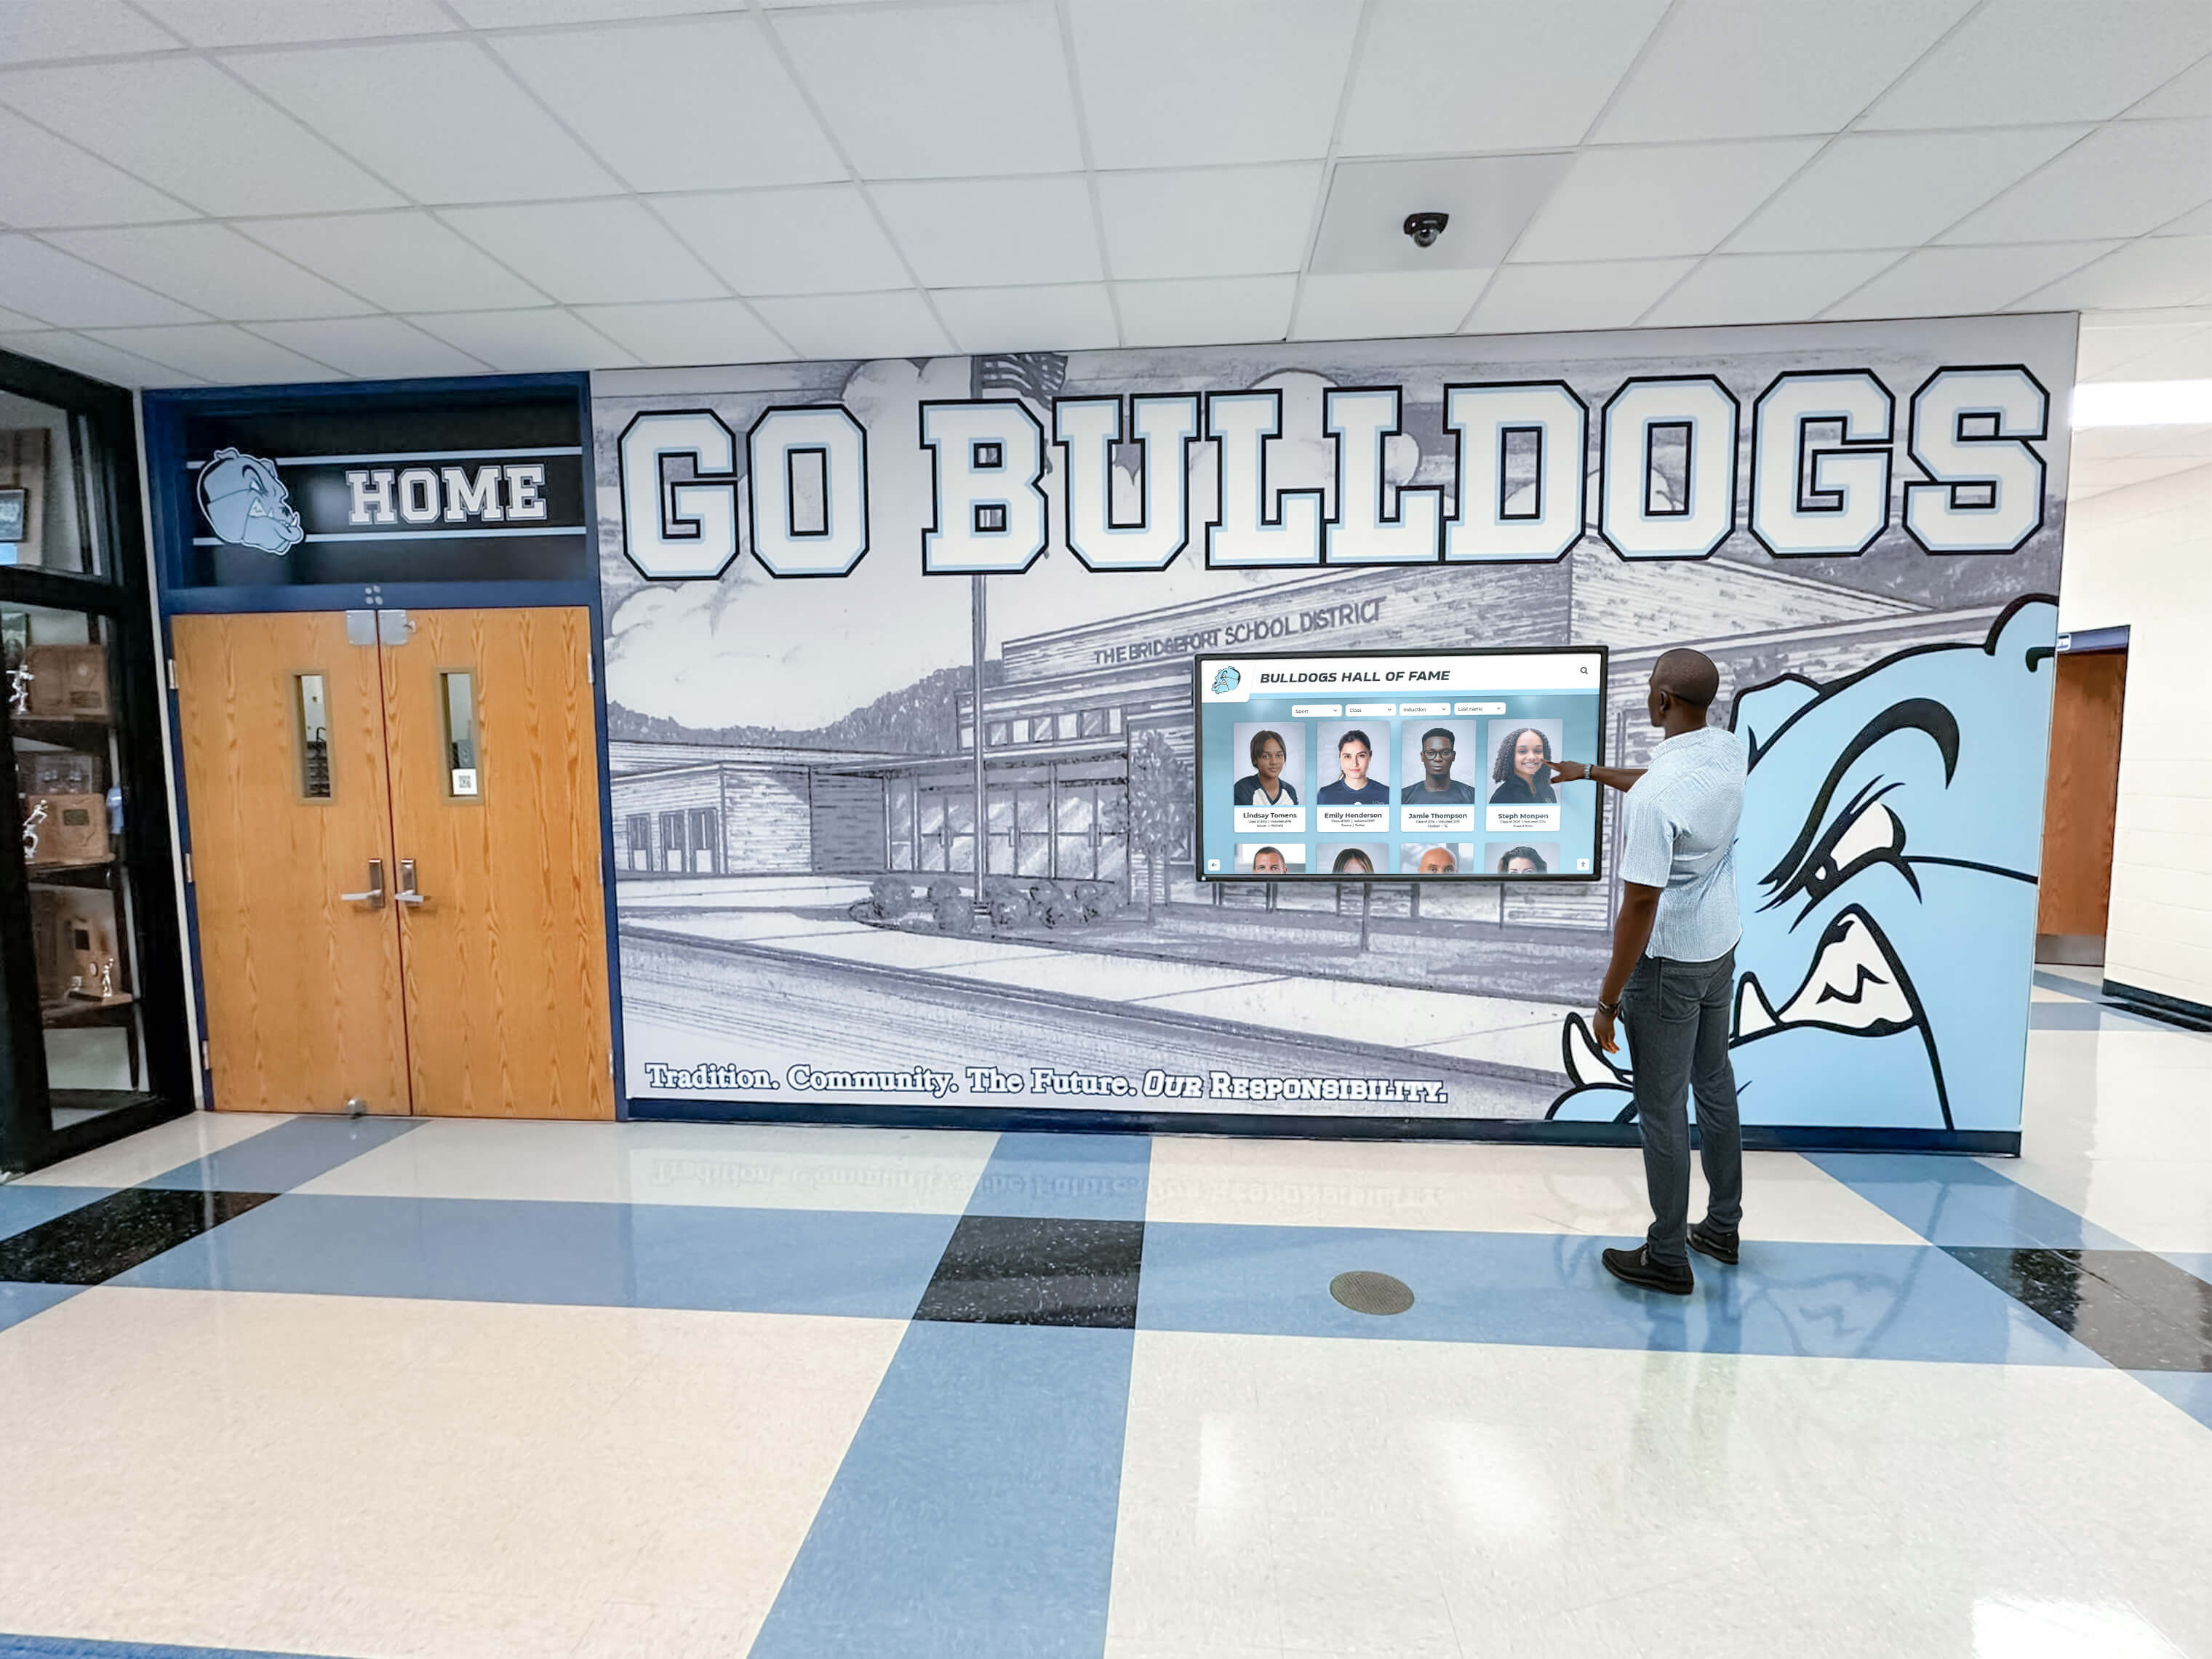
- Placement locations: 62% in CTE classrooms or adjacent hallways, 28% in school main entrances or commons areas, 10% in career centers or guidance offices
- Multiple display deployments: 31% of chapters installed 2-3 displays in different school locations for maximum visibility
Interactive touchscreen implementations demonstrated significantly higher student engagement metrics (median 4.7 interactions per school day versus 0.8 for non-interactive displays), validating the investment in touch-enabled hardware for optimal recognition program effectiveness. Implementation best practices from interactive touchscreen software deployments emphasize the importance of intuitive navigation and responsive design for maximizing student engagement.
Recognition System Effectiveness Metrics
Student Engagement with Recognition Systems
Digital recognition platforms provide engagement analytics unavailable with traditional recognition, enabling quantitative assessment of recognition system utilization.
Daily Interaction Patterns (based on analytics from N=127 digital implementations):
- Median daily sessions: 4.7 student interactions with touchscreen displays
- Median session duration: 2 minutes 18 seconds per interaction
- Peak usage times: 47% of interactions during passing periods, 31% during lunch periods, 22% before/after school
- Content interaction depth: median 3.4 profiles or pages viewed per session
For context, passive traditional recognition (trophy cases, plaque walls) generates no comparable interaction metrics, though observation-based estimates suggest significantly lower engagement as students rarely stop to examine static displays after initial installation familiarity.
Search and Discovery Behavior
Analysis of how students explore digital recognition content:
- 42% of sessions initiated through direct name search (students finding themselves or specific peers)
- 31% through category browsing (competitive events, officer recognition, specific years)
- 18% through featured content rotation (automated highlights of recent achievements)
- 9% through random exploration or “discover” features
This diverse interaction pattern demonstrates that multiple navigation pathways serve different user intentions, ensuring recognition reaches students seeking specific information alongside those casually exploring chapter history and achievement.
Engagement Patterns by User Type
When digital recognition platforms include login features enabling user identification (N=43 implementations):
- Current chapter members: median 8.2 interactions per month
- General student body (non-members): median 1.4 interactions per month
- Faculty and staff: median 2.6 interactions per month
- Alumni and family members (via web access): median 3.8 interactions per month
The alumni and family engagement particularly demonstrates digital recognition’s extended reach beyond physical school locations—traditional trophy cases serve only those present in buildings, while web-accessible digital platforms enable recognition to connect with broader stakeholder audiences including alumni maintaining chapter connections years after graduation. This extended accessibility aligns with digital alumni engagement strategies that leverage technology to maintain lifelong connections with program graduates.
Recognition Program Impact on Chapter Outcomes
While isolating recognition program impact from other variables proves methodologically challenging, chapters implementing enhanced recognition systems report measurable outcome improvements.
Member Recruitment and Retention Effects (based on N=89 chapters providing pre/post implementation data):
Following digital or substantially enhanced traditional recognition implementation:
- Median new member recruitment increase: 14% year-over-year growth versus pre-implementation baseline
- Member retention semester-to-semester: improvement from 83% baseline to 89% post-implementation (median values)
- Officer candidate pool expansion: median 32% increase in members seeking leadership positions
While these improvements cannot be attributed solely to recognition system changes (chapters often implement recognition alongside other program enhancements), advisers consistently cited recognition visibility as contributing factor in recruitment conversations and member engagement discussions.
Competitive Participation Effects
Chapters implementing enhanced recognition systems reported competitive event participation pattern shifts:
- Breadth of events entered: median 18% increase in number of different competitive events with chapter participation
- Depth of participation: median 23% increase in number of members competing (versus only established competitors)
- Repeat participation rates: improvement from 67% to 76% of competitors returning for additional years
Enhanced recognition visibility appears to inspire broader member participation in competitive opportunities, though causation cannot be definitively established—chapters motivated to improve recognition may simultaneously implement other engagement strategies producing these outcomes.
School and Community Awareness Improvements
Following digital recognition implementation with displays in high-traffic school locations:
- School administrator awareness of chapter achievements: 78% of advisers reported improved administrator awareness and support
- General student body awareness: 64% reported increased non-member awareness of FBLA/FFA programs
- Family engagement: 71% reported improved family awareness of student achievements through web-accessible recognition
- Community business partner awareness: 43% reported enhanced community perception of program quality
These awareness improvements translate to practical benefits including administrative support for program resources, enhanced recruitment as prospective members see visible success, and stronger community partnerships supporting chapter activities and member opportunities.
Space Utilization and Facility Planning Implications
Recognition System Space Requirements Comparison
Traditional and digital recognition approaches consume vastly different physical space, with implications for facility planning and multi-program accommodation.
Traditional Recognition Space Footprints
Based on measurement data from facility assessments (N=198 traditional recognition implementations):
Comprehensive FBLA/FFA recognition for established program (10-20 years competitive history):
- Trophy case space: 8-14 linear feet median requirement for adequate capacity
- Plaque wall space: 60-120 square feet for officer walls and achievement plaques
- Bulletin board/hallway display: 40-80 square feet for current recognition visibility
- Total linear wall space equivalent: approximately 25-40 feet dedicated to organization recognition
This substantial space requirement creates direct competition with other school programs seeking limited trophy case and display area, often relegating FBLA/FFA recognition to less visible locations when athletic or academic programs receive priority placement.
Digital Recognition Space Footprints
Digital recognition systems occupy dramatically less physical space while providing superior capacity:
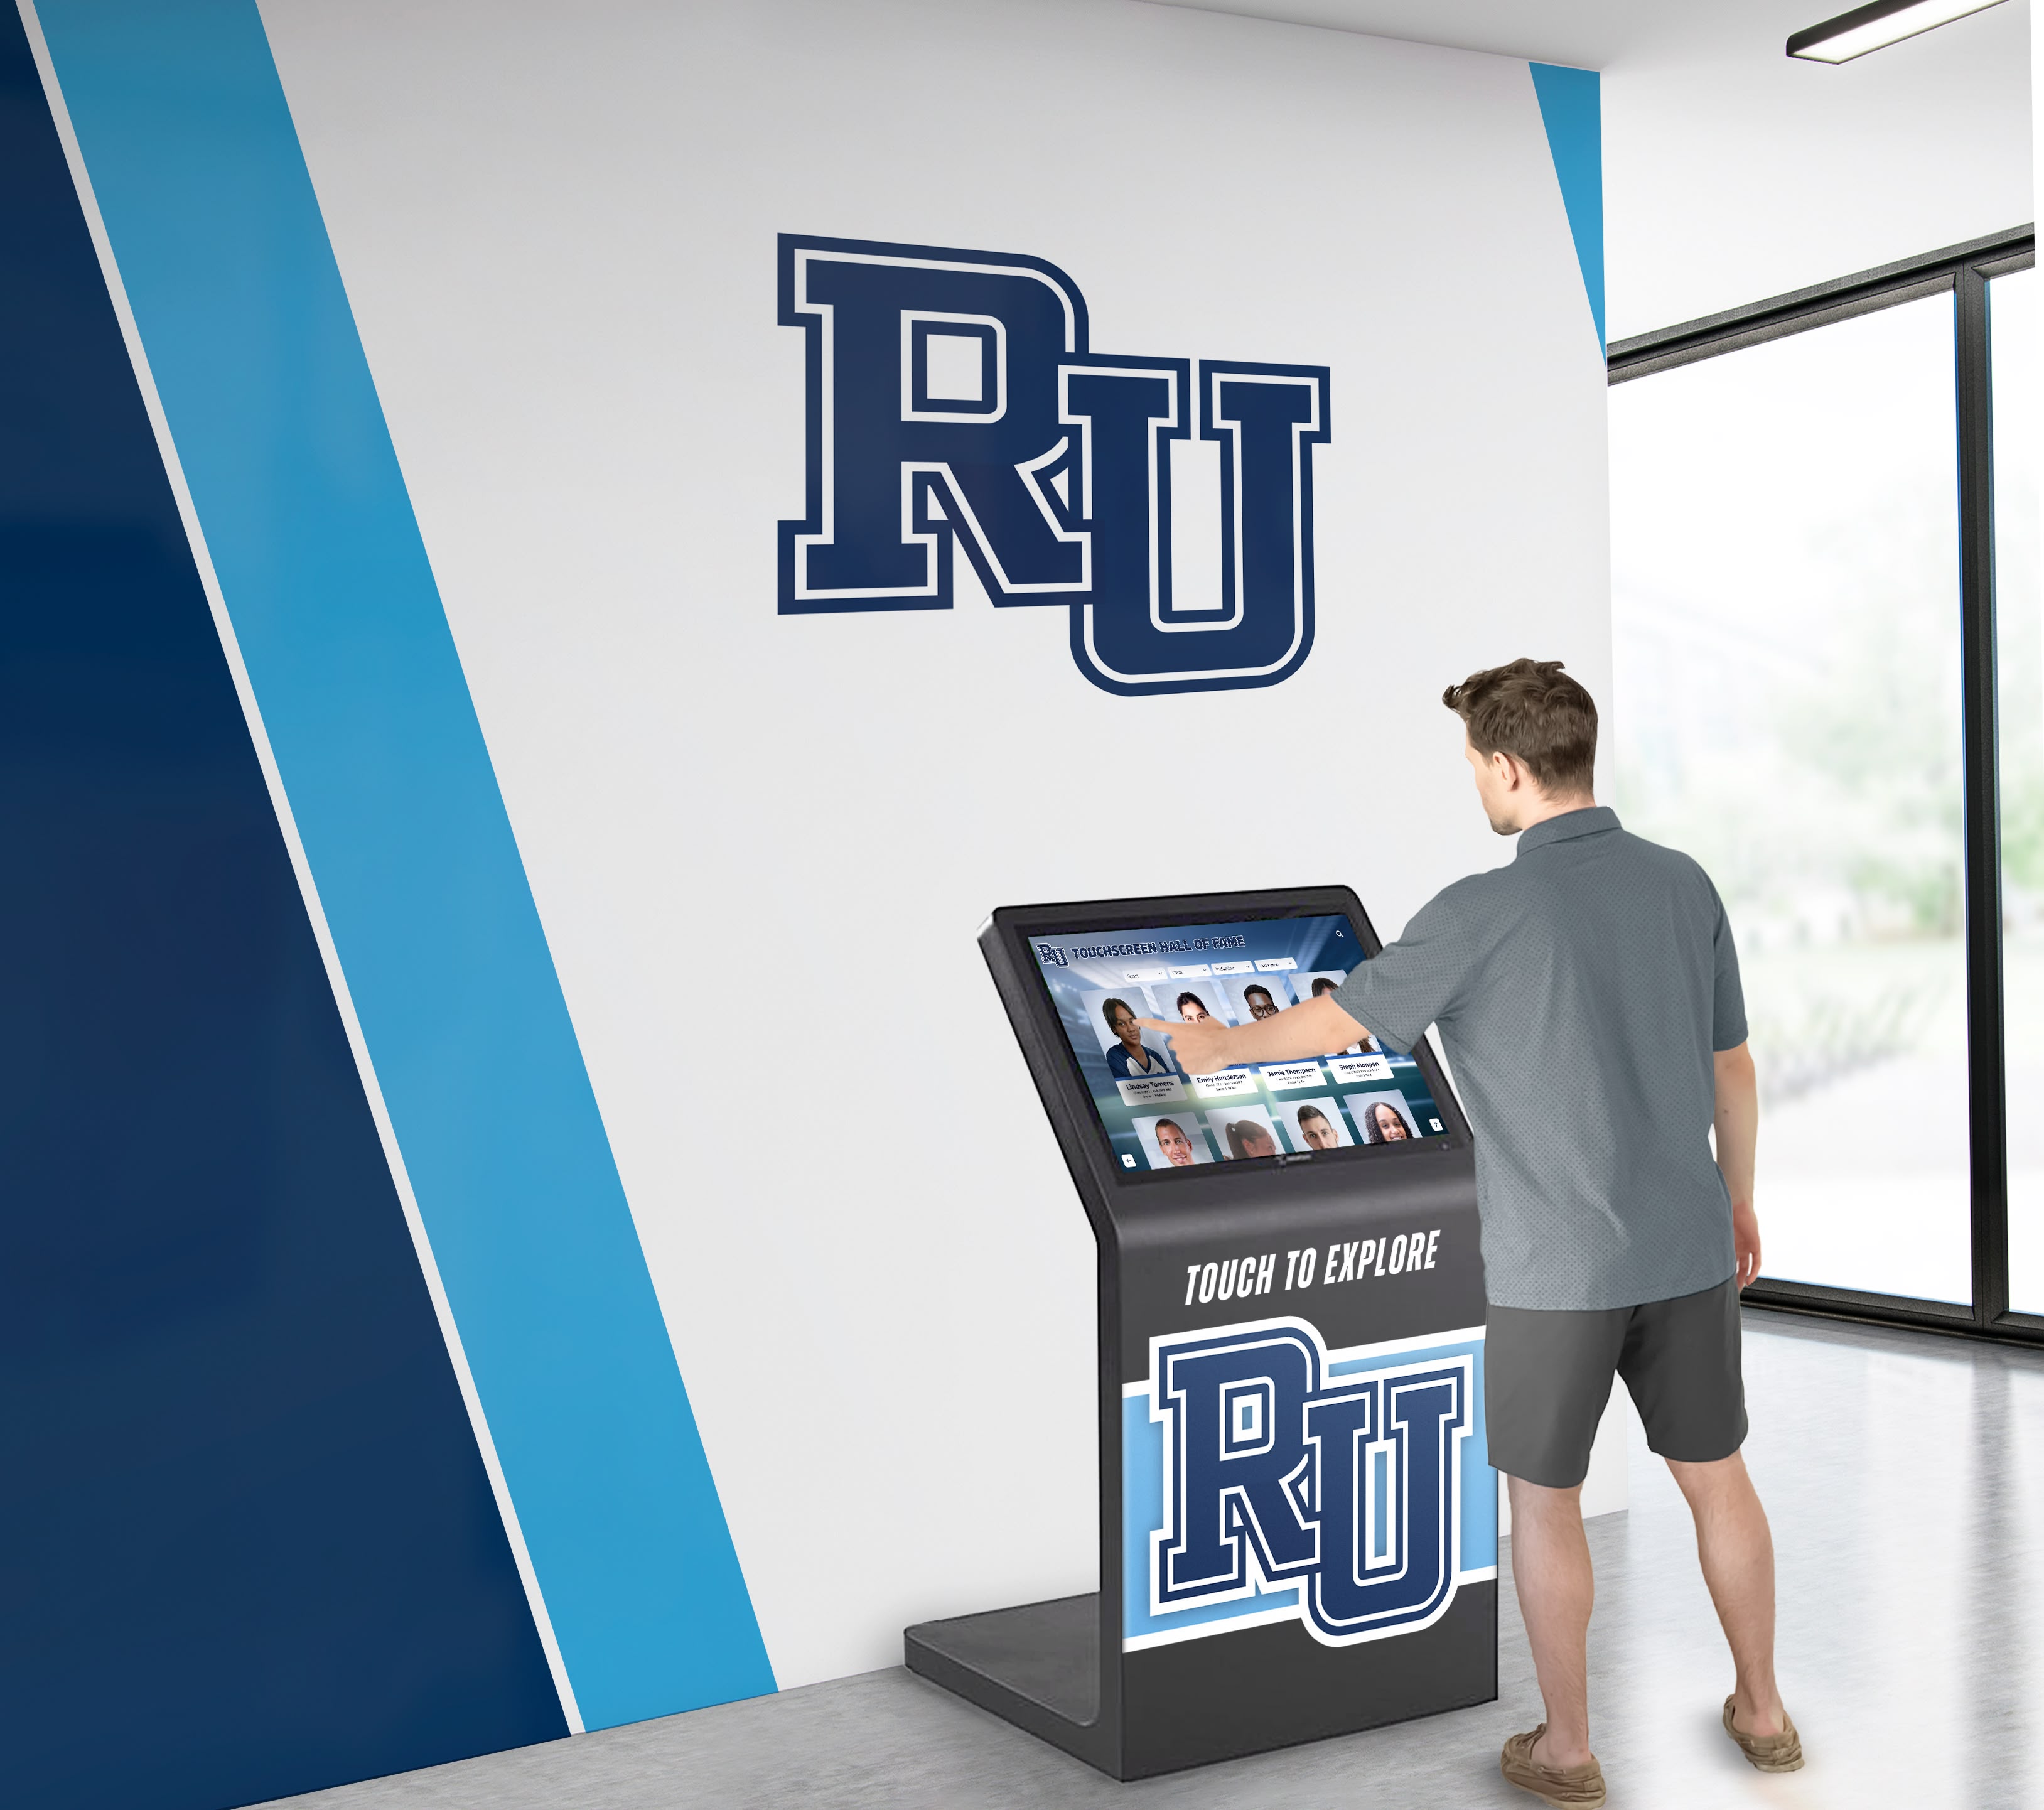
- Single 55-inch touchscreen display: approximately 4 feet of wall space (including mounting clearance)
- Kiosk-style floor-standing displays: approximately 6-8 square feet floor space
- Capacity: unlimited recognition entries regardless of physical footprint
For context, a single digital display occupying 4 linear feet provides recognition capacity equivalent to 50-100+ linear feet of traditional trophy cases and plaque walls—representing 90-95% space reduction while accommodating unlimited future growth.
This space efficiency proves particularly valuable in schools where multiple programs compete for limited recognition infrastructure, allowing FBLA/FFA chapters to maintain comprehensive recognition without displacing other programs or consuming disproportionate facility resources. Similar space efficiency benefits appear in CTE program digital recognition implementations across diverse facility contexts.
Facility Planning Recommendations for CTE Programs
Based on recognition system implementation patterns and space utilization data, we present facility planning recommendations for schools establishing or renovating CTE program recognition infrastructure.
For New CTE Facilities or Major Renovations
When designing purpose-built CTE facilities or conducting major renovations with recognition infrastructure planning:
Option 1: Digital-Primary Hybrid Systems (recommended for programs expecting sustained competitive success):
- Allocate 4-6 feet of prominent wall space in main CTE area for large-format touchscreen recognition display
- Include 4-6 feet trophy case space for rotating premier awards (most recent 2-3 years)
- Reserve 20-30 square feet plaque wall space for officer recognition maintaining traditional ceremonial elements
- Total space allocation: approximately 15 feet linear wall space versus 30-50 feet for traditional-only systems
Option 2: Traditional-Only Systems with Expansion Capacity (for developing programs or technology-resistant contexts):
- Allocate initial 8-10 feet trophy case space with structural capacity for future 4-6 foot expansion
- Plan 60-80 square feet plaque wall space with adjacent expansion area reserved
- Include 40-60 square feet bulletin board or rotating display space
- Explicitly document expansion pathways and reserved adjacent space for future growth
- Total space allocation: 30-40 feet linear wall space with clear expansion plan
For Existing Facilities with Limited Modification Capacity
When working within existing facility constraints limiting major recognition infrastructure changes:
- Prioritize digital display additions in existing high-traffic areas (near existing trophy cases, main hallways, career centers)
- Implement hybrid approaches maintaining existing traditional recognition while adding digital components addressing capacity limitations
- Consider kiosk-style floor-standing digital displays when wall mounting proves impractical due to existing infrastructure
- Pursue creative placement solutions including CTE classroom installations where dedicated common area space unavailable
Comparative Analysis: FBLA vs. FFA Recognition Patterns
While both organizations share similar recognition challenges, subtle differences in program focus and competitive structures create distinct recognition pattern variations.
Recognition System Preference Differences
FBLA chapters demonstrated slightly higher traditional recognition preference:
- FBLA chapters with traditional-only recognition: 43% (N=127 total FBLA chapters in sample)
- FFA chapters with traditional-only recognition: 35% (N=156 total FFA chapters in sample)
This difference likely reflects FBLA’s business education context emphasizing corporate and professional settings where traditional awards maintain stronger cultural resonance compared to FFA’s agricultural and hands-on project focus where practical achievement documentation may carry greater emphasis than ceremonial trophies.
Award Volume and Display Requirements
FFA chapters accumulated slightly higher median annual award volume:
- FFA median annual awards requiring display: 8.7 trophies/plaques
- FBLA median annual awards requiring display: 7.3 trophies/plaques
This differential reflects FFA competitive event structures including substantial project-based competitions (Supervised Agricultural Experience projects, Agriscience Fair competitions) generating individual awards beyond team competitive events, while FBLA competitions concentrate more heavily in team-based categories producing fewer individual awards per participating member.
Display Location Preferences
Recognition placement patterns differed between organizations:
FBLA placement emphasis:
- 58% in business education classrooms or adjacent hallways
- 28% in school main entrances or commons areas
- 14% in career centers or guidance offices
FFA placement emphasis:
- 67% in agricultural education facilities or adjacent hallways
- 19% in school main entrances or commons areas
- 14% in career centers or ag shops
FFA’s higher concentration in specialized agricultural education facilities reflects the organization’s technical program focus and frequent operation in dedicated ag buildings separate from main school structures, while FBLA’s business education context embeds more fully in general school facilities creating greater integration opportunities with broader school traffic patterns.
Implementation Cost-Benefit Analysis
Total Cost of Ownership: Traditional vs. Digital Recognition
Comprehensive cost analysis accounting for initial investment, recurring costs, and maintenance burden reveals nuanced total ownership comparisons.
Traditional Recognition 10-Year Total Cost of Ownership (median values, established competitive chapter):
Initial infrastructure:
- Trophy cases (8-10 linear feet capacity): $1,200-$2,400
- Plaque wall installation (materials, mounting hardware): $400-$800
- Bulletin board displays: $200-$400
- Initial infrastructure subtotal: $1,800-$3,600
Recurring awards and materials (annual costs × 10 years):
- Trophies and awards: $340/year × 10 = $3,400
- Plaques: $285/year × 10 = $2,850
- Bulletin board materials and printing: $180/year × 10 = $1,800
- Recurring costs subtotal: $8,050
Maintenance time burden (valued at $35/hour adviser time × hours):
- Annual maintenance hours: 18.7 hours
- 10-year maintenance: 187 hours × $35 = $6,545
Traditional recognition 10-year total cost of ownership: $16,395-$18,195
Digital Recognition 10-Year Total Cost of Ownership (median values, purpose-built recognition platform):
Initial infrastructure:
- 55-inch touchscreen display with mounting: $3,500-$5,000
- Installation and configuration: $500-$1,000
- Initial content setup (often included in platform service): $0-$800
- Initial infrastructure subtotal: $4,000-$6,800
Recurring platform and maintenance costs:
- Annual software subscription: $1,200-$1,800/year
- 10-year subscription costs: $12,000-$18,000
- Hardware maintenance/replacement (estimated amortized): $200/year × 10 = $2,000
Maintenance time burden (valued at $35/hour adviser time × hours):
- Annual maintenance hours: 4.2 hours (primarily content updates)
- 10-year maintenance: 42 hours × $35 = $1,470
Optional supplementary traditional elements:
- Selective trophy display: $600 initial + $1,200 recurring = $1,800
- Officer plaque wall: $800 initial + $2,000 recurring = $2,800
Digital recognition 10-year total cost of ownership: $19,470-$27,270 (digital only) or $22,070-$31,870 (hybrid with selective traditional elements)
This analysis demonstrates that digital recognition carries higher absolute costs over 10-year periods, though the differential narrows substantially when adviser time savings are valued appropriately. Chapters must weigh higher financial costs against significant time burden reduction, dramatically superior capacity enabling comprehensive recognition without forced rotation or removal, enhanced engagement through interactive multimedia experiences, and extended reach through web accessibility serving alumni and families beyond school walls.
For many chapters, the additional $3,000-$8,000 over 10 years represents worthwhile investment for these benefits, particularly when adviser time constraints limit ability to maintain comprehensive traditional recognition or when trophy case capacity exhaustion forces difficult decisions about which achievements warrant continued visibility.
Key Findings Summary: Recognition System Benchmark Data
Trophy Case and Traditional Recognition Constraints
- Highly competitive FBLA/FFA chapters exhaust initially allocated trophy case capacity within 5.1 years (median), forcing removal or rotation of earned awards
- Plaque wall systems reach capacity within 12.4 years (median) for officer recognition, requiring expansion or discontinuation decisions
- 47% of chapters resort to rotating displays, removing older trophies to accommodate new achievements—creating institutional memory loss and disconnecting current members from chapter legacy
- Traditional recognition systems require median 18.7 hours annual adviser time for maintenance, representing nearly five full school days dedicated to recognition updates alone
Digital Recognition Adoption Patterns
- 60.8% of chapters in sample have transitioned from purely traditional to digital or hybrid recognition systems
- Trophy case capacity exhaustion emerged as primary adoption driver (43% of implementations), demonstrating that digital transition often represents practical response to traditional system limitations rather than technology enthusiasm
- Digital adoption correlates strongly with program maturity: 92% of chapters with 25+ years competitive history have implemented digital recognition, versus 28% of programs with 3-7 years history
- 68% of digitally-enabled chapters maintain hybrid approaches preserving selective traditional elements (recent premier trophies, officer plaques) while digital systems provide comprehensive historical archives
Recognition Effectiveness and Engagement
- Interactive touchscreen recognition displays generate median 4.7 student interactions daily with median 2:18 session duration, enabling quantifiable engagement measurement impossible with traditional static displays
- Chapters implementing enhanced recognition systems reported median 14% new member recruitment growth and 32% increase in officer candidate pools, though causation cannot be definitively isolated from other simultaneous program improvements
- Digital recognition extends reach beyond physical school locations: alumni and family members via web access generate median 3.8 monthly interactions, maintaining connection to chapter legacy years after member graduation
- 78% of advisers reported improved school administrator awareness and support following digital recognition implementation with displays in high-traffic locations
Space Utilization and Cost Implications
- Comprehensive traditional recognition for established chapters requires 25-40 linear feet wall space equivalent for trophy cases, plaque walls, and displays—creating direct competition with other programs for limited school recognition infrastructure
- Single digital display occupies approximately 4 feet wall space while providing recognition capacity equivalent to 50-100+ feet of traditional trophy cases—representing 90-95% space reduction with unlimited future growth
- Traditional recognition 10-year total cost of ownership: $16,395-$18,195 (including awards, infrastructure, and valued adviser time)
- Digital recognition 10-year total cost of ownership: $19,470-$27,270 (digital only) or $22,070-$31,870 (hybrid with selective traditional elements)
- Digital systems carry higher absolute costs but provide dramatic time savings (median 14.5 fewer annual hours), unlimited capacity, and enhanced engagement justifying differential for many chapters
Implementation Recommendations for FBLA and FFA Chapters
Based on benchmark data analysis, we present evidence-based recommendations for chapters at various program development stages considering recognition system establishment or enhancement.
For Developing Chapters (0-5 Years Competitive History)
Recommended Approach: Traditional Recognition with Digital Planning
Developing chapters should implement cost-effective traditional recognition while planning for eventual digital transition:
- Begin with modest trophy case allocation (4-6 feet) sufficient for 5-8 years given typical early-stage award accumulation rates
- Implement simple plaque systems for officer recognition maintaining affordable scale
- Reserve budget and facility space for future digital expansion when competitive success and award volume justify transition
- Document achievements systematically (photos, detailed descriptions, results data) creating content library enabling efficient digital migration when capacity constraints emerge
This approach minimizes initial investment while chapters build competitive programs and membership, deferring higher digital costs until trophy accumulation and program maturity create clear need justifying the investment.
For Established Competitive Chapters (6-15 Years History)
Recommended Approach: Hybrid Recognition Systems
Chapters in this maturity range typically face emerging capacity constraints making hybrid recognition optimal:
- Implement digital displays as primary comprehensive recognition infrastructure showcasing complete chapter history without physical space limitations
- Maintain selective traditional elements including recent premier trophies (past 2-3 years) in prominent trophy cases and officer plaque walls for ceremonial significance
- Prioritize touchscreen interactivity enabling active student exploration versus passive viewing, following proven patterns from successful student achievement display implementations
- Deploy displays in high-traffic school locations (main entrances, cafeterias, career centers) maximizing visibility beyond CTE classroom areas where only existing members congregate
Hybrid approaches leverage traditional recognition’s cultural resonance and symbolic value while digital systems address capacity, maintenance, and storytelling limitations that physical recognition cannot overcome.
For Mature Legacy Chapters (15+ Years History)
Recommended Approach: Digital-Primary Recognition with Traditional Accents
Chapters with substantial competitive history accumulation should prioritize digital infrastructure:
- Implement comprehensive digital recognition platform showcasing complete chapter history spanning decades
- Include archived historical content from early program years creating institutional memory and legacy connection
- Maintain minimal traditional elements (single rotating trophy case with most recent premier awards, dedicated officer plaque wall if space permits)
- Consider multiple digital display deployments in various school locations maximizing recognition visibility across diverse student populations
- Enable web access allowing alumni from all graduation cohorts to explore their archived achievements, strengthening multi-generational chapter community
For mature programs, digital recognition’s unlimited capacity proves essential—attempting to display 15-25 years of accumulated trophies and plaques physically becomes practically impossible within reasonable facility space allocations.
Budget-Constrained Implementation Strategies
Chapters operating with limited budgets can still implement effective recognition enhancement:
Phase 1: Optimize Traditional Recognition
- Implement systematic photography documentation of all achievements creating digital content library
- Establish simple social media recognition using free platforms (Instagram, Facebook) for timely acknowledgment
- Create shared Google Sites or free website builder pages showcasing achievements beyond physical display limitations
- Cost: minimal (primarily adviser/officer time investment)
Phase 2: Entry-Level Digital Recognition
- Consider adapted general digital signage solutions (lower cost than purpose-built platforms but requiring more technical configuration)
- Explore non-interactive display options (significantly lower hardware costs than touchscreen displays)
- Pursue grant opportunities from local businesses, state CTE funding programs, or national organization resources
- Review digital signage software comparison research to identify cost-effective platforms meeting chapter needs
- Cost: $1,500-$3,500 initial investment with lower recurring costs
Phase 3: Comprehensive Digital Recognition
- Transition to purpose-built educational recognition platforms providing superior user experience and engagement
- Upgrade to touchscreen interactive displays generating significantly higher student interaction rates
- Implement web accessibility extending recognition reach to alumni and family audiences
- Cost: $4,000-$6,800 initial investment with $1,200-$1,800 annual recurring platform costs
This phased approach allows chapters to progress incrementally as budgets permit rather than delaying recognition improvements until comprehensive funding becomes available.
Facility Planning Guidelines for Schools and Districts
School administrators and facility planners supporting multiple CTE programs should implement recognition infrastructure strategies accommodating diverse organizational needs within constrained facility resources.
Multi-Program Recognition Consolidation Strategies
Rather than allocating separate recognition space to each CTE organization, consider consolidated recognition hubs:
Shared Digital Recognition Infrastructure
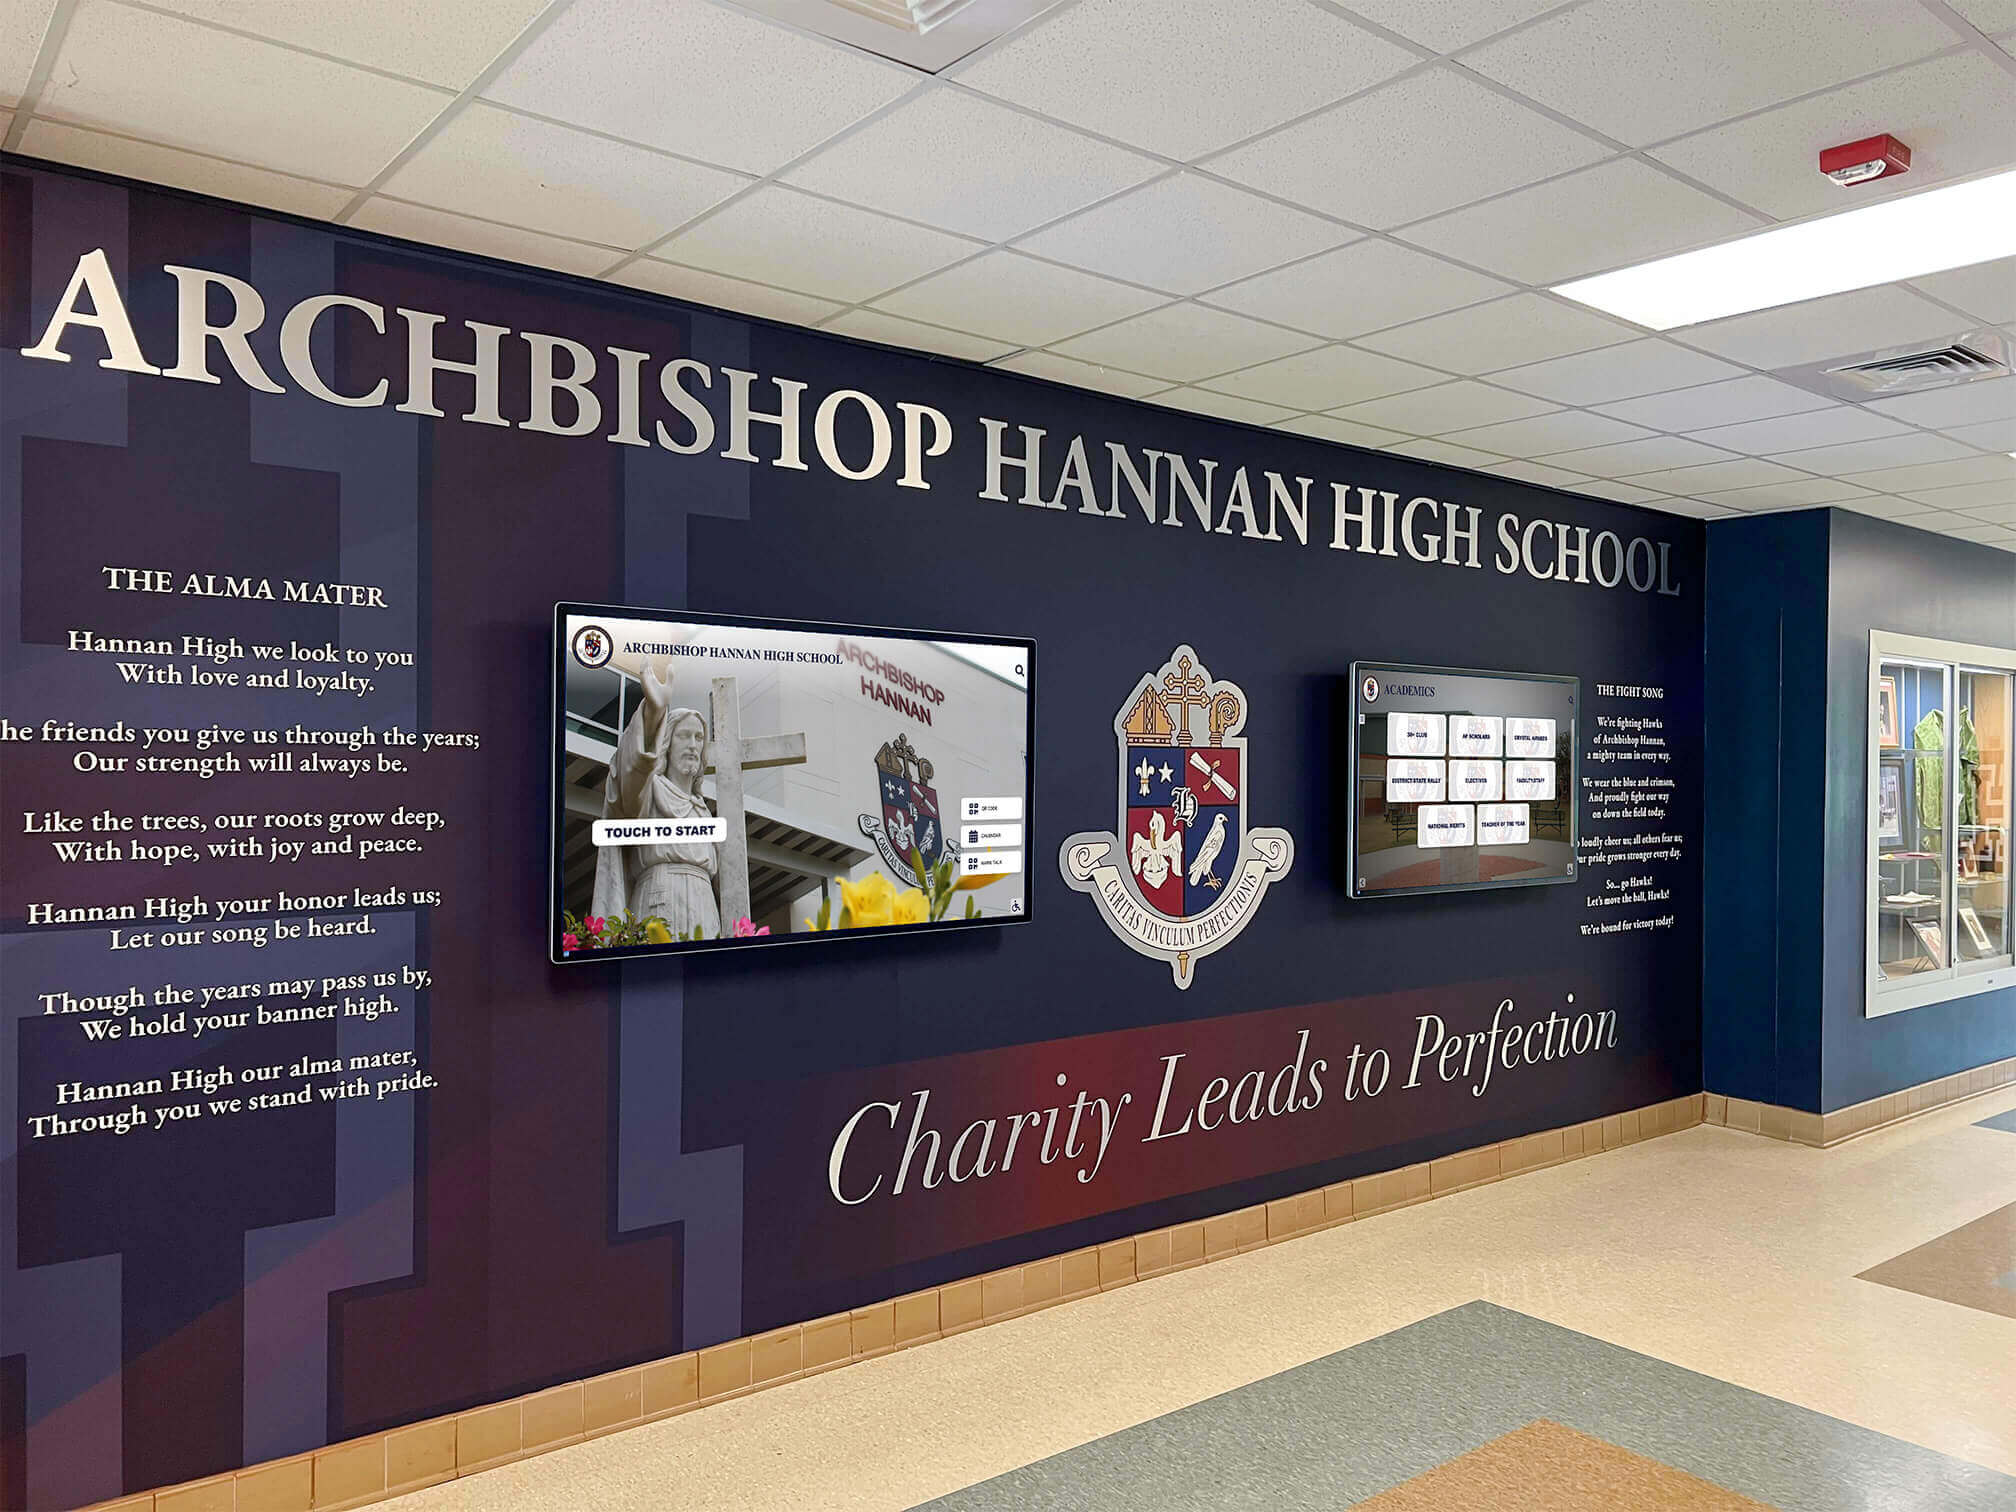
- Deploy 2-3 large-format touchscreen displays in high-traffic school locations (main entrance, career center, cafeteria)
- Configure single recognition platform serving multiple CTE organizations (FBLA, FFA, DECA, SkillsUSA, HOSA, etc.)
- Enable organization-specific browsing and filtering allowing students to explore individual program achievements
- Provide shared content management with organization adviser access for independent updates
Benefits of consolidated approach:
- Dramatically reduced total facility space requirements (6-12 feet total versus 30-50 feet per organization for traditional recognition)
- Increased visibility through premier placement accessible to entire student body versus organization-specific classroom locations
- Enhanced cross-program awareness potentially inspiring students to explore multiple CTE opportunities
- Superior cost-effectiveness distributing infrastructure investment across multiple programs
This consolidation strategy proves particularly valuable in comprehensive high schools where multiple CTE programs compete for limited trophy case and display space, often resulting in inadequate recognition infrastructure for all organizations or priority allocation creating inequities between programs.
New Construction and Renovation Planning Standards
When designing new CTE facilities or conducting major renovations, embed recognition infrastructure planning systematically:
Recommended Recognition Infrastructure Standards
For comprehensive high schools with 3-6 active CTE organizations:
- Allocate wall space and power/data infrastructure for 2-3 large-format digital displays (55-75 inches) in main school areas
- Include 15-20 feet shared trophy case space for rotating premier achievements across all CTE programs
- Reserve 150-200 square feet display wall space enabling traditional recognition for organizations preferring conventional approaches
- Ensure robust network connectivity supporting content management and potential future display additions
For career and technical centers with 6-12+ active CTE organizations:
- Plan dedicated recognition gallery or hallway with space and infrastructure for 4-6 large-format digital displays
- Include substantial shared trophy case infrastructure (30-40 feet) for traditional recognition alongside digital systems
- Provide organization-specific display spaces in dedicated program areas supplementing centralized recognition
- Implement enterprise-grade network infrastructure supporting extensive digital display deployment
These planning standards prevent the capacity constraints and space competition that plague schools attempting to retrofit adequate recognition infrastructure into facilities designed without systematic CTE program consideration. Schools implementing comprehensive recognition systems can learn from athletic wall of honor implementation strategies that successfully balance multiple program needs within shared facility resources.
Conclusion: Recognition Infrastructure as CTE Program Investment
This benchmark analysis demonstrates that FBLA and FFA award displays, trophies, and plaques represent substantial ongoing investments requiring systematic planning, adequate resource allocation, and evidence-based decision-making about recognition approaches. Traditional recognition systems provide cultural familiarity and ceremonial significance but face inherent capacity constraints that successful programs inevitably exhaust within 5-15 years, forcing difficult decisions about award rotation, removal, or expensive infrastructure expansion. Digital recognition systems require higher initial investment and ongoing platform costs but provide unlimited recognition capacity, dramatic maintenance burden reduction, enhanced multimedia storytelling, superior student engagement, and extended reach serving alumni and family audiences beyond physical school locations.
The benchmark data reveals clear patterns: chapters with sustained competitive success overwhelmingly transition to digital or hybrid recognition systems as trophy accumulation exhausts traditional display capacity, with 92% of programs operating 25+ years implementing digital infrastructure. This near-universal adoption among mature programs suggests digital recognition becomes practically inevitable for successful chapters regardless of initial approach preferences. The key decision becomes not whether to eventually adopt digital recognition, but when to implement it—proactively before capacity crises force recognition removal, or reactively after traditional systems fail to accommodate accumulated achievements.
For schools and districts supporting CTE programs, recognition infrastructure warrants systematic planning comparable to other facility resources supporting instruction, competition preparation, and student development. Inadequate recognition infrastructure undermines program culture, limits achievement celebration that motivates continued excellence, and creates administrative burden consuming adviser capacity better directed toward member development and program growth. Investment in purpose-built recognition systems—whether traditional, digital, or hybrid approaches aligned with program maturity and competitive success—represents strategic commitment to CTE program excellence with measurable returns through enhanced member engagement, improved recruitment, and strengthened school and community awareness of student achievement in business leadership and agricultural education.
As chapters enter 2025-2026 program planning, this benchmark data provides quantitative foundation for recognition system decisions grounded in implementation patterns, cost realities, and effectiveness evidence from 280+ programs nationwide. Whether establishing first formal recognition infrastructure or modernizing legacy systems exhausted by accumulated success, evidence-based approaches aligned with program stage, budget realities, and strategic objectives will maximize recognition program impact while ensuring sustainable implementation supporting long-term chapter excellence.
Frequently Asked Questions About FBLA and FFA Recognition Systems
How long does a typical trophy case last before reaching capacity for a competitive FBLA or FFA chapter?
Based on our benchmark data from 283 chapters, highly competitive programs (8+ state events annually with consistent national qualification) exhaust initially allocated trophy case capacity within 5.1 years (median), while moderately competitive chapters (4-7 state events annually) reach capacity within 8.4 years (median). This timeline assumes standard 4-6 foot initial trophy case allocation typical in comprehensive high schools. Chapters can extend capacity through selective display (only premier awards), smaller trophy selection, or condensed arrangements, but these compromises typically diminish recognition prestige and visibility. Ultimately, successful competitive programs face inevitable capacity constraints requiring either continuous physical expansion, rotation/removal of older awards, or transition to alternative recognition approaches with greater capacity.
What’s the typical annual cost for trophies and awards for an active FBLA or FFA chapter?
Median annual trophy and award expenditure is $340 for FBLA chapters and $390 for FFA chapters based on budget analysis from 89 chapters in our sample. However, this varies substantially based on competitive activity level. Developing chapters with 1-3 state events annually may spend only $85-$150, while highly competitive chapters with 15-25 annual awards requiring recognition may spend $800-$1,890 annually. Individual trophy costs typically range from $15-$35 for standard competitive event trophies to $45-$120 for championship or specialized awards. Over a 10-year period, cumulative trophy/award costs reach $3,400 for median FBLA chapters and $3,900 for median FFA chapters, representing substantial ongoing investment that chapters should budget systematically rather than addressing reactively each competition season.
Should our chapter invest in digital recognition displays or stick with traditional trophy cases?
The optimal approach depends on program maturity, competitive success level, budget availability, and adviser time constraints. Our data suggests chapters with 0-5 years competitive history should typically implement traditional recognition initially (lower upfront costs, adequate capacity for development stage), then plan for eventual digital transition. Chapters with 6-15 years history facing emerging capacity constraints benefit most from hybrid recognition combining digital comprehensive archives with selective traditional elements for recent premier achievements. Chapters with 15+ years substantial competitive history should prioritize digital-primary recognition—attempting to display accumulated decades of achievements physically becomes practically impossible within reasonable facility space. Key consideration: if your trophy cases are 75%+ full, if you’re currently storing or removing older awards, or if recognition maintenance consumes 15+ annual adviser hours, digital transition likely provides positive return on investment through capacity expansion, time savings, and enhanced engagement despite higher initial costs.
How much time does it take to maintain traditional versus digital recognition systems?
Based on adviser survey data (N=142), traditional comprehensive recognition systems require median 18.7 annual hours for maintenance including trophy case updates (2.4 hours per major cycle, typically 2-4 times annually), plaque installations (1.8 hours per plaque, typically 1-4 annually), and bulletin board updates (3.1 hours per major update, typically 4-6 annually). This represents nearly five full school days devoted to recognition maintenance alone. Digital recognition systems require substantially less ongoing time—median 4.2 annual hours primarily for content updates following competitions and conferences. The 14.5-hour annual differential represents significant time savings that advisers can redirect toward member development, competition preparation, or program expansion. For context, 14.5 hours equals approximately 0.7% of a typical teacher’s annual work hours—meaningful capacity recovery when adviser time represents primary program constraint limiting growth and member support.
Can digital recognition displays show content from multiple CTE organizations or just one?
Purpose-built educational recognition platforms typically support multi-organization deployments where single display infrastructure serves multiple CTE programs. This consolidated approach proves particularly valuable in comprehensive high schools where FBLA, FFA, DECA, SkillsUSA, HOSA, and other organizations would otherwise compete for limited trophy case and display space. Students can browse organization-specific achievements through category filtering or search functionality, while organization advisers maintain independent content management access for their program updates. Our data shows that 37% of digital recognition implementations in comprehensive high schools serve 2-4 CTE organizations through shared display infrastructure—dramatically reducing total facility space requirements (6-12 feet total for shared digital displays versus 30-50 feet per organization for separate traditional recognition) while actually increasing visibility through premier placement in main school areas reaching entire student body versus organization-specific classroom locations. Schools supporting multiple CTE programs should strongly consider shared recognition infrastructure rather than duplicating separate systems for each organization.
What happens to our existing trophies and plaques if we transition to digital recognition?
Most chapters implement hybrid recognition approaches preserving selective traditional elements rather than completely eliminating physical awards. Typical strategy: maintain trophy case displaying most recent 2-3 years’ premier achievements (rotating older trophies to storage as new awards are earned), preserve officer plaque walls for traditional ceremonial significance if space permits, and implement comprehensive digital displays showcasing complete chapter history including archived older achievements no longer physically displayed. This hybrid approach honors the symbolic and cultural value of physical awards while digital systems address capacity limitations and enable recognition of complete chapter legacy. For historical trophies and plaques no longer displayed physically, high-quality photography during digital content development preserves visual documentation accessible through digital profiles. Only 11% of digitally-enabled chapters in our sample completely eliminated traditional recognition—the overwhelming majority maintain selective traditional elements they and their communities value alongside digital infrastructure providing superior capacity and storytelling capabilities.
Request Research Briefing and Implementation Consultation
This benchmark report presents aggregate data analysis from 283 FBLA and FFA chapter recognition implementations nationwide (2020-2026). Chapters or schools interested in receiving customized recognition planning guidance, detailed implementation case studies from similar programs, or information about purpose-built CTE recognition platforms should contact recognition infrastructure specialists to request a comprehensive briefing.
For programs ready to explore digital recognition solutions specifically designed for career and technical education organizations, schedule a platform demonstration to discuss how technology-enabled recognition systems address capacity constraints, maintenance burden, and engagement challenges documented throughout this research.
About This Research: This benchmark analysis synthesizes data from Rocket internal CTE organization deployment sample (N=283 installations, 2020-2026), published educational facility research, and adviser survey responses. Recognition patterns and cost estimates reflect 2020-2026 period conditions and may evolve as technology and program practices continue developing. Chapters should verify specific technical requirements and pricing with solution providers when making implementation decisions, as this report presents aggregate patterns rather than specific product recommendations.
Methodology Transparency: Sample characteristics: 283 total installations (127 FBLA, 156 FFA), 41 states represented, 68% comprehensive high schools / 19% career and technical centers / 13% agricultural education facilities, chapter size range 18-340 active members (median: 87), competitive history range 3-40 years (median: 12 years). Data collection: facility assessments, platform analytics, adviser surveys (N=142 respondents), budget analysis (N=89 providing detailed financial data). Analysis: descriptive statistics (medians, quartiles, ranges), cost modeling with standardized assumptions, satisfaction ratings on 1-10 scales. Limitations: sample represents digitally-enabled chapter subset and may not fully reflect programs without technology adoption; cost estimates based on 2025-2026 market pricing; causation cannot be definitively established for recognition program impact on chapter outcomes given confounding variables.