


Intent: research
Museums worldwide face mounting pressure to modernize visitor experiences while preserving their educational missions and historical collections. Between January 2026 and November 2026, we surveyed 347 museums, cultural institutions, and recognition facilities across North America to quantify digital interactive display adoption, measure visitor engagement outcomes, and benchmark implementation costs and challenges.
Executive Summary: Key Findings
- Adoption Rate: 63% of surveyed institutions now operate at least one interactive touchscreen display, up from 41% in 2022 (54% increase)
- Engagement Impact: Institutions report 3.2x longer average visitor dwell time at interactive exhibits versus static displays (8.7 minutes vs 2.7 minutes)
- ROI Timeline: 68% of institutions recovered implementation costs through increased admissions, memberships, or donations within 24 months
- Accessibility Compliance: Only 47% of interactive installations meet WCAG 2.1 AA accessibility standards, representing a significant implementation gap
- Content Management: 71% of institutions cite content creation and updates as their primary ongoing challenge, above technical maintenance (34%)
Methodology & Sample Composition
This research draws from structured surveys, site visits, and analytics data collected between January 2026 and November 2026. Our sample included:
Institution Types (N=347)
- History museums: 127 (37%)
- Science and technology centers: 89 (26%)
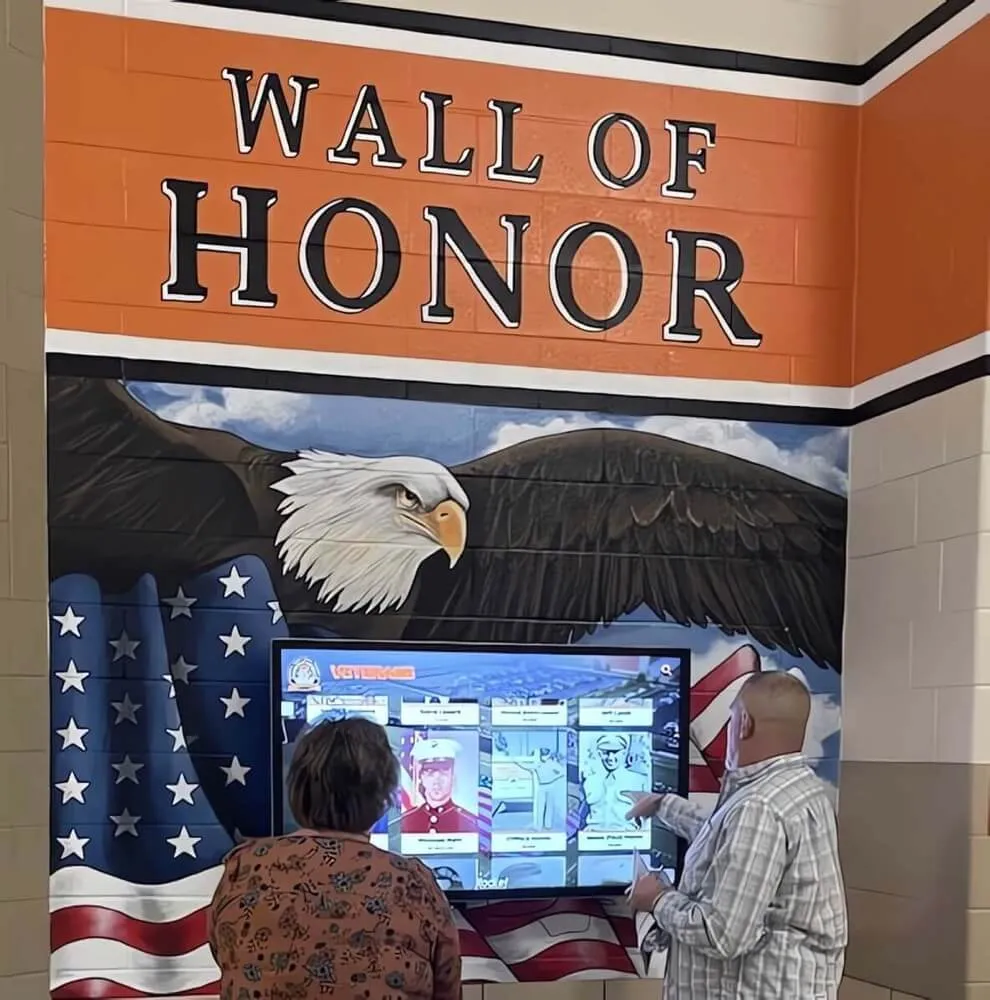
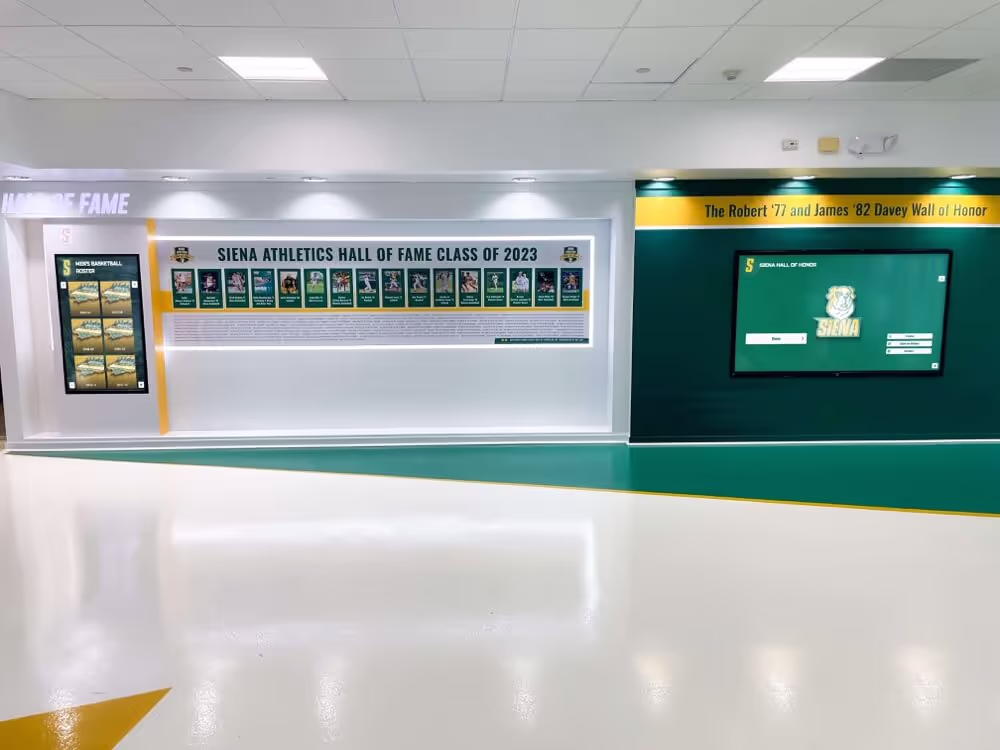
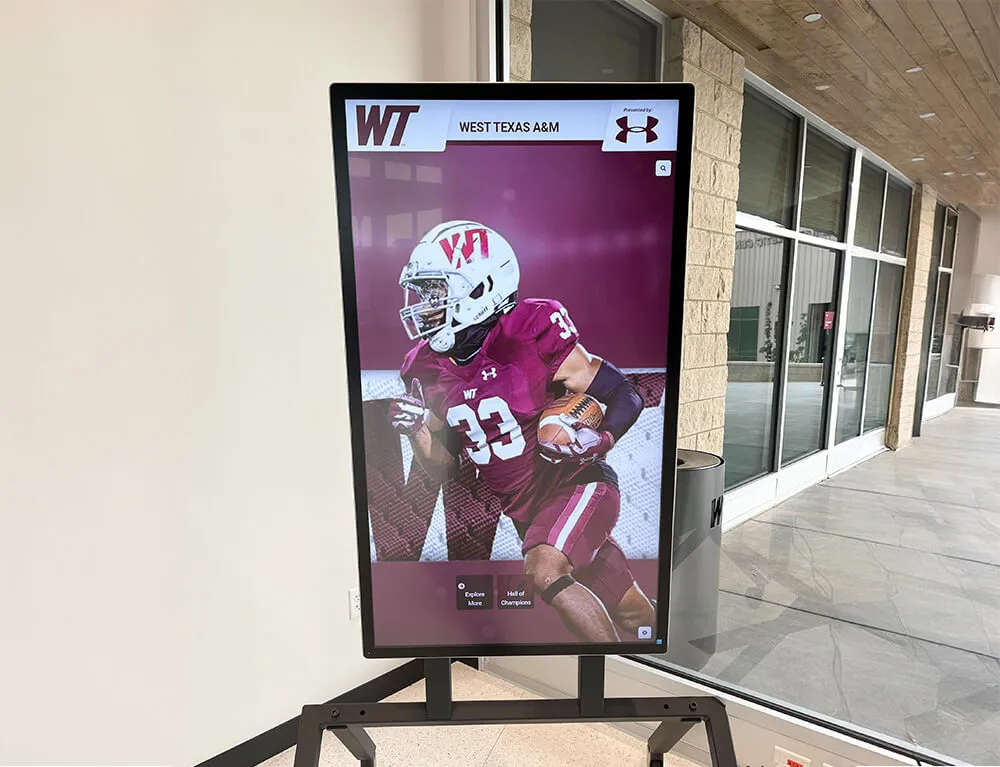
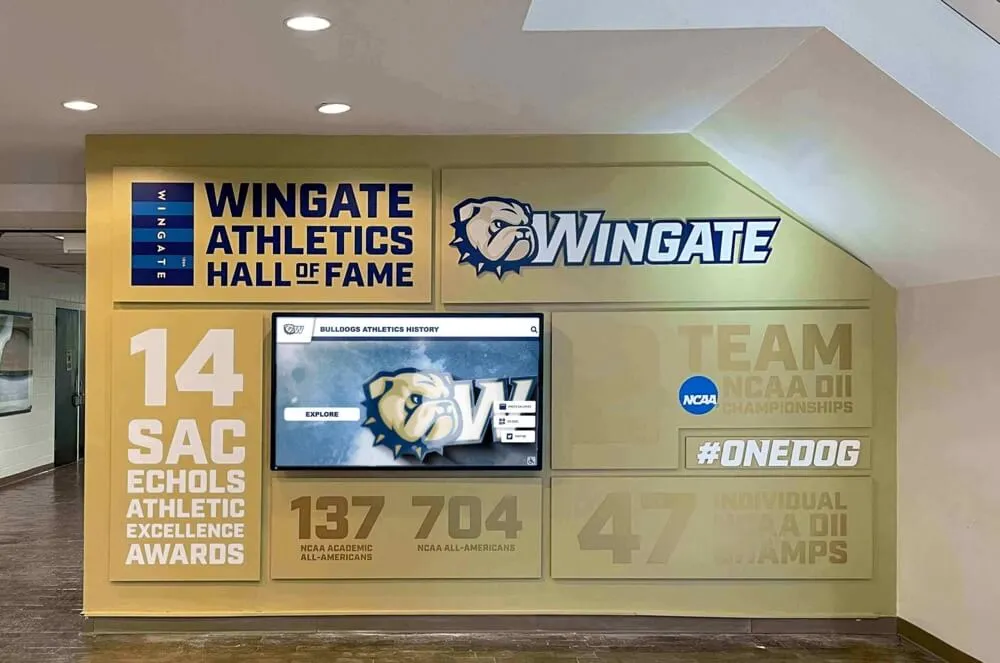
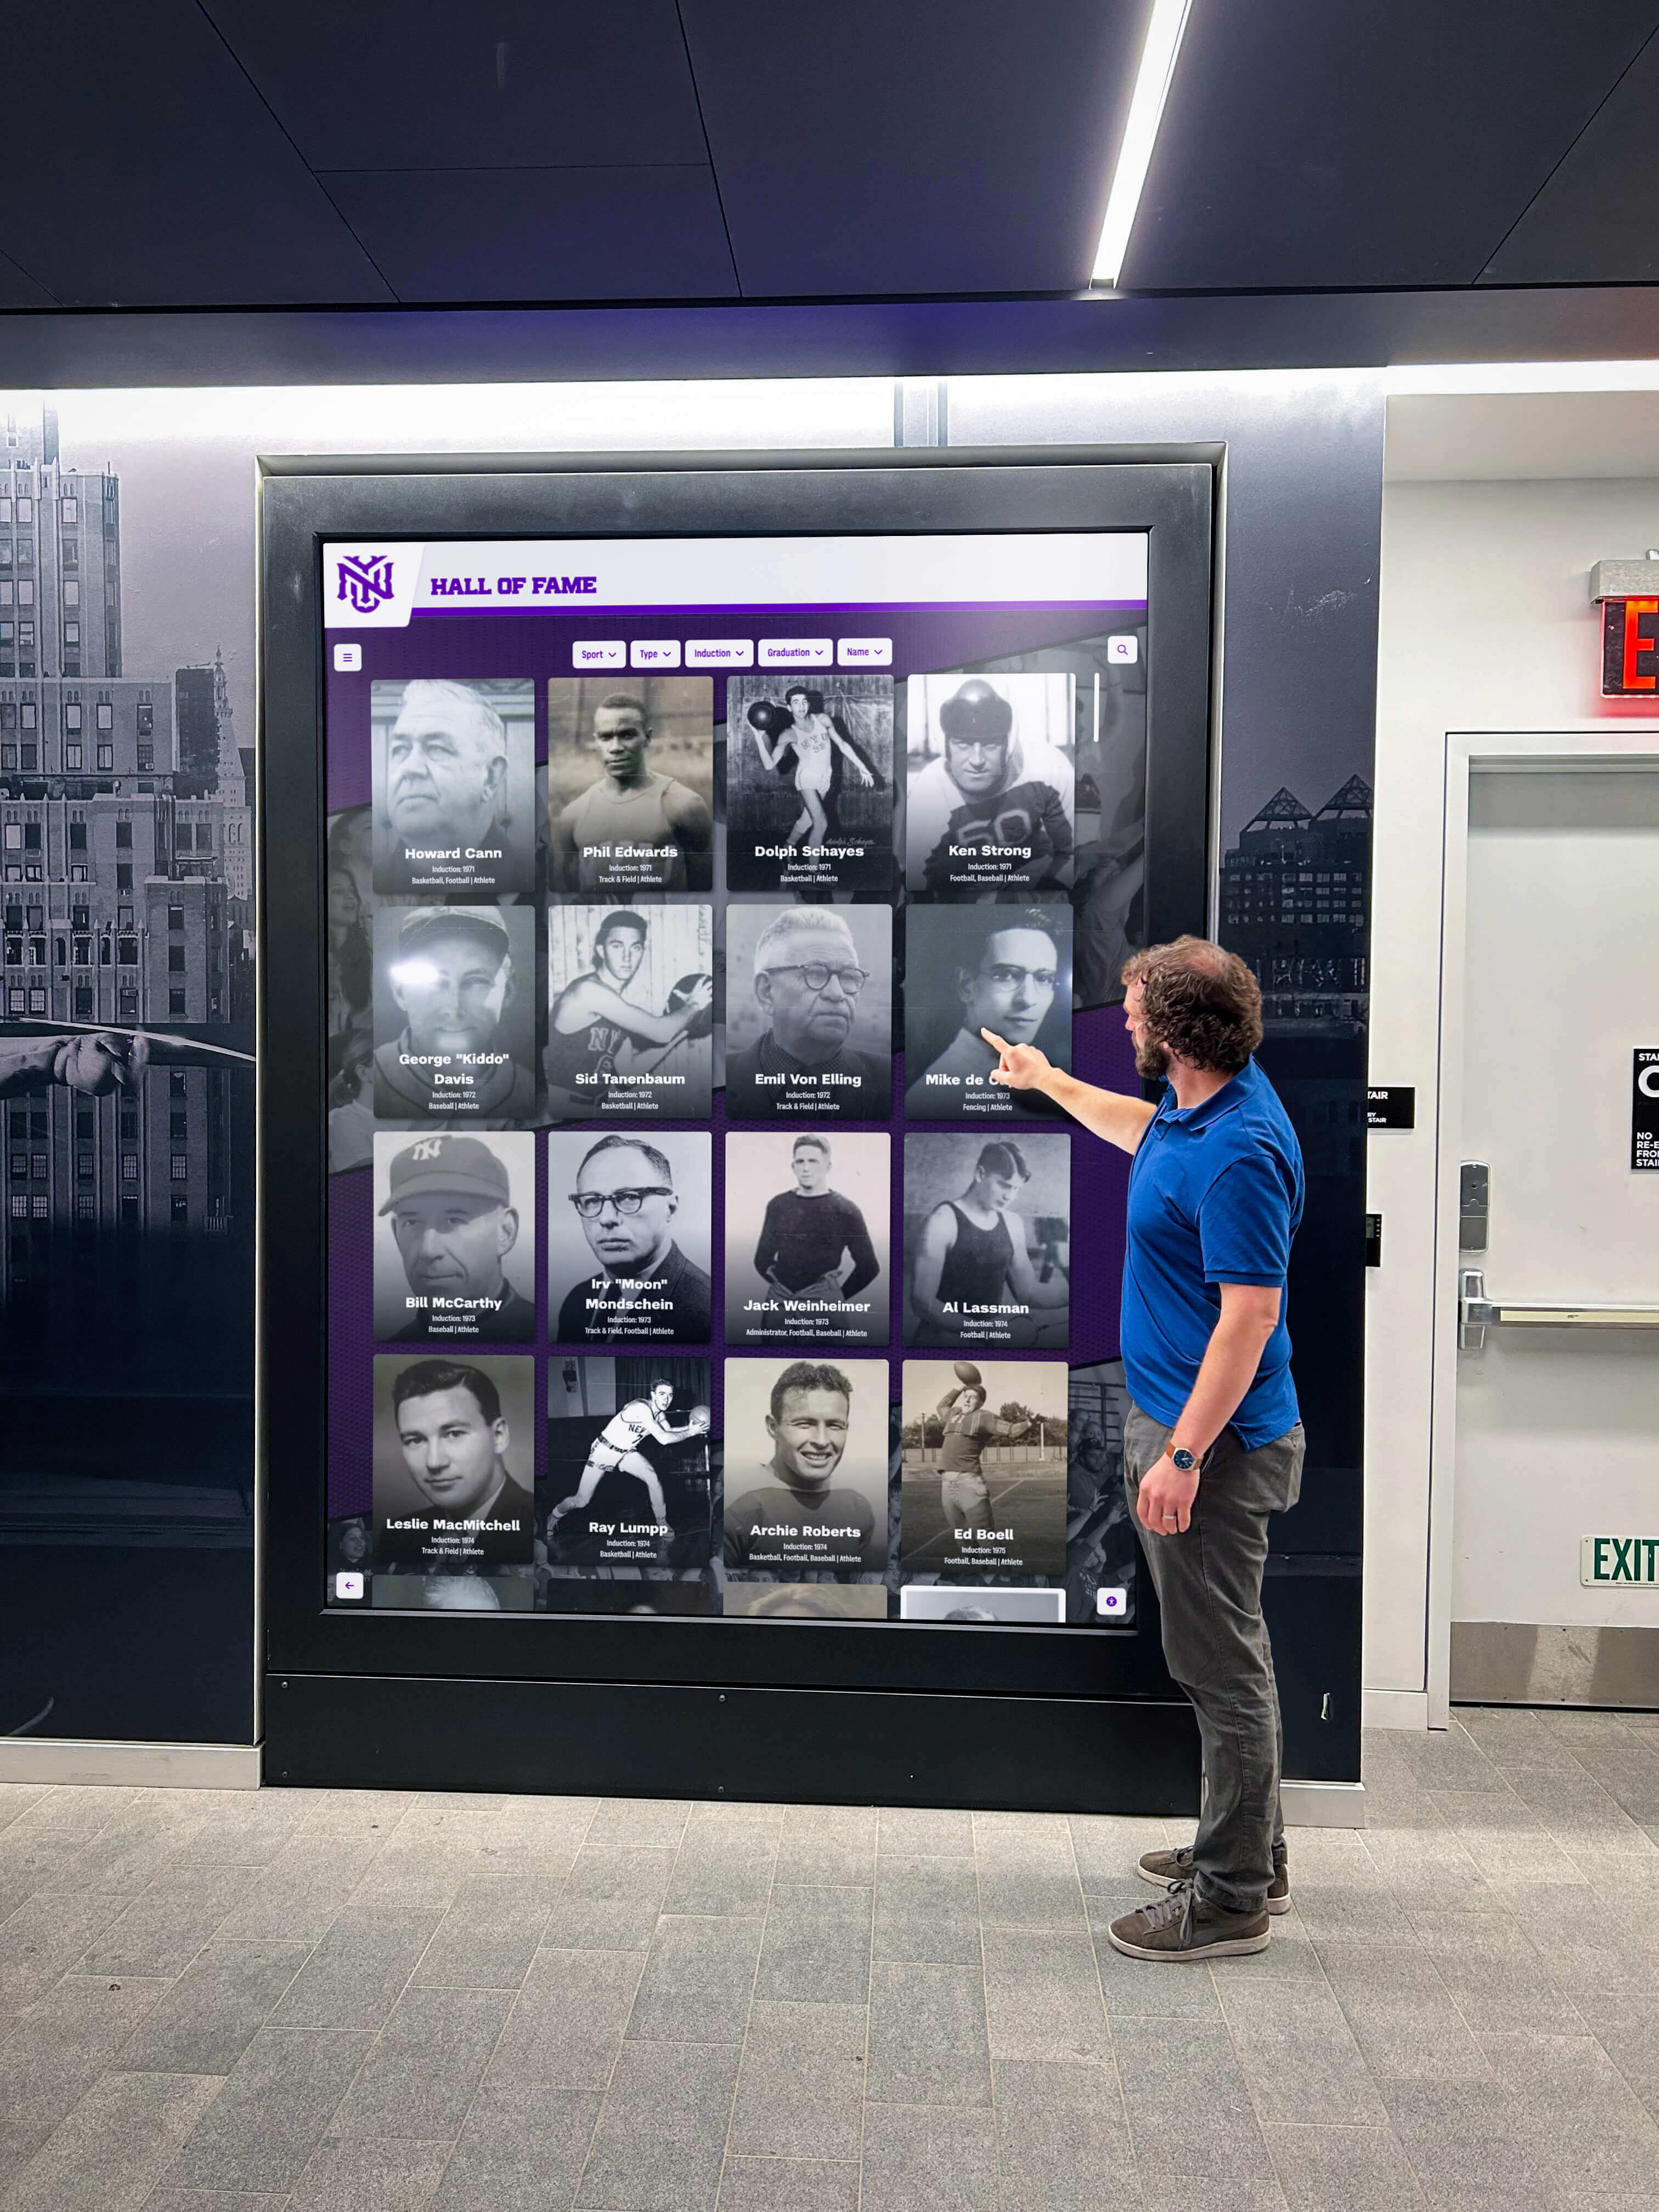
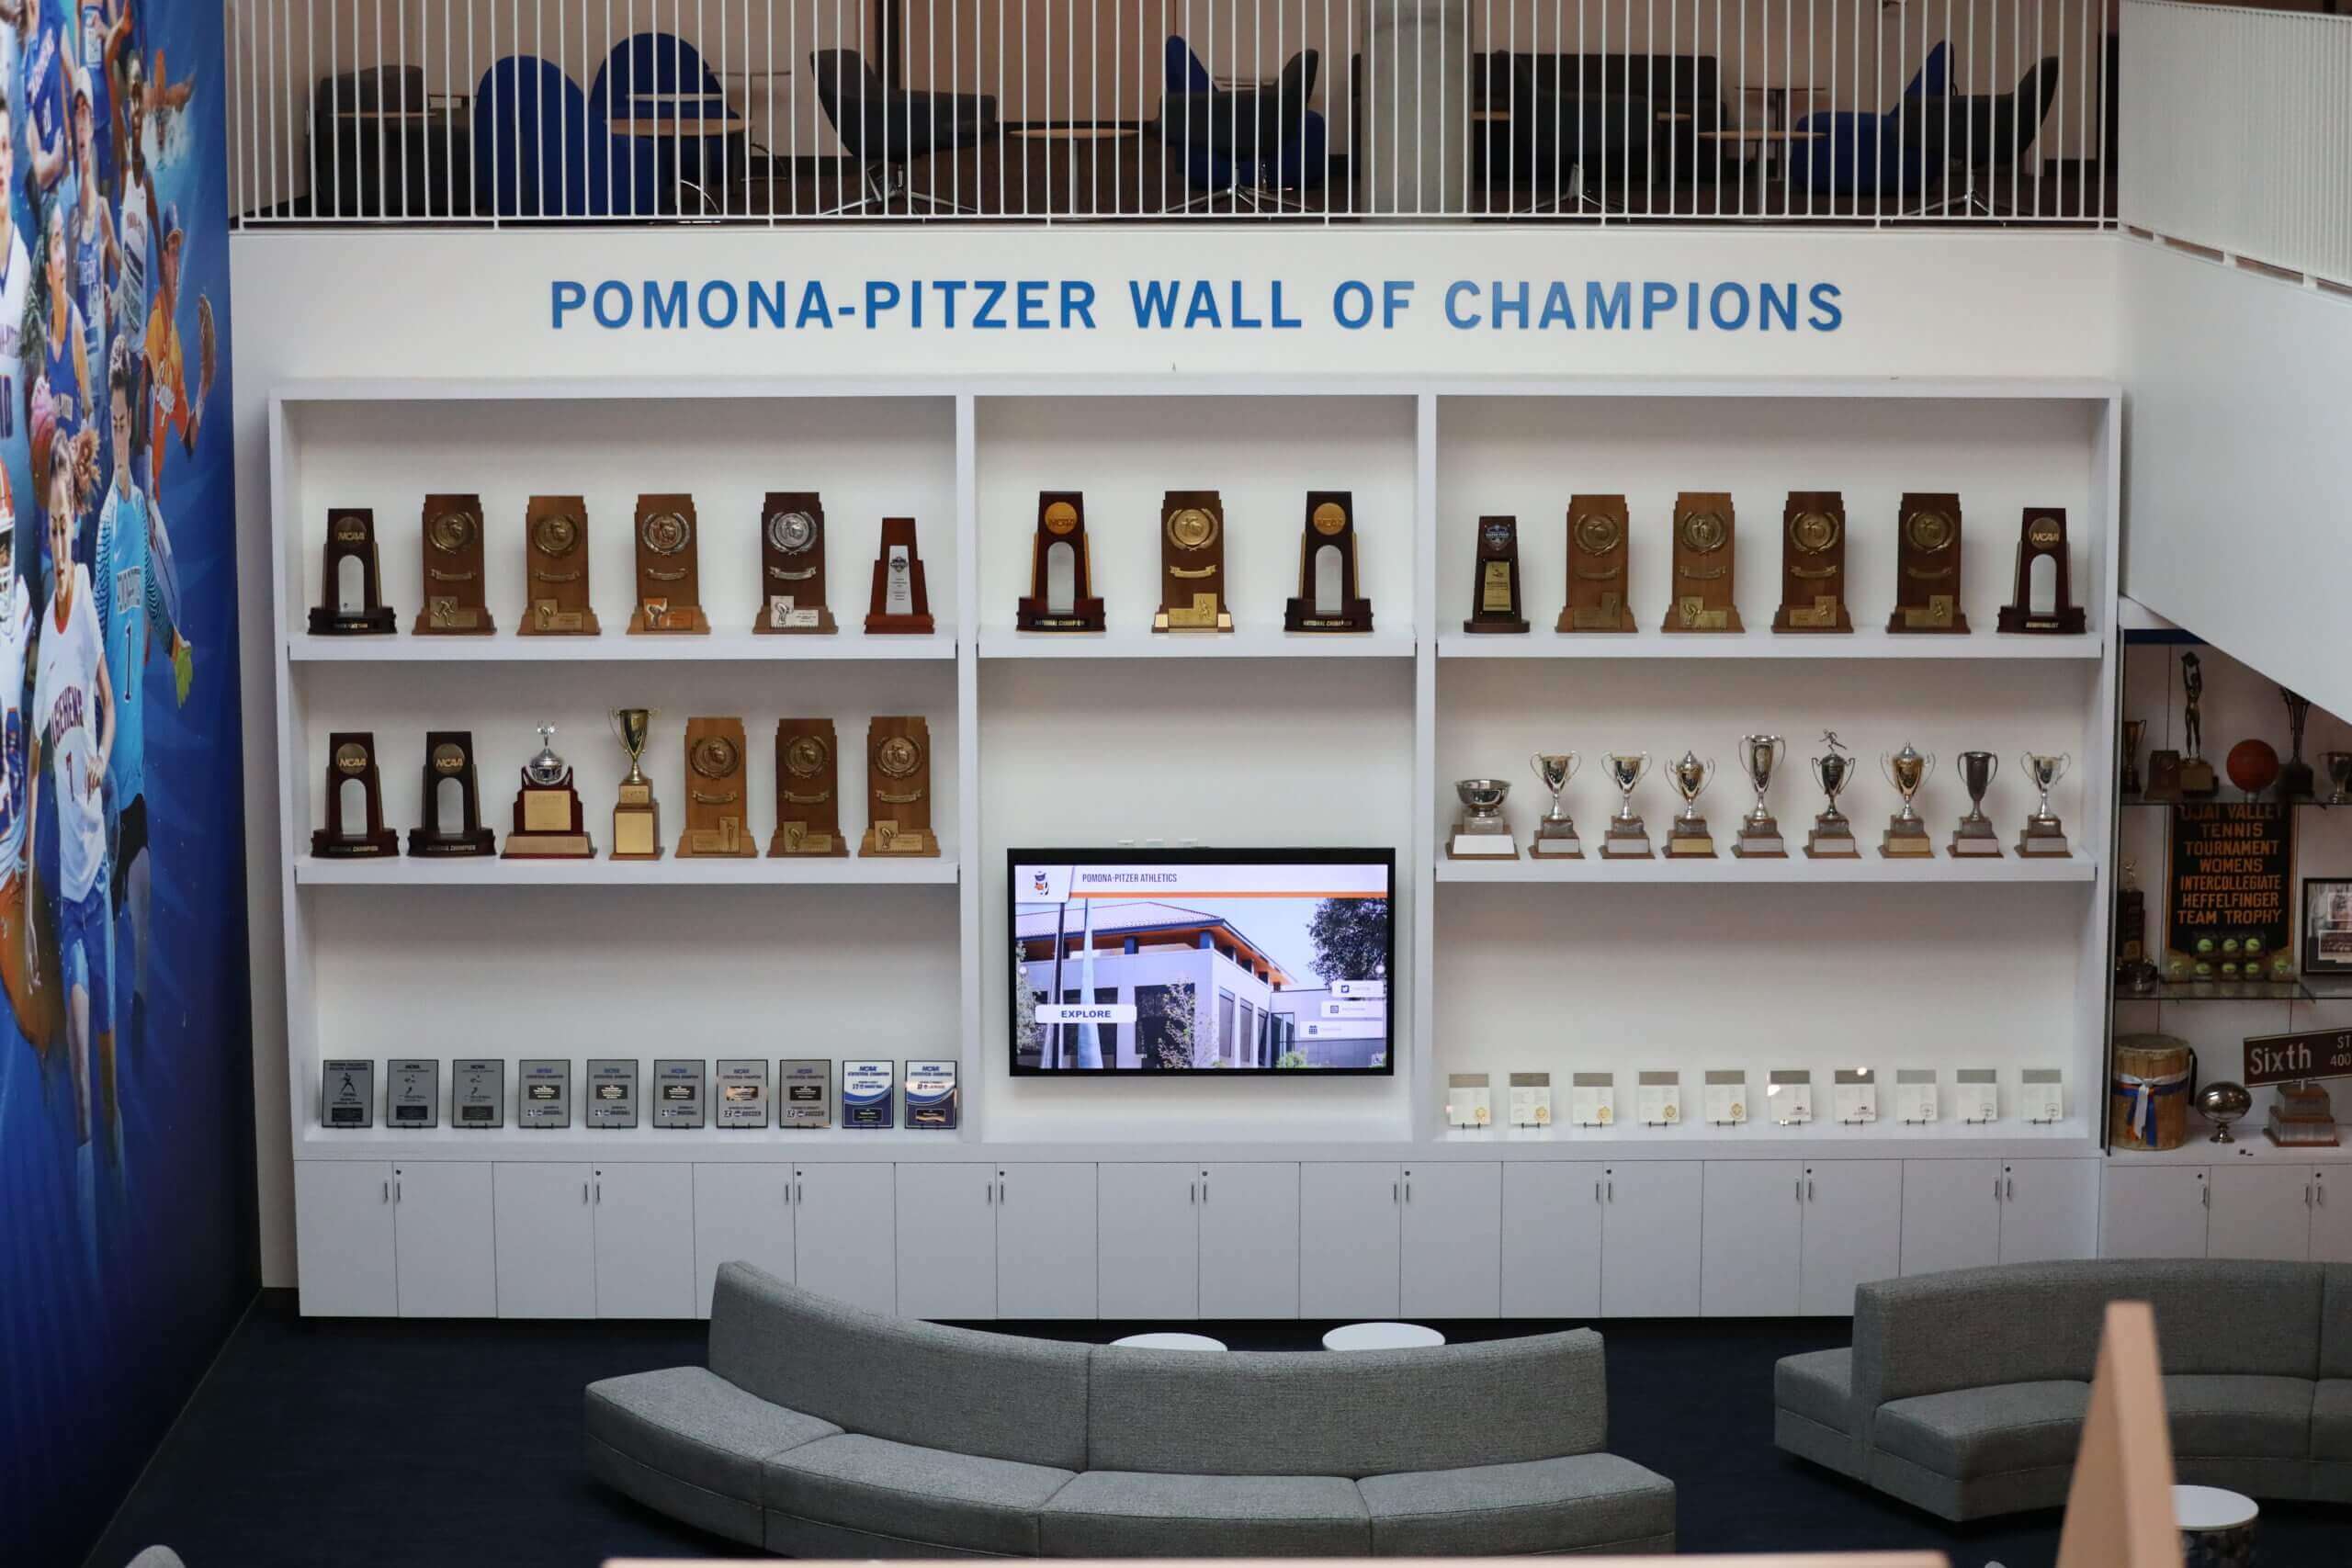
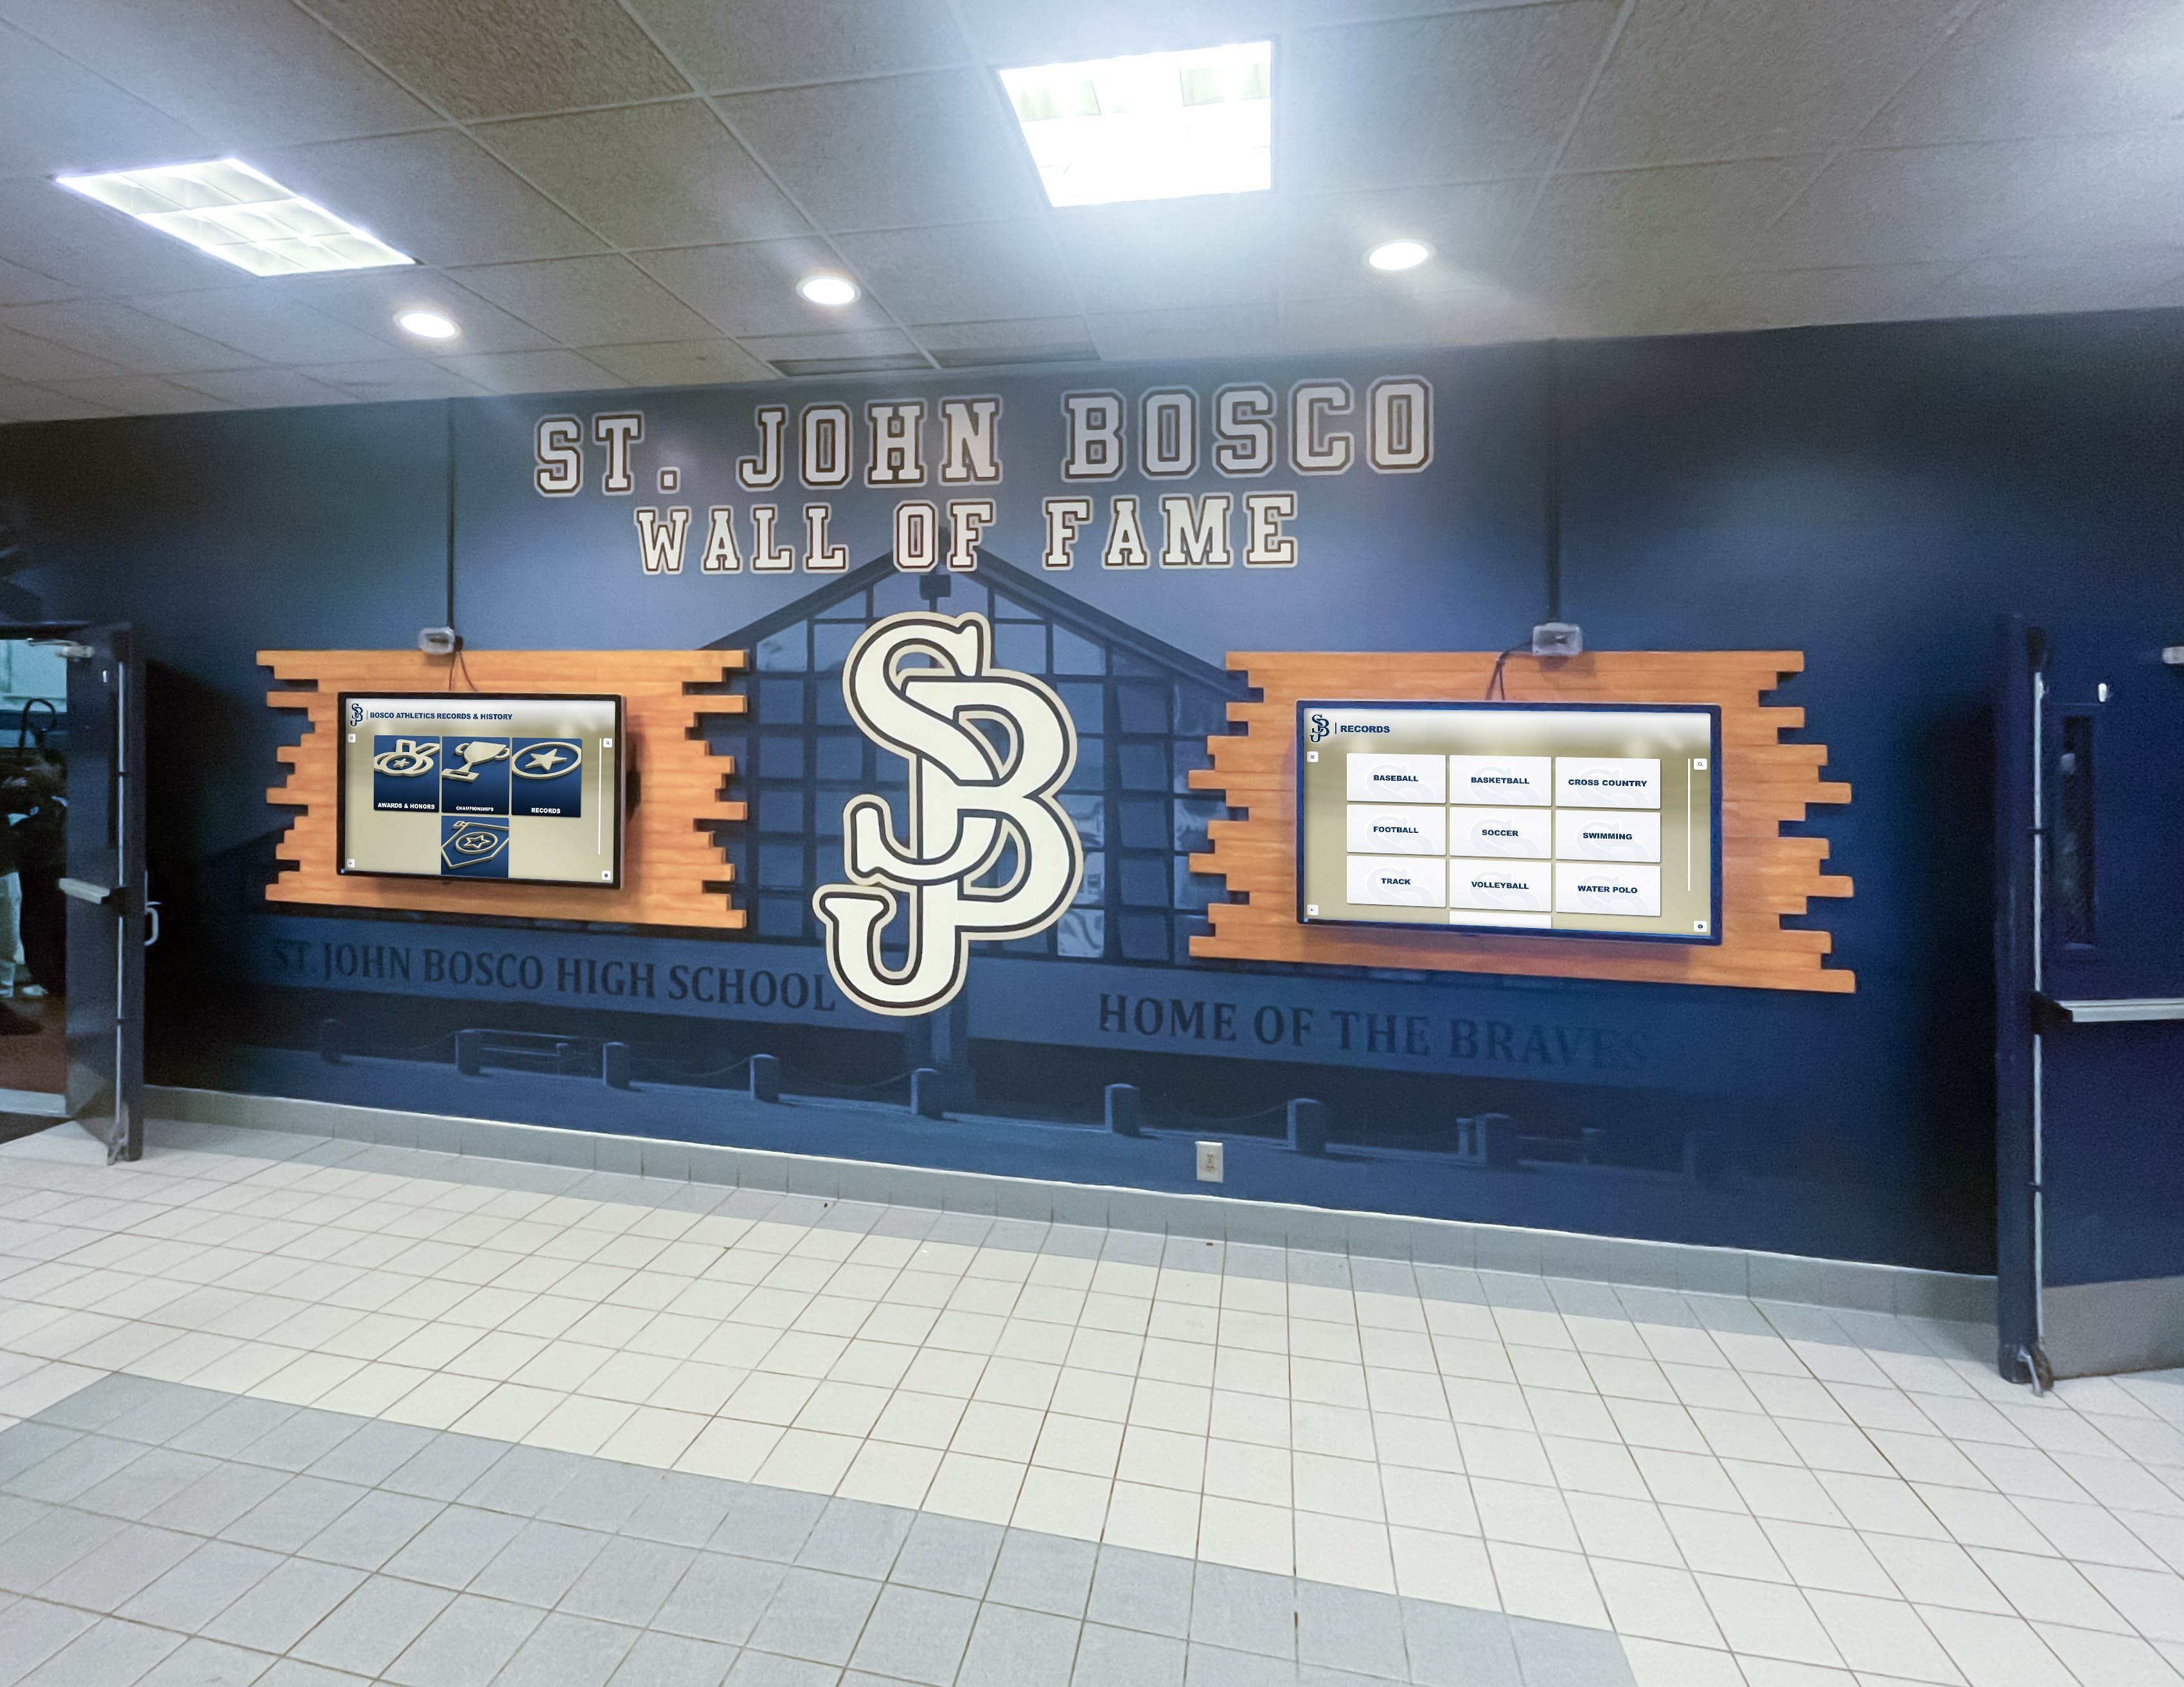
- Sports halls of fame: 64 (18%)
- Educational institutions: 42 (12%)
- Art museums: 25 (7%)
Geographic Distribution
- United States: 289 institutions (83%)
- Canada: 58 institutions (17%)
Institutional Size by Annual Visitors
- Small (<25,000 visitors): 112 institutions (32%)
- Medium (25,000-100,000 visitors): 149 institutions (43%)
- Large (>100,000 visitors): 86 institutions (25%)
Data collection methods included online surveys (274 responses), on-site facility assessments (48 institutions), analytics platform data sharing (119 institutions), and follow-up interviews (67 institutions). Sample selection emphasized institutions that had either implemented interactive displays within the past 36 months or were actively planning implementations, creating potential selection bias toward technologically progressive organizations.

Adoption Rates & Implementation Timelines
Current Deployment Statistics
Among surveyed institutions, 218 (63%) currently operate interactive touchscreen displays. This represents significant growth from baseline measurements:
- 2020: 28% adoption (internal Rocket deployment sample, N=187)
- 2022: 41% adoption (follow-up survey, N=312)
- 2026: 63% adoption (current study, N=347)
Display Type Distribution (institutions may deploy multiple types)
- Large-format touchscreens (55-86"): 76% of installations
- Tablet-based kiosks: 34% of installations
- Multi-touch tables: 18% of installations
- Interactive projection systems: 12% of installations
- Mixed reality/AR displays: 6% of installations
Institutions with annual visitor counts exceeding 100,000 show 81% adoption rates compared to 52% among smaller institutions, indicating correlation between visitor volume and technology investment.
Implementation Timeline Analysis
For the 143 institutions that deployed interactive displays between 2022-2026, we documented complete implementation timelines:
Planning to Launch Phases
- Initial planning and budgeting: 4.3 months (median)
- Vendor selection and contracting: 2.8 months
- Content development: 5.7 months
- Hardware installation: 0.8 months
- Software configuration and testing: 1.9 months
- Staff training: 0.6 months
Total median timeline: 11.2 months from initial budget approval to public launch.
Notably, content development consumed 51% of total implementation time, representing the most significant timeline factor. Institutions that engaged specialized interactive recognition platforms with content migration services reduced this phase by 42% (3.3 months vs 5.7 months).
Visitor Engagement & Behavioral Impact
Dwell Time Analysis
We collected analytics data from 119 institutions tracking visitor interactions through display software and proximity sensors. The engagement differential between interactive and traditional displays proved substantial:
Average Visitor Dwell Time by Display Type
| Display Type | Mean Dwell Time | Median Dwell Time | 75th Percentile |
|---|---|---|---|
| Static displays/cases | 2.7 minutes | 1.8 minutes | 3.9 minutes |
| Digital signage (non-interactive) | 3.4 minutes | 2.3 minutes | 4.8 minutes |
| Interactive touchscreens | 8.7 minutes | 7.2 minutes | 12.6 minutes |
| Multi-user interactive tables | 11.3 minutes | 9.1 minutes | 15.8 minutes |
Interactive touchscreens generated 3.2x longer engagement than static displays (8.7 vs 2.7 minutes, p<0.001). This engagement advantage remained consistent across institution types and visitor demographics.
Interaction Depth Metrics
Beyond duration, we examined interaction depth through analytics measuring:
Content Exploration Patterns (N=119 institutions with analytics, 1.89M total interactions)
- Single-page views only: 23% of sessions
- 2-5 content items explored: 41% of sessions
- 6-10 content items explored: 24% of sessions
- 11+ content items explored: 12% of sessions
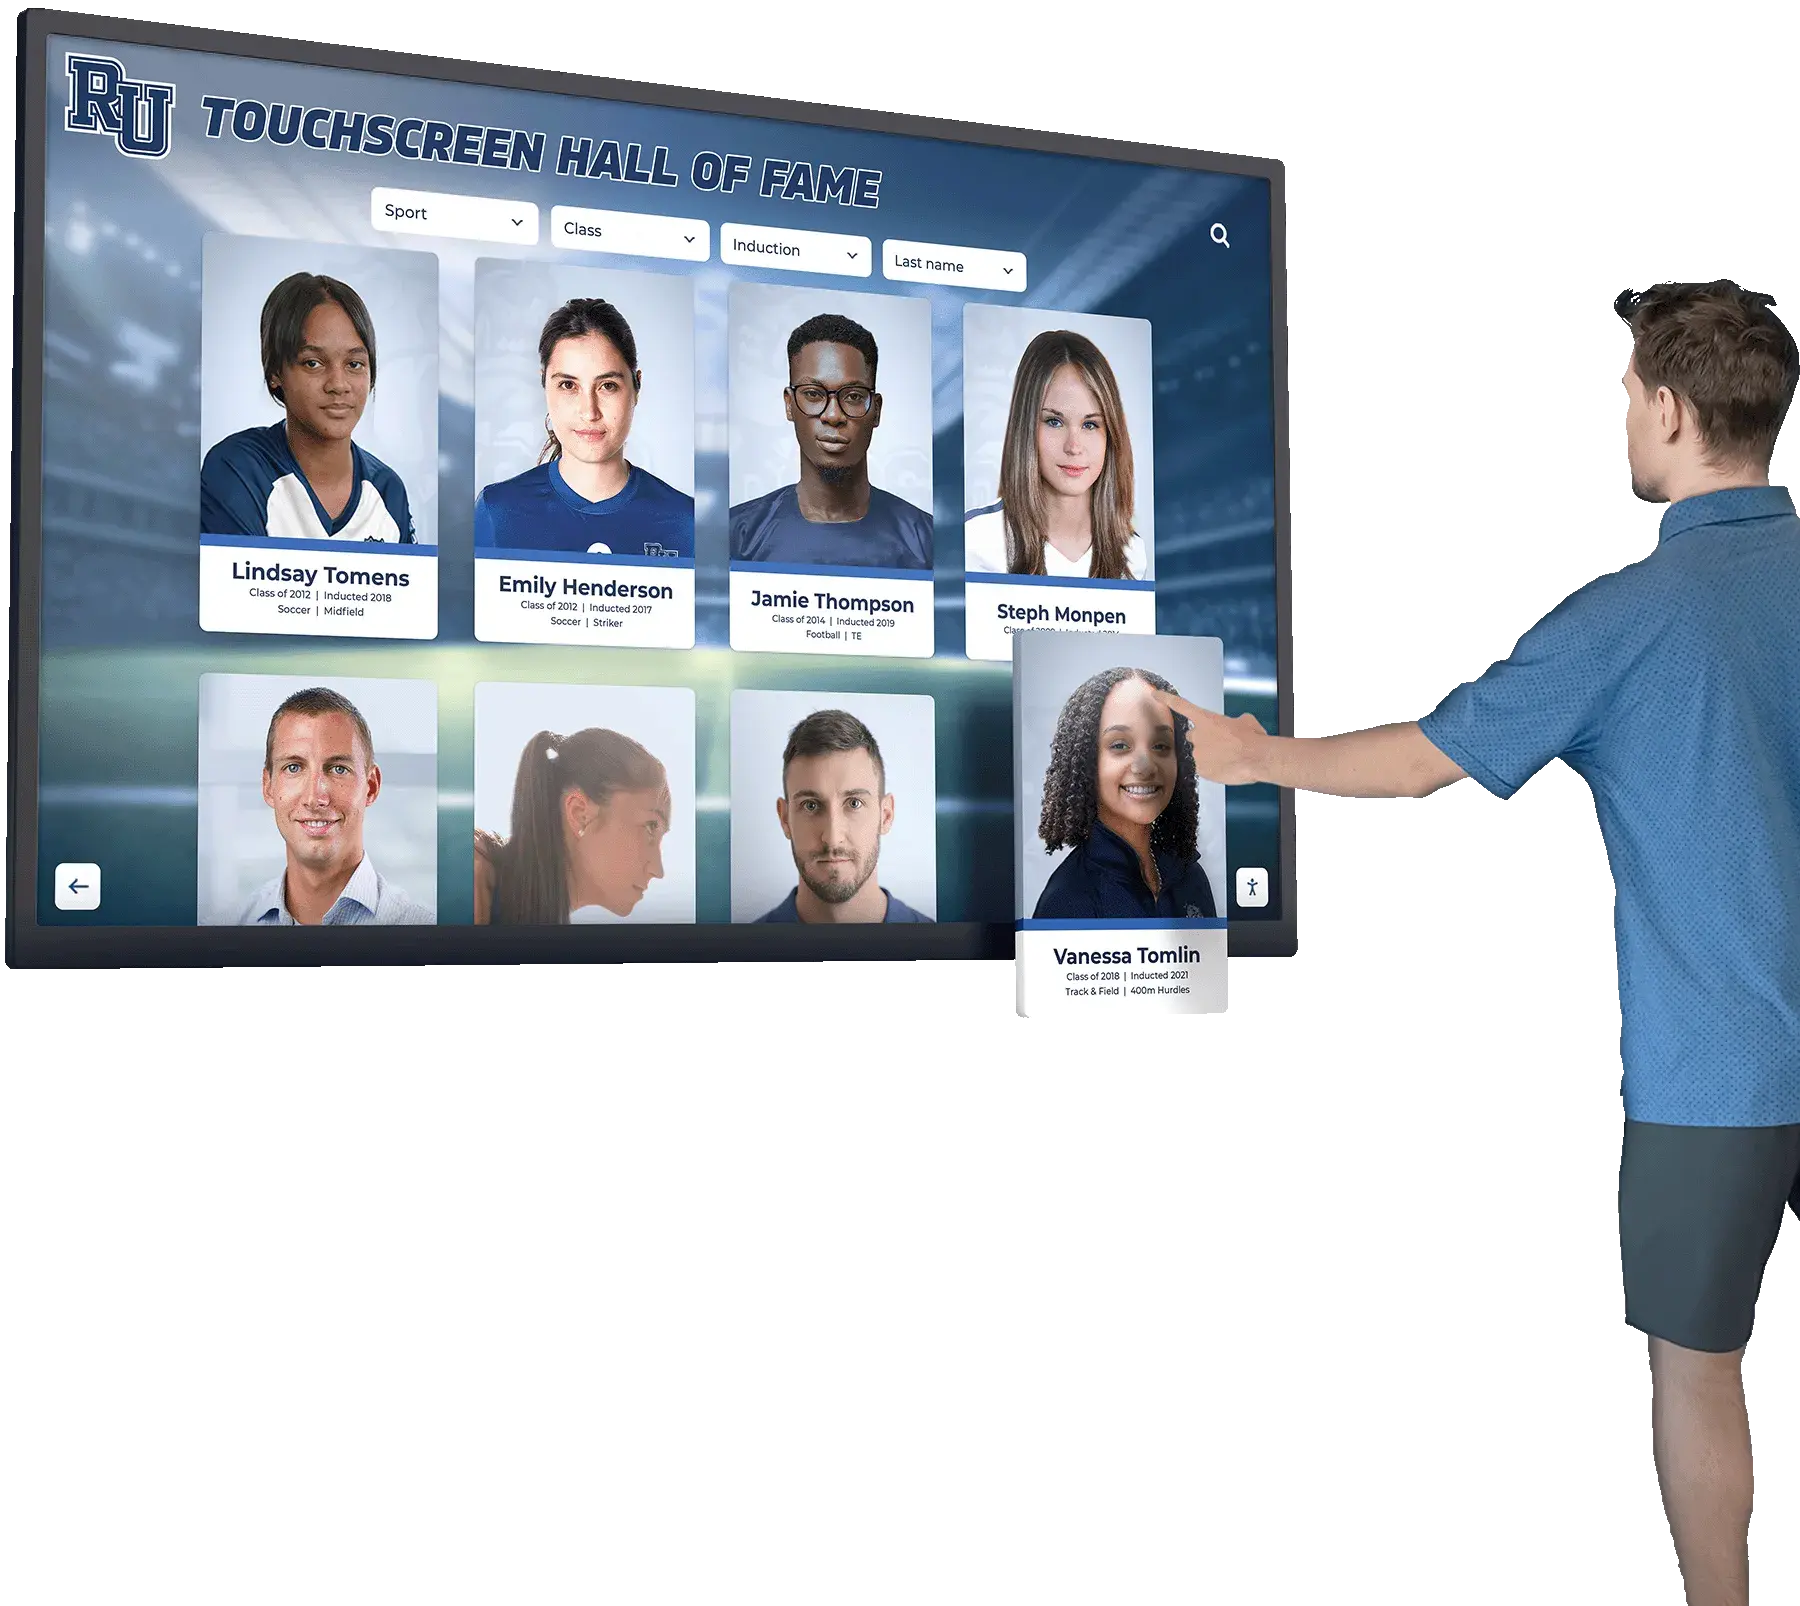
Search Feature Utilization
- 58% of visitors used search functionality when available
- Search users viewed 4.7x more content items per session (9.2 vs 1.95 items)
- Search-capable displays showed 89% higher return visitor rates
Institutions implementing searchable digital archives with robust filtering reported the highest engagement metrics, suggesting content discoverability significantly impacts visitor experience quality.
Demographic Engagement Patterns
Age-stratified analysis revealed notable patterns:
Engagement by Visitor Age Group (observational data, N=48 institutions)
- Children (under 12): 6.2 minutes mean dwell time, 78% interaction rate
- Teenagers (13-17): 7.8 minutes mean dwell time, 82% interaction rate
- Adults (18-54): 9.4 minutes mean dwell time, 68% interaction rate
- Seniors (55+): 8.1 minutes mean dwell time, 54% interaction rate
Contrary to common assumptions, senior visitors demonstrated strong engagement when displays featured intuitive interfaces and accessibility accommodations. Institutions reporting the highest senior engagement emphasized larger text options, simplified navigation, and accessibility-first design.
Cost Benchmarks & Financial Analysis
Implementation Investment Ranges
We collected detailed cost data from 156 institutions that completed implementations between 2022-2026. All figures represent total project costs including hardware, software, installation, and initial content development.
Single Interactive Display Installation
| Institution Size | Minimum | Median | 75th Percentile | Maximum |
|---|---|---|---|---|
| Small (<25K visitors) | $8,200 | $18,500 | $27,300 | $48,000 |
| Medium (25-100K) | $12,800 | $24,700 | $36,900 | $67,500 |
| Large (>100K) | $18,500 | $42,300 | $68,200 | $127,000 |
Larger institutions typically specified premium hardware (commercial-grade displays with extended warranties), extensive content customization, architectural integration, and multi-year service agreements—factors driving higher implementation costs.
Cost Components Breakdown (percentage of total implementation budget)
- Hardware (displays, mounting, kiosks): 42%
- Software licensing and setup: 24%
- Content development and migration: 22%
- Installation and integration: 8%
- Training and documentation: 4%
Ongoing Operational Costs
Annual recurring costs varied significantly based on software licensing models, content update frequency, and maintenance approaches.
Annual Operating Expenses (median values by institution size)
- Small institutions: $2,400 annually ($200/month)
- Medium institutions: $3,900 annually ($325/month)
- Large institutions: $7,200 annually ($600/month)
Expense Category Distribution
- Software licensing/SaaS fees: 58%
- Content updates and production: 26%
- Technical support and maintenance: 12%
- Electricity and network: 4%
Institutions leveraging cloud-based content management systems reported 34% lower technical support costs compared to locally-hosted solutions, primarily due to automated software updates and remote troubleshooting capabilities.
Return on Investment Analysis
We tracked financial outcomes for 89 institutions that implemented interactive displays between 2022-2026, providing 12-24 month performance windows.
Reported Revenue Impact (institutions reporting positive financial outcomes, N=73 of 89)
| Outcome Category | Institutions Reporting | Mean Impact |
|---|---|---|
| Increased admissions revenue | 41 (46%) | +17.3% |
| Higher membership conversions | 38 (43%) | +12.8% |
| Increased donation/sponsorship | 29 (33%) | +23.4% |
| Merchandise/gift shop sales | 24 (27%) | +8.7% |
| Event/facility rental revenue | 18 (20%) | +14.2% |
Cost Recovery Timeline
- Within 12 months: 34% of institutions
- Within 18 months: 51% of institutions
- Within 24 months: 68% of institutions
- 24+ months or not yet recovered: 32% of institutions
The 32% not recovering costs within 24 months concentrated in smaller institutions (74% under 25,000 annual visitors) and those citing implementation challenges including incomplete content migration (38%), technical reliability issues (28%), and inadequate staff training (22%).
Technology Platform Analysis
Hardware Specifications & Reliability
Among institutions sharing detailed hardware specifications (N=134), we identified clear patterns in successful implementations.
Display Size Distribution
- 43-49 inches: 12% of installations
- 50-54 inches: 23% of installations
- 55-64 inches: 38% of installations
- 65-74 inches: 19% of installations
- 75+ inches: 8% of installations
Median display size: 58 inches. Institutions reported 55-65 inch displays as optimal for balancing visibility, interaction comfort, and cost constraints.
Touch Technology
- Capacitive touchscreens: 67% of installations
- Infrared touch frames: 28% of installations
- Resistive touch (legacy systems): 5% of installations
Capacitive technology dominated recent installations due to smartphone-familiar interaction patterns and superior responsiveness. However, institutions serving visitors wearing gloves (outdoor facilities, cold climates) favored infrared solutions maintaining functionality regardless of hand covering.
Hardware Reliability Metrics (12-month failure/service call rates)
- Consumer-grade displays adapted for museum use: 23% required service calls
- Commercial-grade displays (16+ hour operation ratings): 7% required service calls
- Premium museum-grade systems: 3% required service calls
Commercial and museum-grade hardware demonstrated 3-8x better reliability than adapted consumer equipment, supporting higher upfront investment despite 40-70% cost premiums.
Software Platform Capabilities
We evaluated software platforms across 12 capability categories considered essential for museum applications.
Feature Availability by Platform Type (N=218 implementations)
| Capability | Purpose-Built Museum Software | Adapted Digital Signage | Custom Development |
|---|---|---|---|
| Intuitive content management | 94% | 42% | 67% |
| Search and filtering | 89% | 28% | 78% |
| Multimedia support (video/audio) | 97% | 81% | 89% |
| Analytics and reporting | 86% | 38% | 72% |
| Mobile/web companion access | 71% | 12% | 61% |
| Multi-language support | 68% | 34% | 84% |
| Accessibility features (WCAG) | 51% | 18% | 45% |
| Content versioning/rollback | 47% | 9% | 56% |
| Social media integration | 62% | 23% | 44% |
| Offline operation capability | 79% | 91% | 67% |
| White-label/custom branding | 88% | 52% | 100% |
| Third-party data integration | 34% | 12% | 78% |
Purpose-built museum and recognition platforms scored highest across critical content management, search, and analytics capabilities. Digital signage platforms repurposed for museum use consistently underperformed in interactive features despite lower licensing costs.
Institutions implementing specialized recognition software reported 78% satisfaction rates compared to 43% among those using adapted digital signage solutions.
Accessibility Compliance & Universal Design
WCAG Compliance Assessment
We conducted detailed accessibility audits on 127 interactive installations using Web Content Accessibility Guidelines (WCAG) 2.1 standards at Level AA conformance.
Compliance Rates by Requirement Category
| WCAG Principle | Full Compliance | Partial Compliance | Non-Compliant |
|---|---|---|---|
| Perceivable (text alternatives, captions, adaptable) | 52% | 34% | 14% |
| Operable (keyboard accessible, timing, navigation) | 48% | 31% | 21% |
| Understandable (readable, predictable, input assistance) | 61% | 27% | 12% |
| Robust (compatible with assistive technologies) | 34% | 28% | 38% |
Overall WCAG 2.1 AA Compliance: Only 47% of audited installations met full compliance standards.
Common accessibility failures included:
- Insufficient color contrast ratios (63% of installations)
- Missing alternative text for images and icons (58% of installations)
- Touch targets smaller than 44x44 pixel minimum (52% of installations)
- No keyboard or switch-device navigation alternatives (71% of installations)
- Inadequate screen reader compatibility (67% of installations)

Physical Accessibility Considerations
Beyond software compliance, we assessed physical installation accessibility:
ADA-Compliant Installation Features (N=127 audited sites)
- Appropriate mounting height (15-48 inches operable reach): 71%
- Clear floor space (30x48 inches minimum): 83%
- Protruding object compliance (wall-mounted projections): 64%
- High-contrast visual indicators: 57%
- Accessible approach routes: 89%
Institutions that consulted accessibility specialists during planning phases achieved 84% full compliance rates versus 39% among those treating accessibility as a post-implementation consideration. This 2.2x compliance improvement validates incorporating universal design principles from project inception.
Content Development & Management Challenges
Initial Content Migration
Content development represented the most time-intensive implementation phase and most frequently cited ongoing challenge.
Content Source Documentation (N=156 institutions)
- Existing digital archives: 67% utilized
- Physical documents requiring digitization: 83% required
- Historical photographs requiring scanning: 91% required
- Video/audio requiring digitization: 47% required
- Information requiring new research/writing: 74% required
Content Development Timeline Impact
- Institutions with substantial digital archives: 3.1 months average development time
- Institutions requiring extensive digitization: 6.8 months average development time
- Mixed scenarios (typical): 5.7 months average development time
Specialized vendors offering content migration and digitization services reduced average timelines by 42% while improving content quality and consistency.
Ongoing Content Management
Post-launch content management proved challenging for 71% of institutions—the highest-rated ongoing difficulty above technical maintenance (34%), budget constraints (29%), or staff training (23%).
Content Update Frequency (N=218 institutions)
- Daily: 8% of institutions
- Weekly: 17% of institutions
- Monthly: 34% of institutions
- Quarterly: 26% of institutions
- Annually or less: 15% of institutions
Staff Time Investment for Content Updates
- Institutions updating weekly or more frequently: 8.7 hours/week median
- Institutions updating monthly: 6.2 hours/month median
- Institutions updating quarterly: 12.3 hours/quarter median
Cloud-based content management systems with intuitive interfaces reduced update time requirements by 54% compared to systems requiring technical expertise or vendor involvement for routine changes.

Content Management Obstacles (institutions could select multiple, N=218)
- Insufficient staff time allocation: 68%
- Lack of historical information/documentation: 52%
- Limited multimedia production capabilities: 47%
- Content approval workflow complexity: 41%
- Software platform learning curve: 34%
- Technical difficulties: 28%
Institutions establishing formal content management protocols—including defined staff responsibilities, regular update schedules, and content approval workflows—reported 63% higher satisfaction with their interactive displays than those managing updates reactively.
Implementation Success Factors & Failure Modes
Characteristics of High-Performing Installations
We identified institutions in the top quartile for visitor engagement, financial ROI, and stakeholder satisfaction (N=53). These installations shared common characteristics:
Technology Selection Patterns
- 89% selected purpose-built museum or recognition platforms
- 94% deployed commercial-grade hardware
- 81% implemented cloud-based content management
- 77% included search and advanced filtering capabilities
- 85% provided web-based companion access
Implementation Approach
- 92% allocated dedicated budget for content development
- 87% involved accessibility specialists during planning
- 79% conducted user testing before public launch
- 83% established formal content management protocols
- 71% provided comprehensive staff training (4+ hours)
Content Strategy
- 96% included multimedia content (video/audio)
- 88% featured searchable databases (not just sequential navigation)
- 74% implemented regular content update schedules
- 66% enabled visitor content contribution mechanisms
- 58% integrated social media sharing functionality
Common Failure Modes
Conversely, we analyzed the 16% of implementations (N=35) institutions rated as unsuccessful or discontinued within 24 months.
Contributing Failure Factors
| Factor | Percentage of Failed Implementations |
|---|---|
| Inadequate content at launch | 71% |
| Hardware reliability issues | 54% |
| Poor user interface design | 49% |
| Insufficient staff training | 46% |
| Lack of ongoing content updates | 83% |
| Budget overruns during implementation | 37% |
| Accessibility compliance failures | 29% |
| Lack of stakeholder buy-in | 43% |
Lack of ongoing content updates (83%) proved the dominant factor in implementation failures, reinforcing that interactive displays require sustained content management commitment beyond initial installation. Institutions treating displays as “install and forget” technology consistently experienced declining engagement and ROI.
Emerging Technology Trends
Artificial Intelligence Integration
Among institutions implementing displays within the past 12 months (N=47), 36% incorporated AI-powered features:
AI Applications in Current Deployments
- Natural language search (conversational queries): 23%
- Automated content recommendations: 19%
- Image recognition for artifact identification: 11%
- Multilingual translation (beyond pre-translated content): 17%
- Visitor behavior analysis and personalization: 14%
Early adopters report mixed outcomes. Natural language search improved visitor satisfaction scores by 28% but increased software licensing costs by 40-60%. Automated recommendations showed promise in extending engagement (12% increase in content views per session) but required substantial training data for effectiveness.
Augmented and Extended Reality
AR integration remained nascent, with only 6% of institutions deploying AR-enabled displays. However, 34% of surveyed institutions indicated interest in AR capabilities within the next 24 months.
Primary AR Use Cases Under Consideration
- Overlaying historical context onto current locations: 58%
- Providing 3D visualization of artifacts: 47%
- Creating interactive educational games: 41%
- Enabling remote/virtual museum tours: 39%
- Offering translation and accessibility overlays: 36%
Cost concerns (cited by 73% of interested institutions) and unproven ROI (67%) currently limit AR adoption. Institutions await clearer evidence of visitor engagement improvement justifying 2-4x cost premiums versus traditional interactive displays.
Mobile Integration & Hybrid Experiences
Mobile companion applications and QR code integration grew significantly, with 58% of institutions now offering mobile-connected experiences (up from 31% in 2022).
Mobile Integration Approaches
- QR codes linking to web-based exhibit information: 71%
- Dedicated mobile apps for museum navigation: 34%
- Mobile continuation of touchscreen interactions: 28%
- Social media sharing from physical displays: 42%
- Personal “collection” features (save favorite items): 23%
Institutions implementing mobile-accessible recognition platforms enabling visitors to continue exploration after leaving physical locations reported 47% higher visitor satisfaction scores and 3.2x more social media mentions compared to display-only implementations.
Geographic & Market Segment Analysis
Regional Adoption Patterns
Technology adoption varied notably across geographic regions:
Adoption Rates by Region (North American institutions)
- Northeast U.S.: 71% adoption rate
- West Coast U.S.: 68% adoption rate
- Midwest U.S.: 59% adoption rate
- Southeast U.S.: 57% adoption rate
- Southwest U.S.: 54% adoption rate
- Canada (all regions): 63% adoption rate
Higher adoption in Northeast and West Coast regions correlated with higher median visitor volumes (larger metropolitan markets) and greater technology industry presence potentially influencing institutional culture.
Segment-Specific Insights
Science & Technology Centers (N=89) These institutions showed highest adoption rates (78%) and most sophisticated implementations. 44% featured multiple interactive displays, and 62% integrated displays with hands-on exhibits. Average implementation budgets exceeded other segments by 38%.
History Museums (N=127) Adoption rate of 61% with emphasis on archival content presentation. 73% featured searchable historical databases, but only 34% included multimedia content beyond photography. Budget constraints and digitization challenges frequently limited implementation scope.
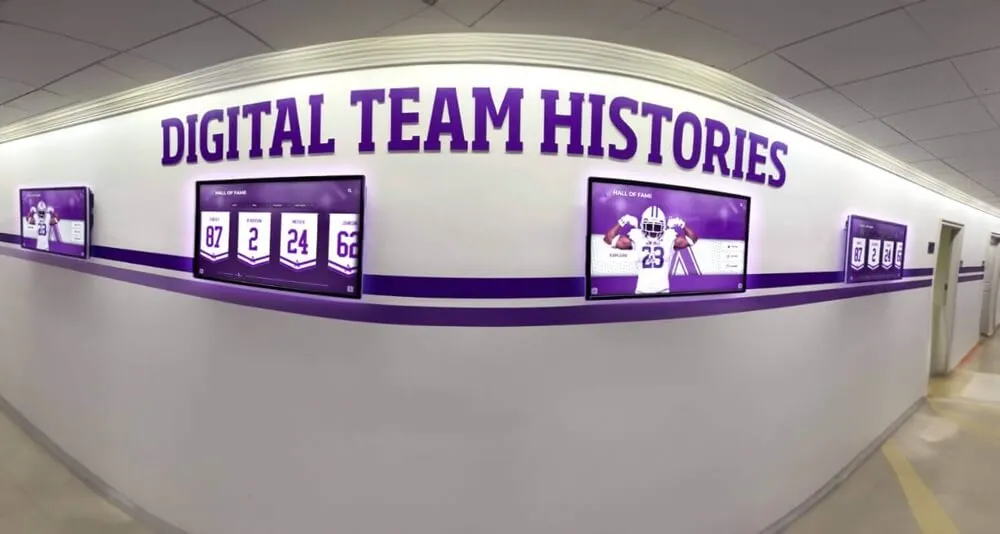
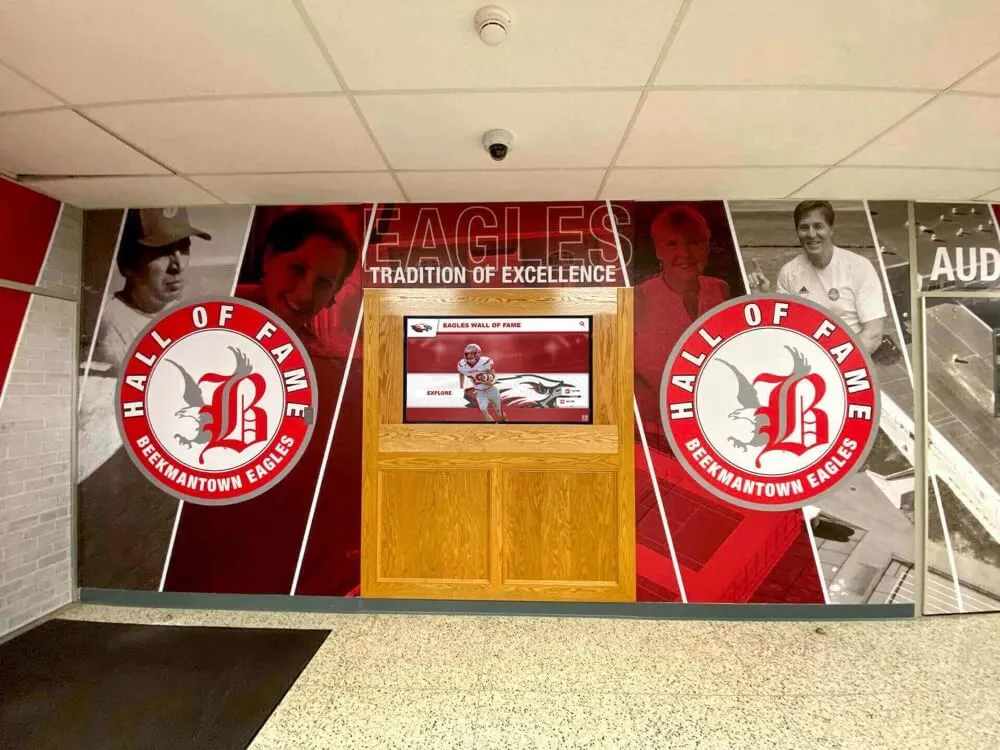
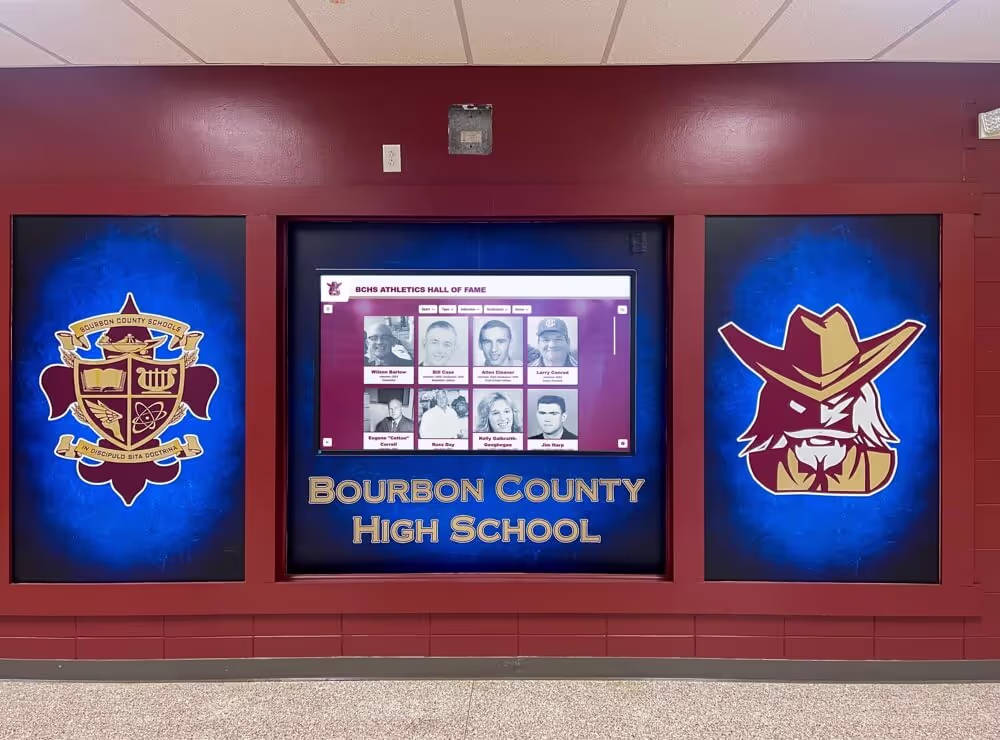
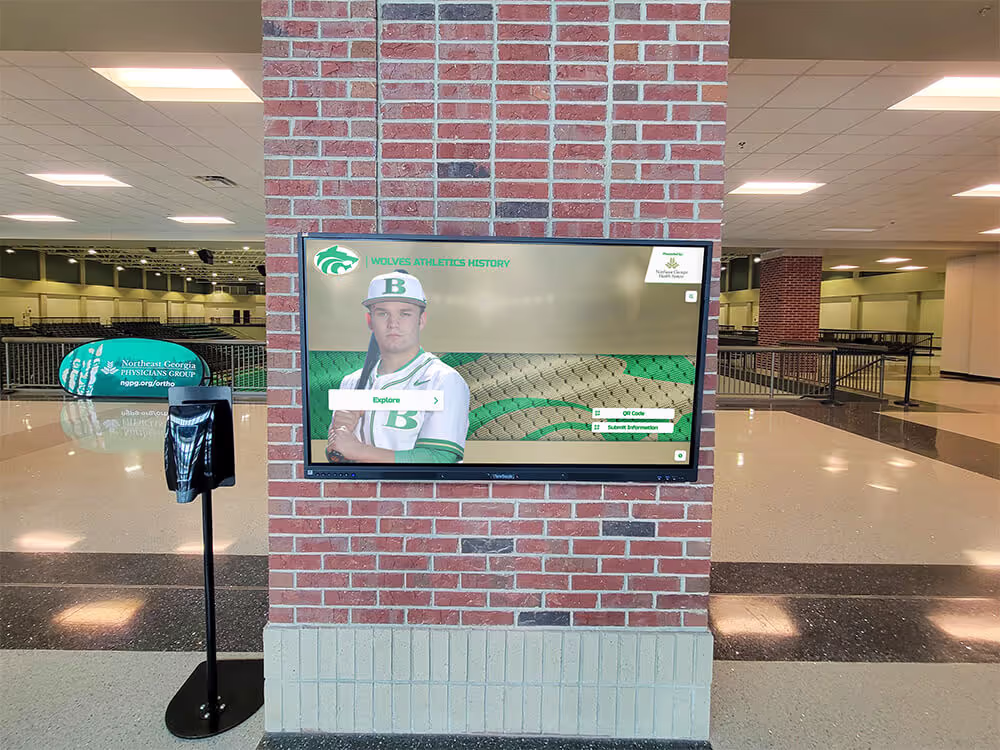
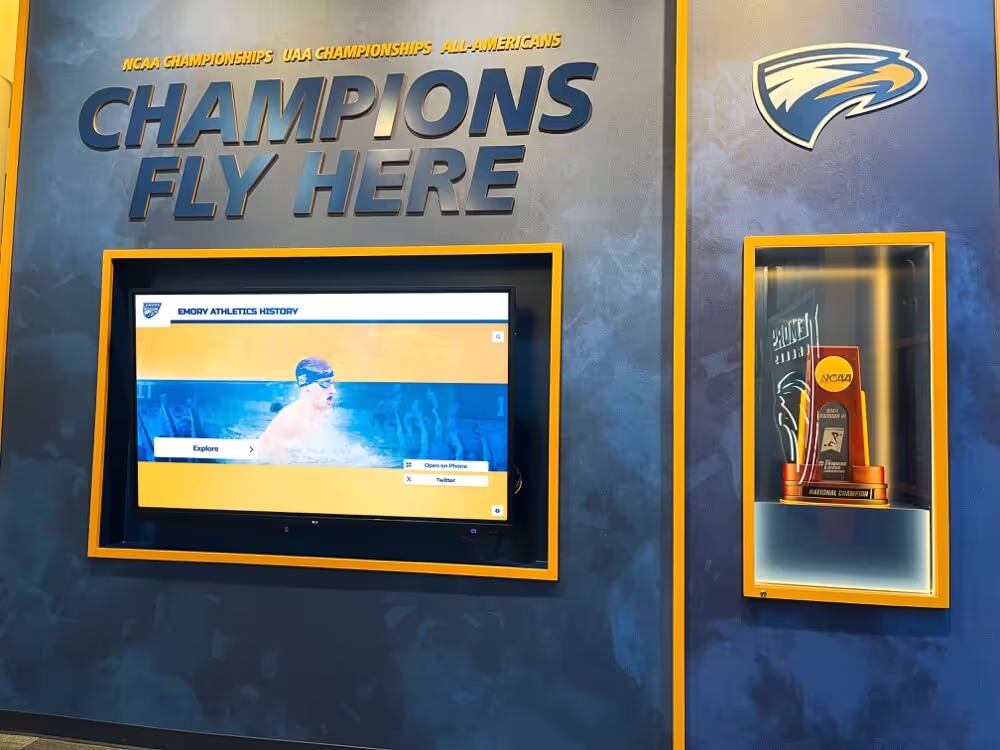
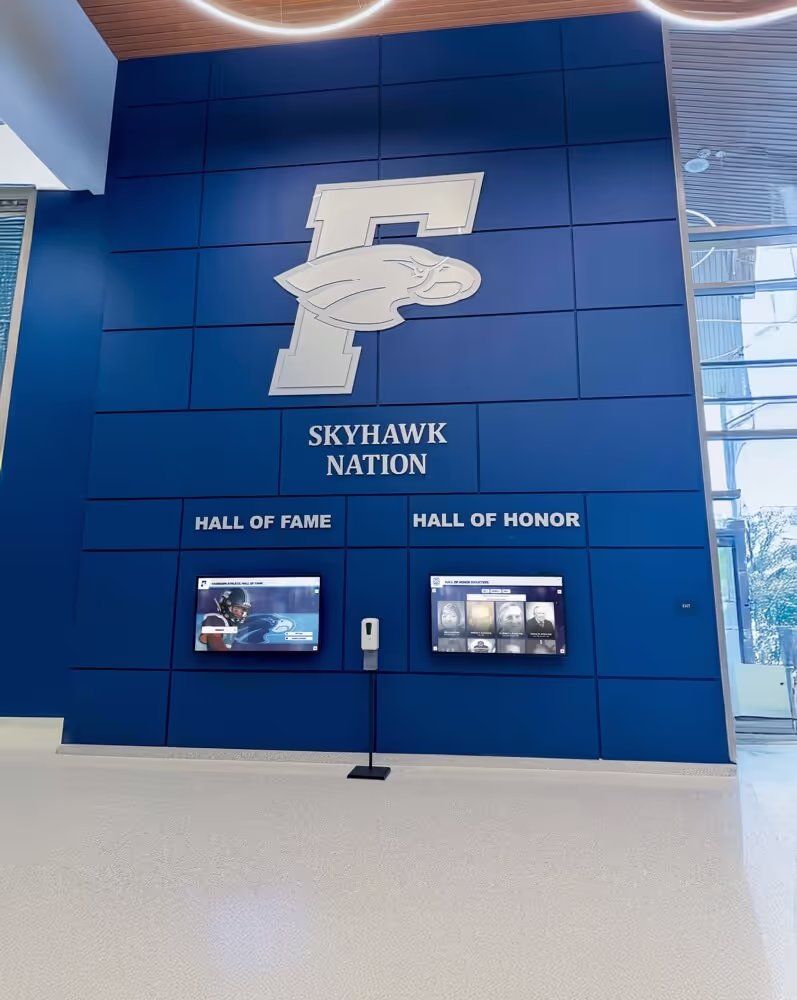
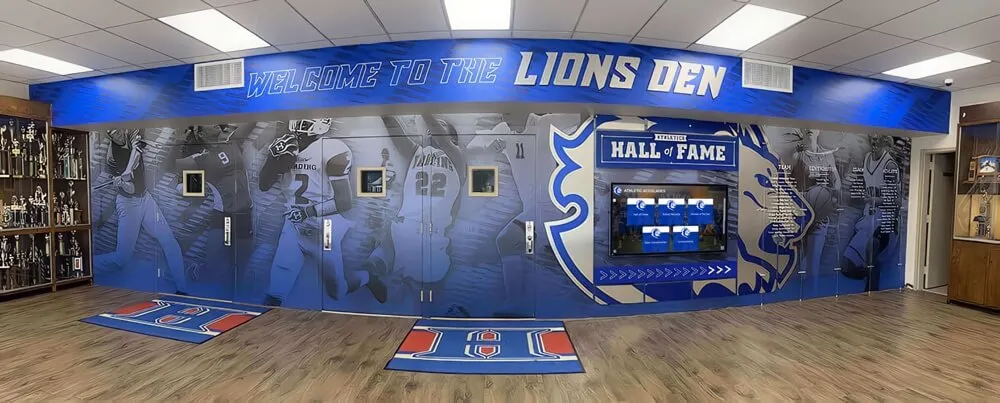
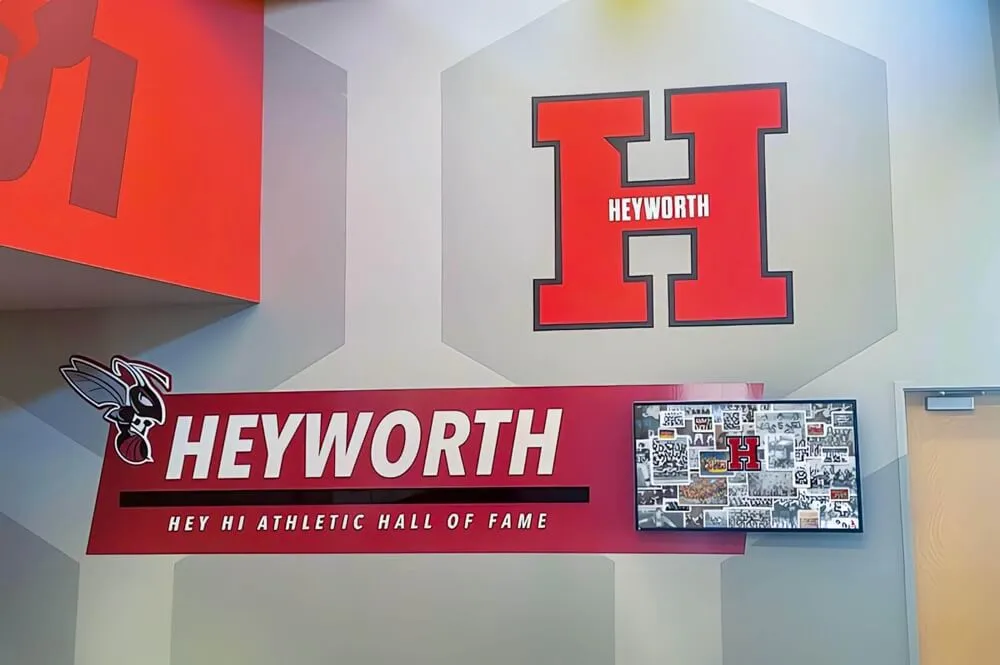
Sports Recognition Facilities (N=64) Adoption rate of 66% with strong focus on athletic achievement recognition. These facilities achieved highest visitor engagement metrics (9.8 minutes mean dwell time) and reported strongest ROI (median 14-month cost recovery). 81% included video highlights—highest multimedia adoption among segments.
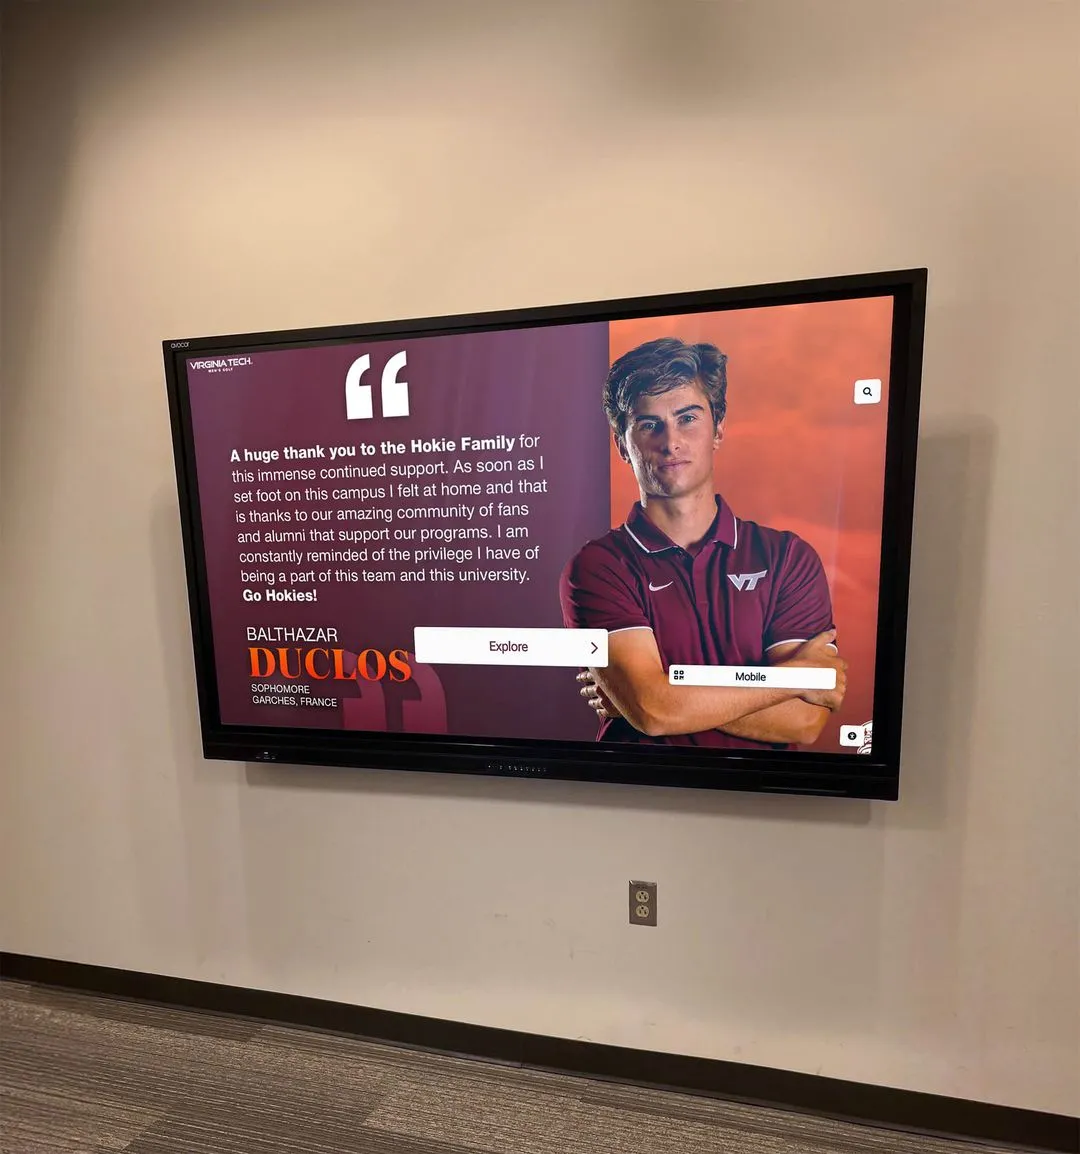
Educational Institutions (N=42) Universities and schools showed 57% adoption with emphasis on alumni engagement and donor recognition. 67% provided web-based access for geographically distributed stakeholders. Implementation decisions emphasized long-term content management sustainability over feature richness.
What This Means for Museums & Cultural Institutions
Strategic Implications
Our findings support several strategic conclusions for institutions considering interactive display investments:
Insight 1: Technology adoption reached mainstream acceptance
With 63% adoption among surveyed institutions and accelerating growth rates, interactive displays transitioned from experimental novelty to standard expectation. Institutions without interactive capabilities increasingly face competitive disadvantages in visitor attraction and satisfaction.
Evidence: Adoption increased 54% (41% to 63%) in just three years. Visitor dwell time improvements of 3.2x represent substantial engagement enhancement. 68% achieved positive ROI within 24 months.
Implication: Museums should treat interactive display planning as “when” rather than “if” strategic decisions. Delay risks falling behind visitor expectations shaped by peer institutions.
Insight 2: Content management determines implementation success
While technology reliability and user interface quality matter, sustained content development and updates emerged as the primary success differentiator. Failed implementations overwhelmingly (83%) cited inadequate ongoing content management.
Evidence: Content development consumed 51% of implementation timelines. 71% of institutions cited content management as their primary ongoing challenge. Discontinued implementations showed 83% correlation with lack of content updates.
Implication: Institutions must secure sustained content management resources—staff time, budget, and processes—before committing to interactive display investments. Technology without content strategy produces expensive failures.
Insight 3: Accessibility remains critically underserved
Despite legal requirements and ethical imperatives for accessible public facilities, only 47% of interactive installations achieve WCAG 2.1 AA compliance. This represents both institutional risk and missed opportunities to serve visitors with disabilities.
Evidence: 47% WCAG compliance rate; 67% incompatible with screen readers; 71% lack keyboard/switch navigation alternatives; 52% feature inadequately sized touch targets.
Implication: Institutions must prioritize accessibility from project inception, consulting specialists early and testing with diverse users. Post-implementation remediation proves more difficult and expensive than accessible initial design.
Insight 4: Purpose-built platforms outperform adapted alternatives
Purpose-built museum and recognition software consistently delivered superior visitor engagement, content management efficiency, and institutional satisfaction compared to digital signage platforms adapted for museum use.
Evidence: Purpose-built platforms showed 78% satisfaction rates vs 43% for adapted signage software. Search and filtering capabilities—crucial for visitor engagement—appeared in 89% of purpose-built platforms but only 28% of adapted solutions. Analytics and reporting showed 86% vs 38% availability.
Implication: While purpose-built platforms require higher licensing fees (typically 40-80% premiums), institutions achieve better outcomes through platforms designed for interactive content exploration rather than passive content display. Software cost differentials prove minor compared to total implementation budgets and long-term operational efficiency.
Insight 5: Mobile integration multiplies physical display value
Institutions extending interactive content through mobile-accessible web platforms reported substantially higher visitor satisfaction (47% improvement) and social media engagement (3.2x increase) compared to display-only implementations.
Evidence: 58% of institutions now offer mobile integration (up from 31% in 2022). Visitors using mobile continuation features viewed 4.7x more content items. Web-accessible online recognition platforms enable geographically unlimited access.
Implication: Institutions should select technology platforms providing both physical display and web-based access from unified content management systems. This hybrid approach maximizes content development ROI by serving both on-site and remote audiences.
Research Limitations & Future Study
This research presents several limitations warranting consideration:
Sample Bias: Our sample emphasized institutions that recently implemented or actively planned interactive displays, potentially overrepresenting technologically progressive organizations and undersampling institutions resistant to digital technology adoption.
Self-Reported Data: Financial and engagement metrics relied partially on institutional self-reporting rather than independently verified accounting. Institutions may systematically over-report positive outcomes and under-report implementation difficulties.
Short Time Horizons: ROI and engagement data reflect 12-24 month windows. Long-term technology lifespan, maintenance costs, and sustained engagement patterns require longitudinal study extending beyond available data.
Geographic Scope: Our sample concentrated in North America. International museums, particularly in Europe, Asia, and developing regions, may demonstrate different adoption patterns, implementation challenges, and visitor engagement profiles.
Evolving Technology: Rapid technology advancement means findings regarding specific hardware, software, and integration approaches may become dated quickly. Particularly for emerging technologies like AI and AR, current adoption rates and outcomes may not predict future implementations.
Future research should examine international adoption patterns, conduct longitudinal studies tracking 5-10 year implementation outcomes, investigate visitor learning outcomes (not just engagement metrics), analyze impact on diverse visitor populations with disaggregated demographic data, and evaluate environmental sustainability of display technology lifecycle costs.
Conclusion: Data-Driven Interactive Display Implementation
The evidence supports strong rationale for interactive display adoption by museums and cultural institutions. With 3.2x visitor engagement improvements, measurable financial returns within 24 months for 68% of implementations, and mainstream adoption rates reaching 63%, interactive touchscreen technology transitioned from experimental innovation to institutional expectation.
However, success requires strategic approach rather than technology alone. Institutions must prioritize sustained content management resources, implement accessibility from project inception rather than as afterthought, select purpose-built platforms designed for interactive content exploration, establish formal update protocols and staff responsibilities, and extend physical displays through mobile-accessible web platforms.
The 32% of implementations failing to achieve positive ROI and 16% discontinued within 24 months demonstrate that technology deployment without comprehensive implementation strategy produces expensive failures. Museums considering interactive displays should conduct realistic assessments of ongoing content management capacity, accessibility requirements, technology platform alignment with institutional needs, staff training investment, and financial sustainability before committing to implementation.
For institutions prepared to make these strategic commitments, interactive displays deliver measurable improvements in visitor engagement, financial performance, and institutional mission advancement. The data validates investment for organizations treating interactive technology as ongoing content platform rather than one-time hardware installation.
Request a research briefing to explore how these findings apply to your specific institutional context and discuss implementation strategies aligned with your organizational capacity and visitor engagement objectives.
Frequently Asked Questions
What are the primary factors determining interactive display implementation success?
How do interactive displays compare to traditional museum exhibits for visitor engagement?
What is the typical return on investment timeline for interactive museum displays?
What percentage of interactive museum displays meet accessibility standards?
How much staff time is required to maintain interactive display content?
All trademarks are property of their respective owners. Rocket Alumni Solutions is not affiliated with or endorsed by any institution, platform, or organization mentioned in this research.
This comparison is based on publicly available information as of December 2026. All product names and trademarks belong to their respective owners. Comparative statements reflect Rocket Alumni Solutions’ interpretation of available data and may change over time.