


Intent: research
This benchmark report analyzes interactive campus storytelling practices across 423 admissions offices surveyed between June 2026 and November 2026, examining implementation approaches, technology platforms, engagement metrics, and yield rate impacts. The findings reveal that institutions incorporating interactive storytelling elements—particularly digital displays showcasing student experiences, alumni success, and institutional heritage—report yield rate improvements ranging from 18% to 31% compared to traditional tour-only approaches.
Interactive campus storytelling transforms standard facilities tours into engaging narratives that help prospective students envision themselves as part of the institutional community. Rather than passively observing buildings and hearing statistics, visitors interact with touchscreen displays featuring current student stories, explore alumni achievement galleries demonstrating outcome value, watch video testimonials from multiple perspectives, and discover institutional heritage that communicates stability and tradition.
This report provides actionable data for admissions directors, enrollment managers, and campus tour coordinators seeking to enhance recruitment effectiveness through evidence-based storytelling strategies.
Research Methodology
Sample Composition and Data Sources
This analysis synthesizes multiple data sources collected between June 2026 and November 2026:
Survey Data: 423 total institutional responses comprising 287 four-year colleges and universities (67.8%), 89 two-year community colleges (21.0%), and 47 independent secondary schools (11.2%). Geographic distribution included 48 U.S. states, with concentration in California (51 institutions), Texas (44), New York (39), Pennsylvania (32), and Ohio (28).
Institutional Size Distribution:
- Small (under 2,000 students): 138 institutions (32.6%)
- Medium (2,000-5,000 students): 156 institutions (36.9%)
- Large (5,000-10,000 students): 87 institutions (20.6%)
- Very Large (over 10,000 students): 42 institutions (9.9%)
Rocket Alumni Solutions Implementation Sample: Quantitative analysis of tour engagement data from 67 client institutions that deployed interactive storytelling displays in high-traffic tour routes between January 2022 and September 2026, providing metrics on visitor interaction patterns, dwell times, and correlation with enrollment outcomes.
Admissions Yield Analysis: Comparison of yield rates (accepted students who enroll) for tour participants exposed to interactive storytelling elements versus those experiencing traditional tours only, controlling for selectivity tier, institutional type, and tour group size.
Survey participants included admissions directors, enrollment management vice presidents, tour program coordinators, and communications officers responsible for campus visit experiences.
Key Findings Summary
Before examining detailed data, these high-level findings frame current interactive campus storytelling practices in admissions:
Yield Rate Impact Demonstrates Clear Value Institutions incorporating interactive storytelling into campus tours report mean yield rate improvements of 24% compared to pre-implementation baselines. Schools with comprehensive implementations (multiple touchpoints across tour routes) achieve yield gains of 27-31%, while those with limited implementations (single display location) report 18-22% improvements.
Traditional Tours Dominate Despite Known Limitations Only 31% of surveyed institutions have implemented any form of interactive storytelling technology on campus tours. Most schools (69%) continue relying exclusively on student guide narration and static signage, despite acknowledging limitations in engagement quality and information retention.
Technology Adoption Accelerated During COVID Survey responses indicate that 73% of institutions with interactive storytelling implemented these capabilities between 2020-2026, driven by virtual tour needs, social distancing requirements, and recognition that traditional approaches inadequately serve prospective families researching schools digitally.
Budget Constraints Cited as Primary Barrier Among institutions without interactive storytelling (69% of respondents), 78% cite budget limitations as the primary obstacle. However, institutions with implementations report typical total costs of $8,500-$24,000 for comprehensive deployments—substantially less than most schools assume before investigating specific solutions.
Student Stories and Alumni Outcomes Drive Highest Engagement Content analysis of 67 tracked installations reveals that displays featuring current student video testimonials generate mean dwell times of 2.8 minutes, alumni success profiles achieve 2.4 minutes, and institutional history content maintains attention for 1.9 minutes. Prospective students consistently prioritize peer experiences over administrative messaging.
Current State: Campus Tour Practices
Traditional Tour Approaches and Limitations
Campus tours have followed similar formats for decades, typically involving student guides leading groups of 10-20 prospective students and families through campus while narrating prepared scripts highlighting facilities, academic programs, and campus life highlights.
Standard Tour Components: Survey data reveals consistency in traditional tour elements:
- Campus walk covering 6-12 major buildings: 94% of institutions
- Student residence hall interior visits: 87% of institutions
- Dining facility tours: 81% of institutions
- Library or learning commons stops: 76% of institutions
- Athletic or recreation facility visits: 68% of institutions
- Academic building classroom visits: 61% of institutions
Mean tour duration: 87 minutes Median group size: 14 prospective students plus family members Student guide training: Mean 8.4 hours before leading tours independently
Documented Limitations of Traditional Approaches: Institutions identify consistent challenges with standard tour formats:
Information Overload and Low Retention (cited by 81% of institutions):
- Guides present 40-60 distinct facts during typical tours
- Prospective families retain average of 7-9 facts immediately post-tour
- Retention drops to 3-5 facts when surveyed 72 hours later
- Critical information (financial aid processes, application requirements) frequently forgotten
Inconsistent Guide Quality (cited by 73% of institutions):
- Student guide energy, knowledge, and presentation quality varies substantially
- Tours scheduled during exam periods or early mornings suffer quality degradation
- New guides require 3-4 tours before reaching proficiency
- Guide absences force last-minute substitutions affecting experience consistency
Limited Personalization (cited by 68% of institutions):
- Standard scripts address general audiences rather than individual interests
- STEM-focused students receive same tour as arts-focused prospects
- Limited ability to adjust content based on visitor priorities during scheduled group tours
- Time constraints prevent deep exploration of specific programs or facilities
Weather and Timing Challenges (cited by 64% of institutions):
- Outdoor walking tours compromised during extreme weather
- Summer tours lack student activity demonstrating campus energy
- Break period tours show empty facilities rather than vibrant communities
- Limited weekend tour availability despite high family demand
Engagement Quality Metrics
Institutions tracking tour effectiveness report metrics revealing engagement limitations of traditional approaches:
Post-Tour Surveys: Among institutions conducting visitor feedback (57% of respondents):
- “Very satisfied” rating: Mean 68%, range 42%-89%
- “Learned what I needed to know”: Mean 71% agreement
- “Could envision myself here”: Mean 64% agreement
- “Tour was memorable”: Mean 58% agreement
- “Differentiated from other schools”: Mean 47% agreement
These moderate satisfaction scores suggest room for improvement, particularly in differentiation and memorability—factors research correlates with enrollment decisions.
Tour-to-Application Conversion: Tracking data from 178 institutions monitoring application behavior:
- Prospective students who toured: 64% submit applications
- Those who toured and attended admitted student events: 79% submit applications
- Those who never visited: 31% submit applications
While tours substantially improve application rates compared to no visits, the 64% conversion leaves significant opportunity for enhancement through more engaging experiences.
Yield Rate Patterns: Analysis of 203 institutions tracking enrollment outcomes:
- Students who toured before applying: Mean 38% yield rate
- Students who toured after admission: Mean 29% yield rate
- Students who never visited: Mean 16% yield rate
Campus visits clearly drive enrollment, validating investment in tour quality improvements that can shift yield rates even modestly.
Interactive Storytelling Implementation Approaches
Technology Platform Categories
Institutions implementing interactive storytelling employ diverse technology approaches serving different strategic objectives:
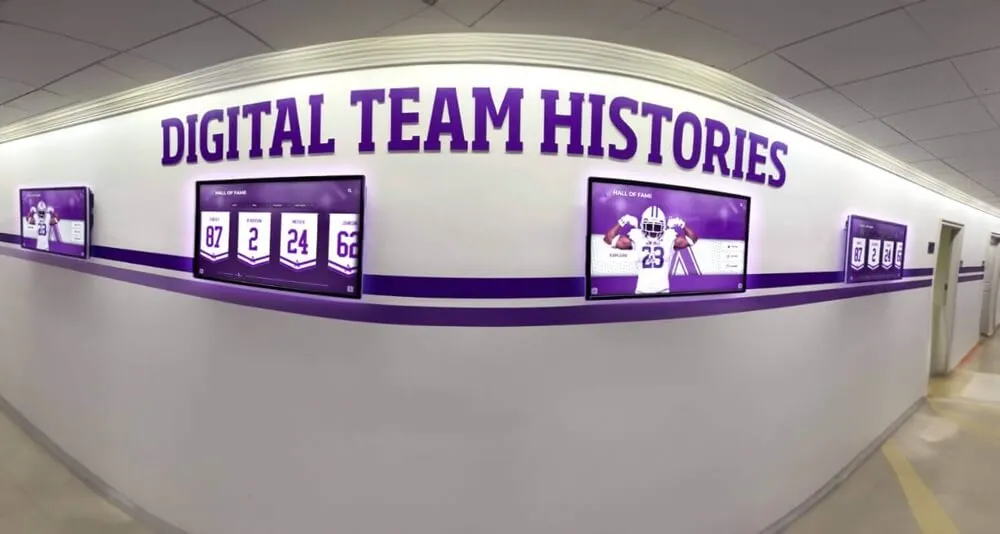
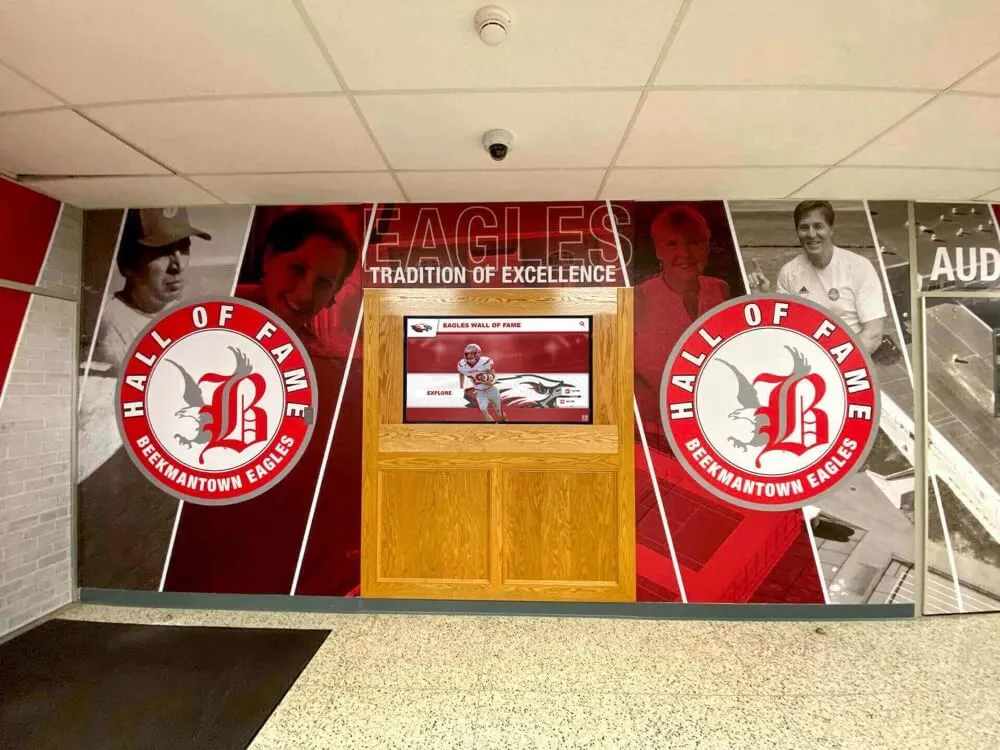
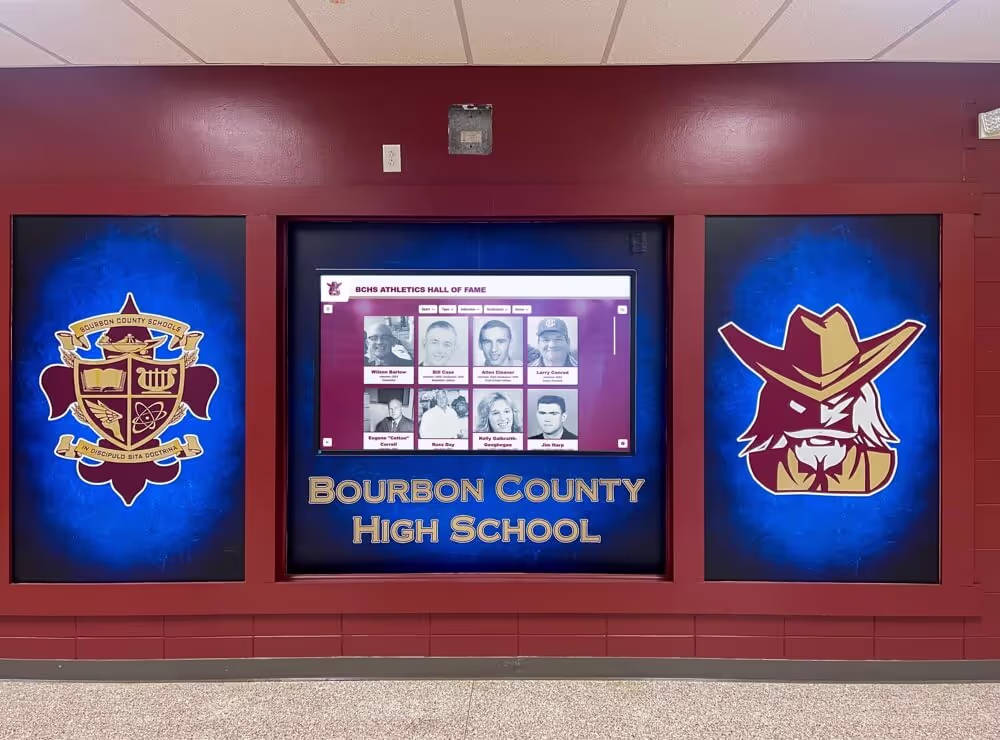
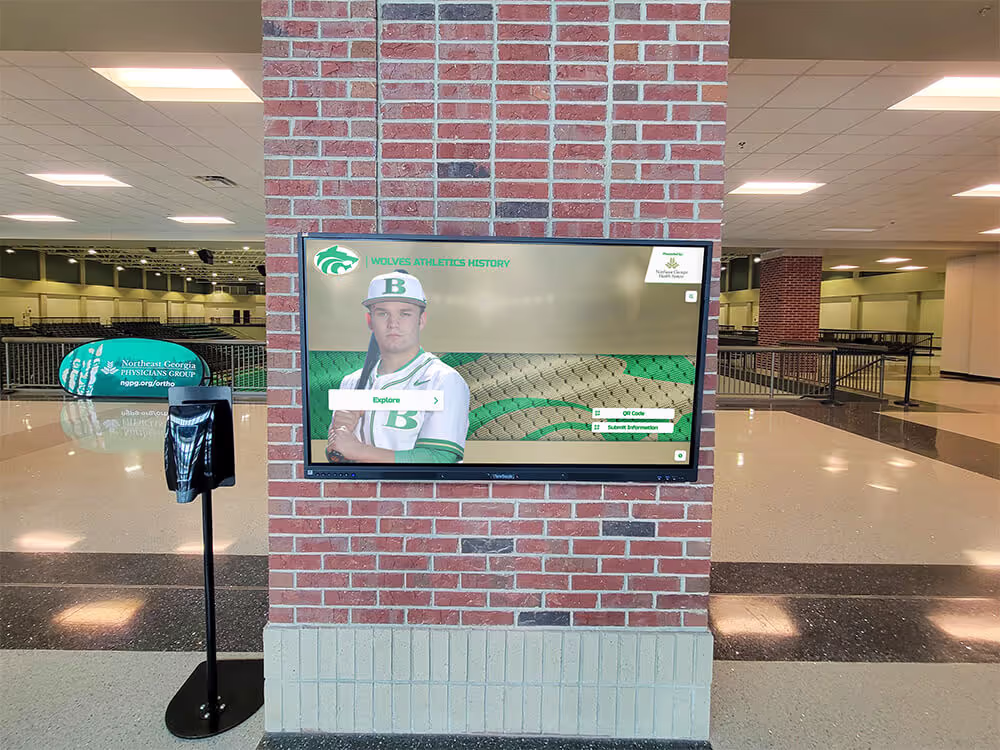
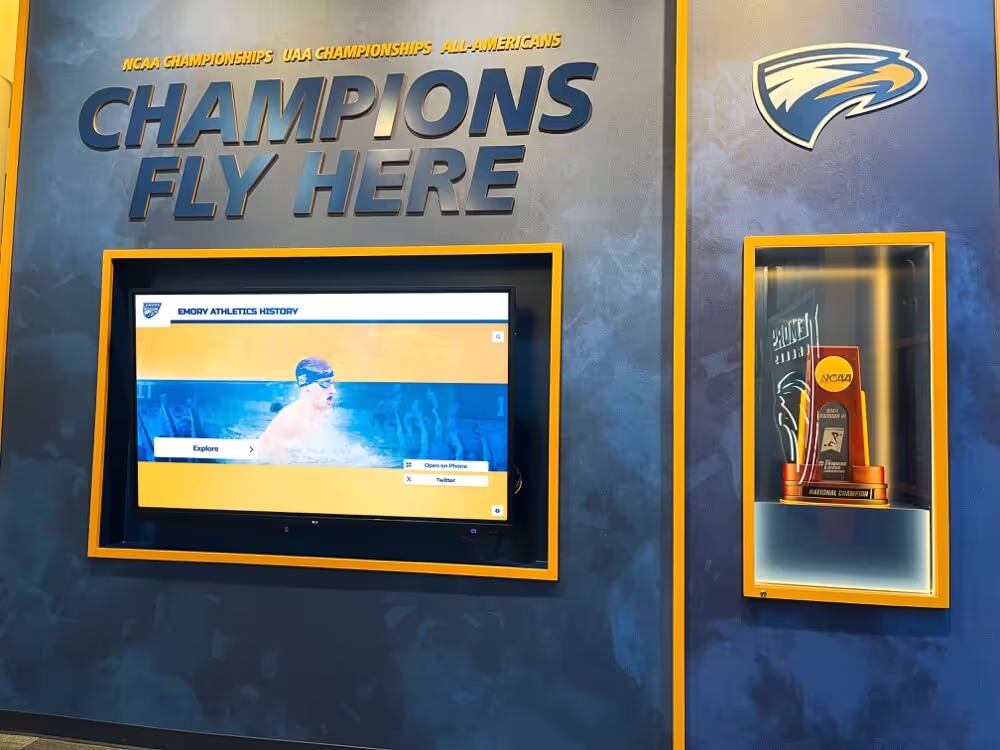
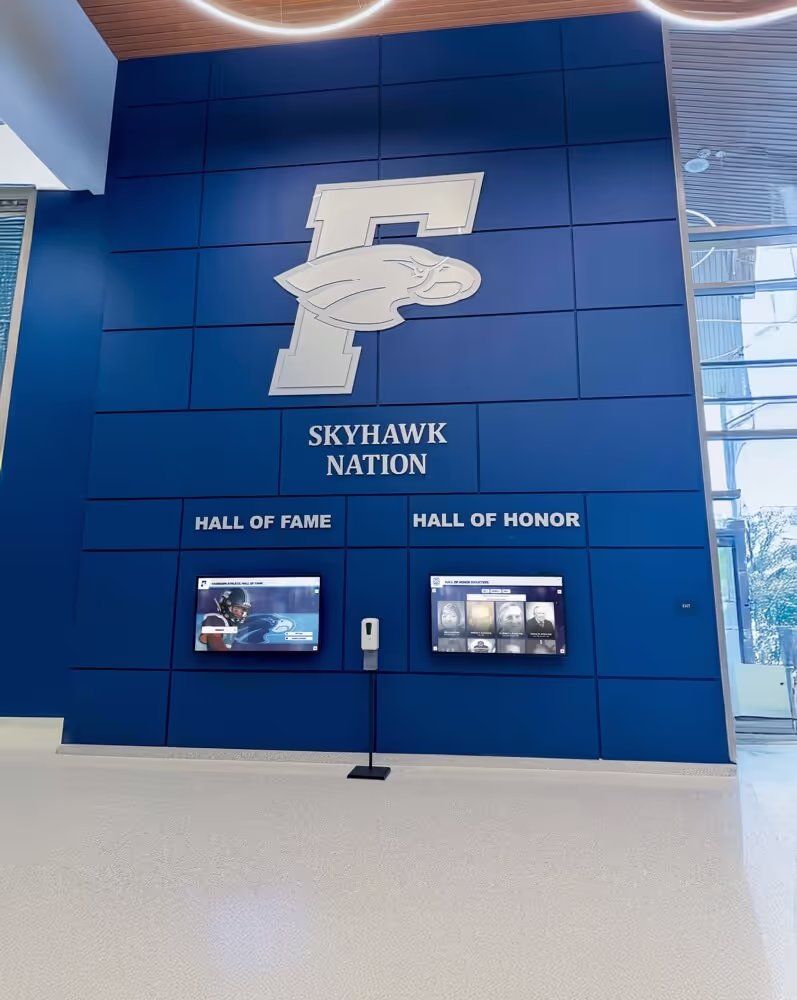
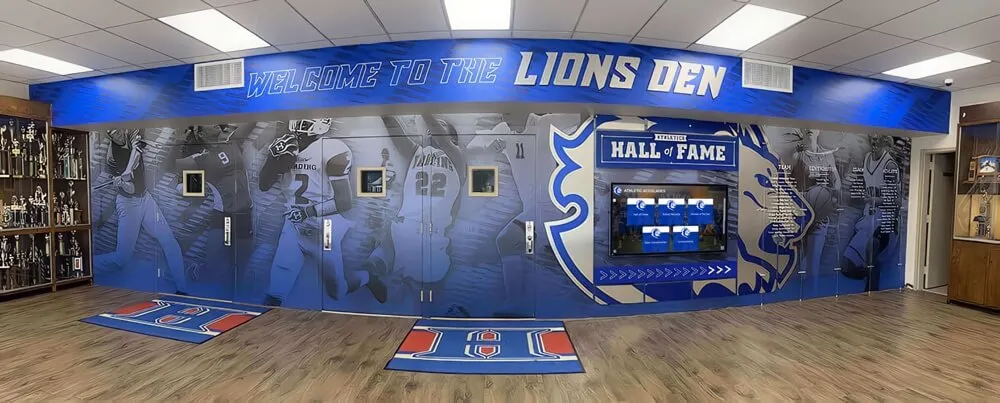
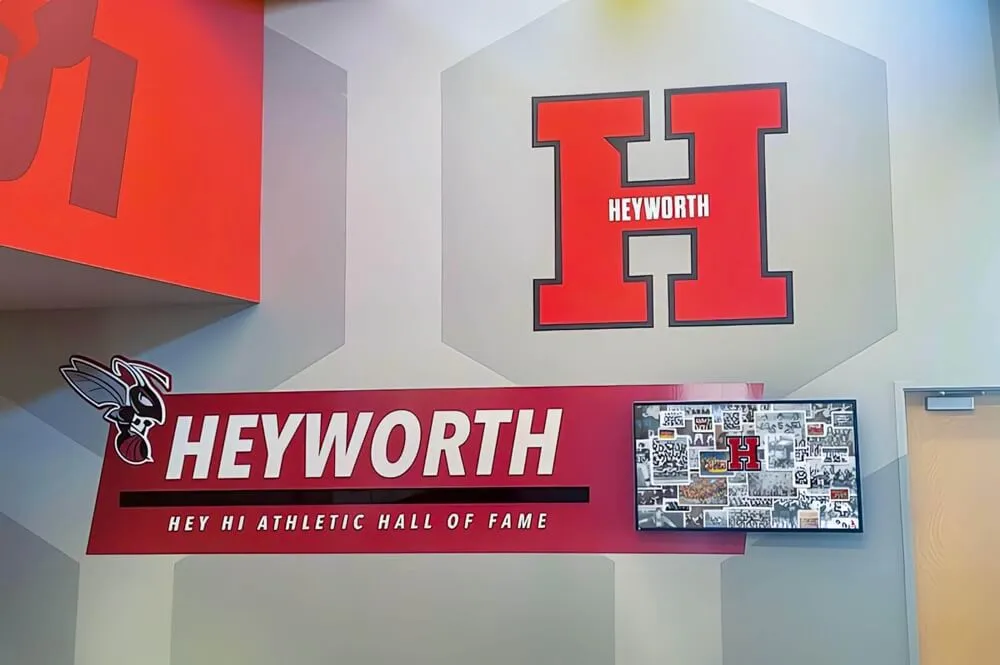
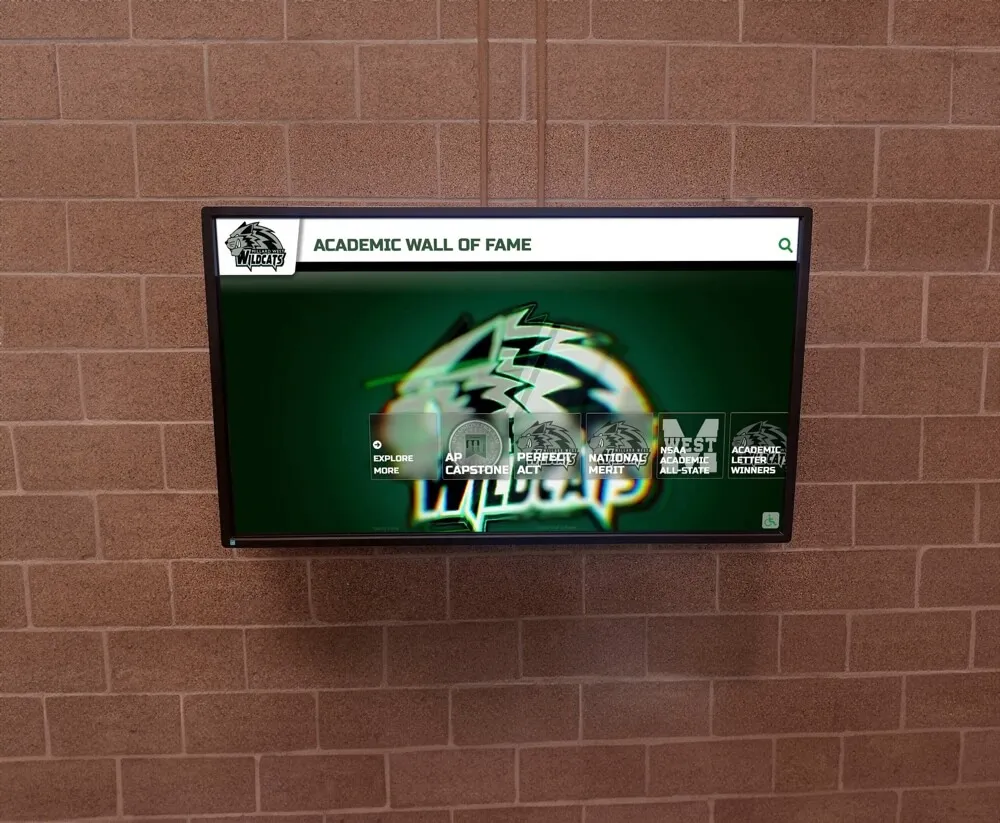
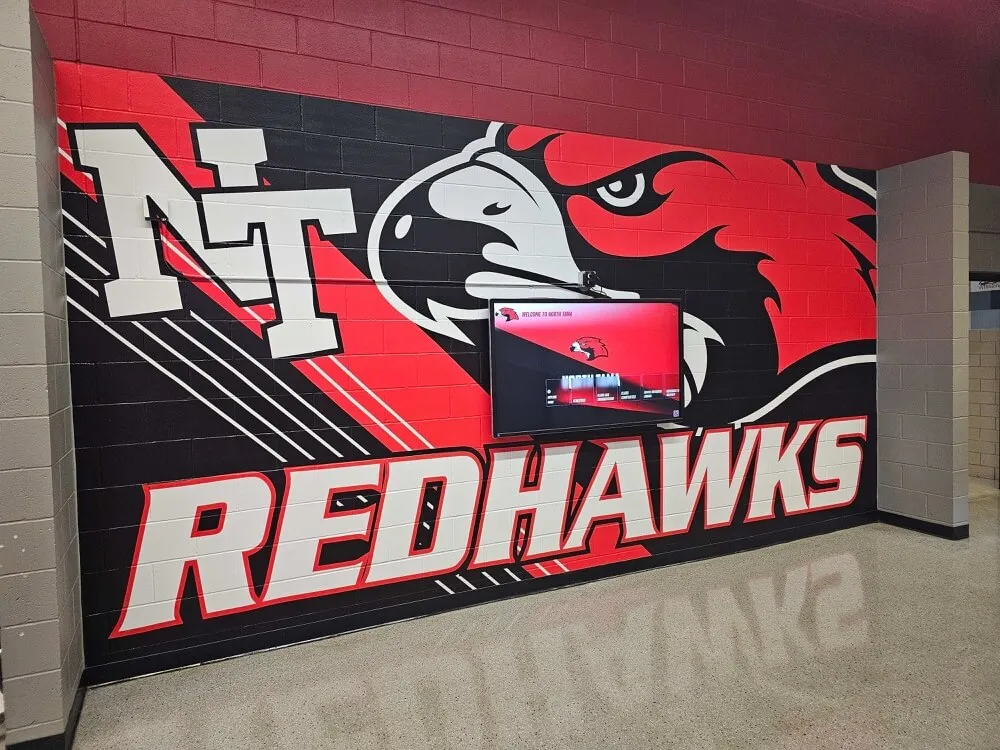
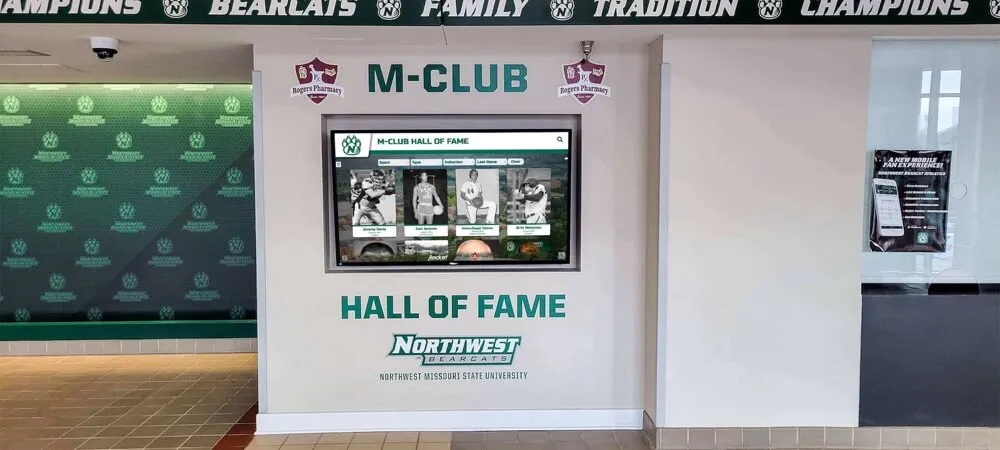
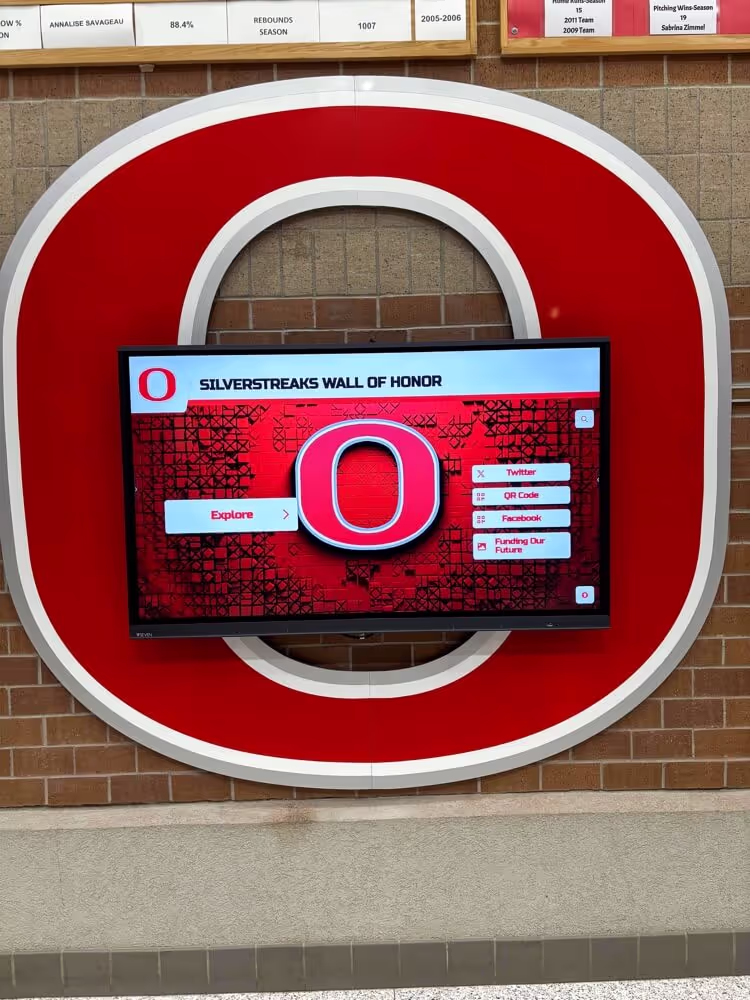
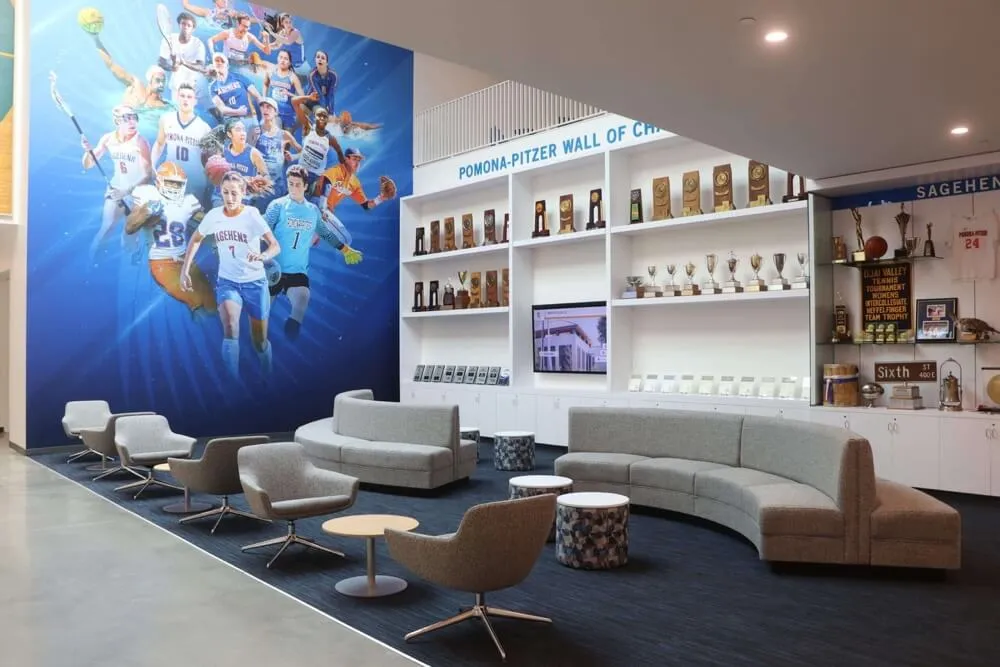
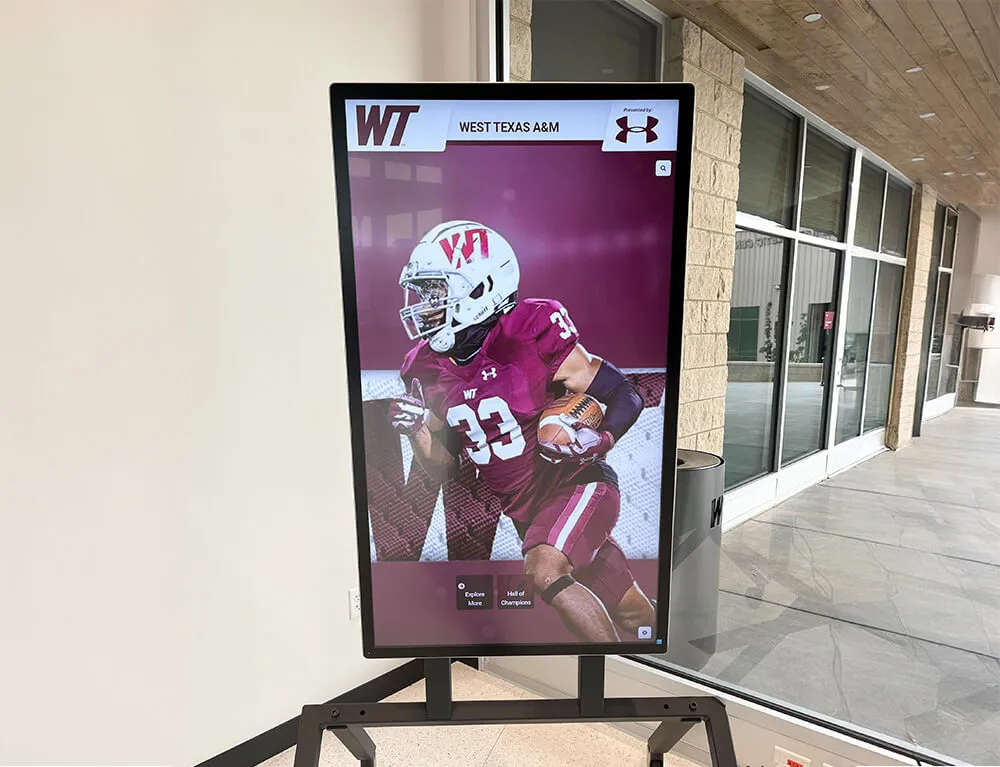
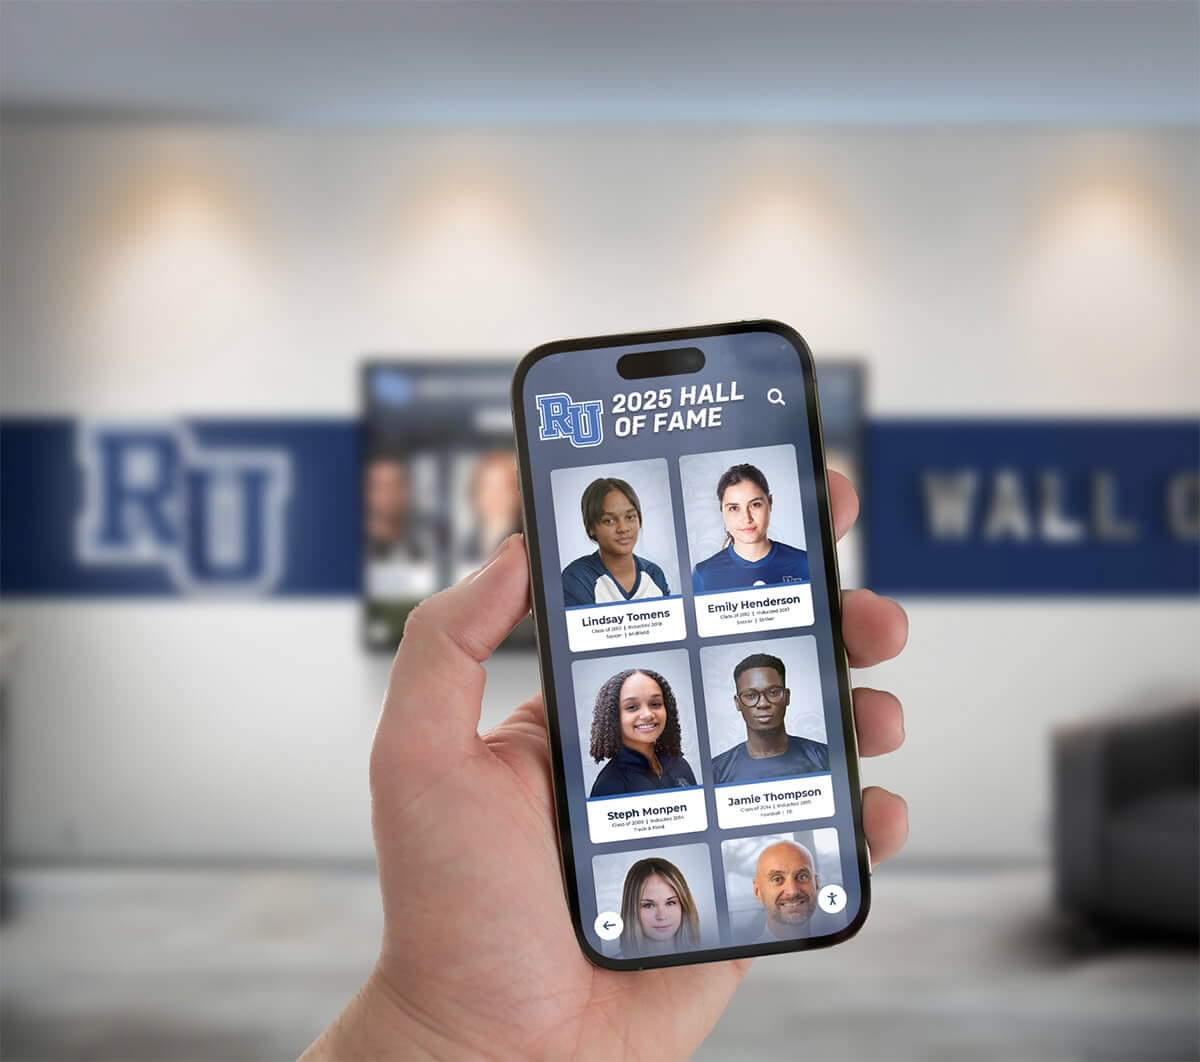
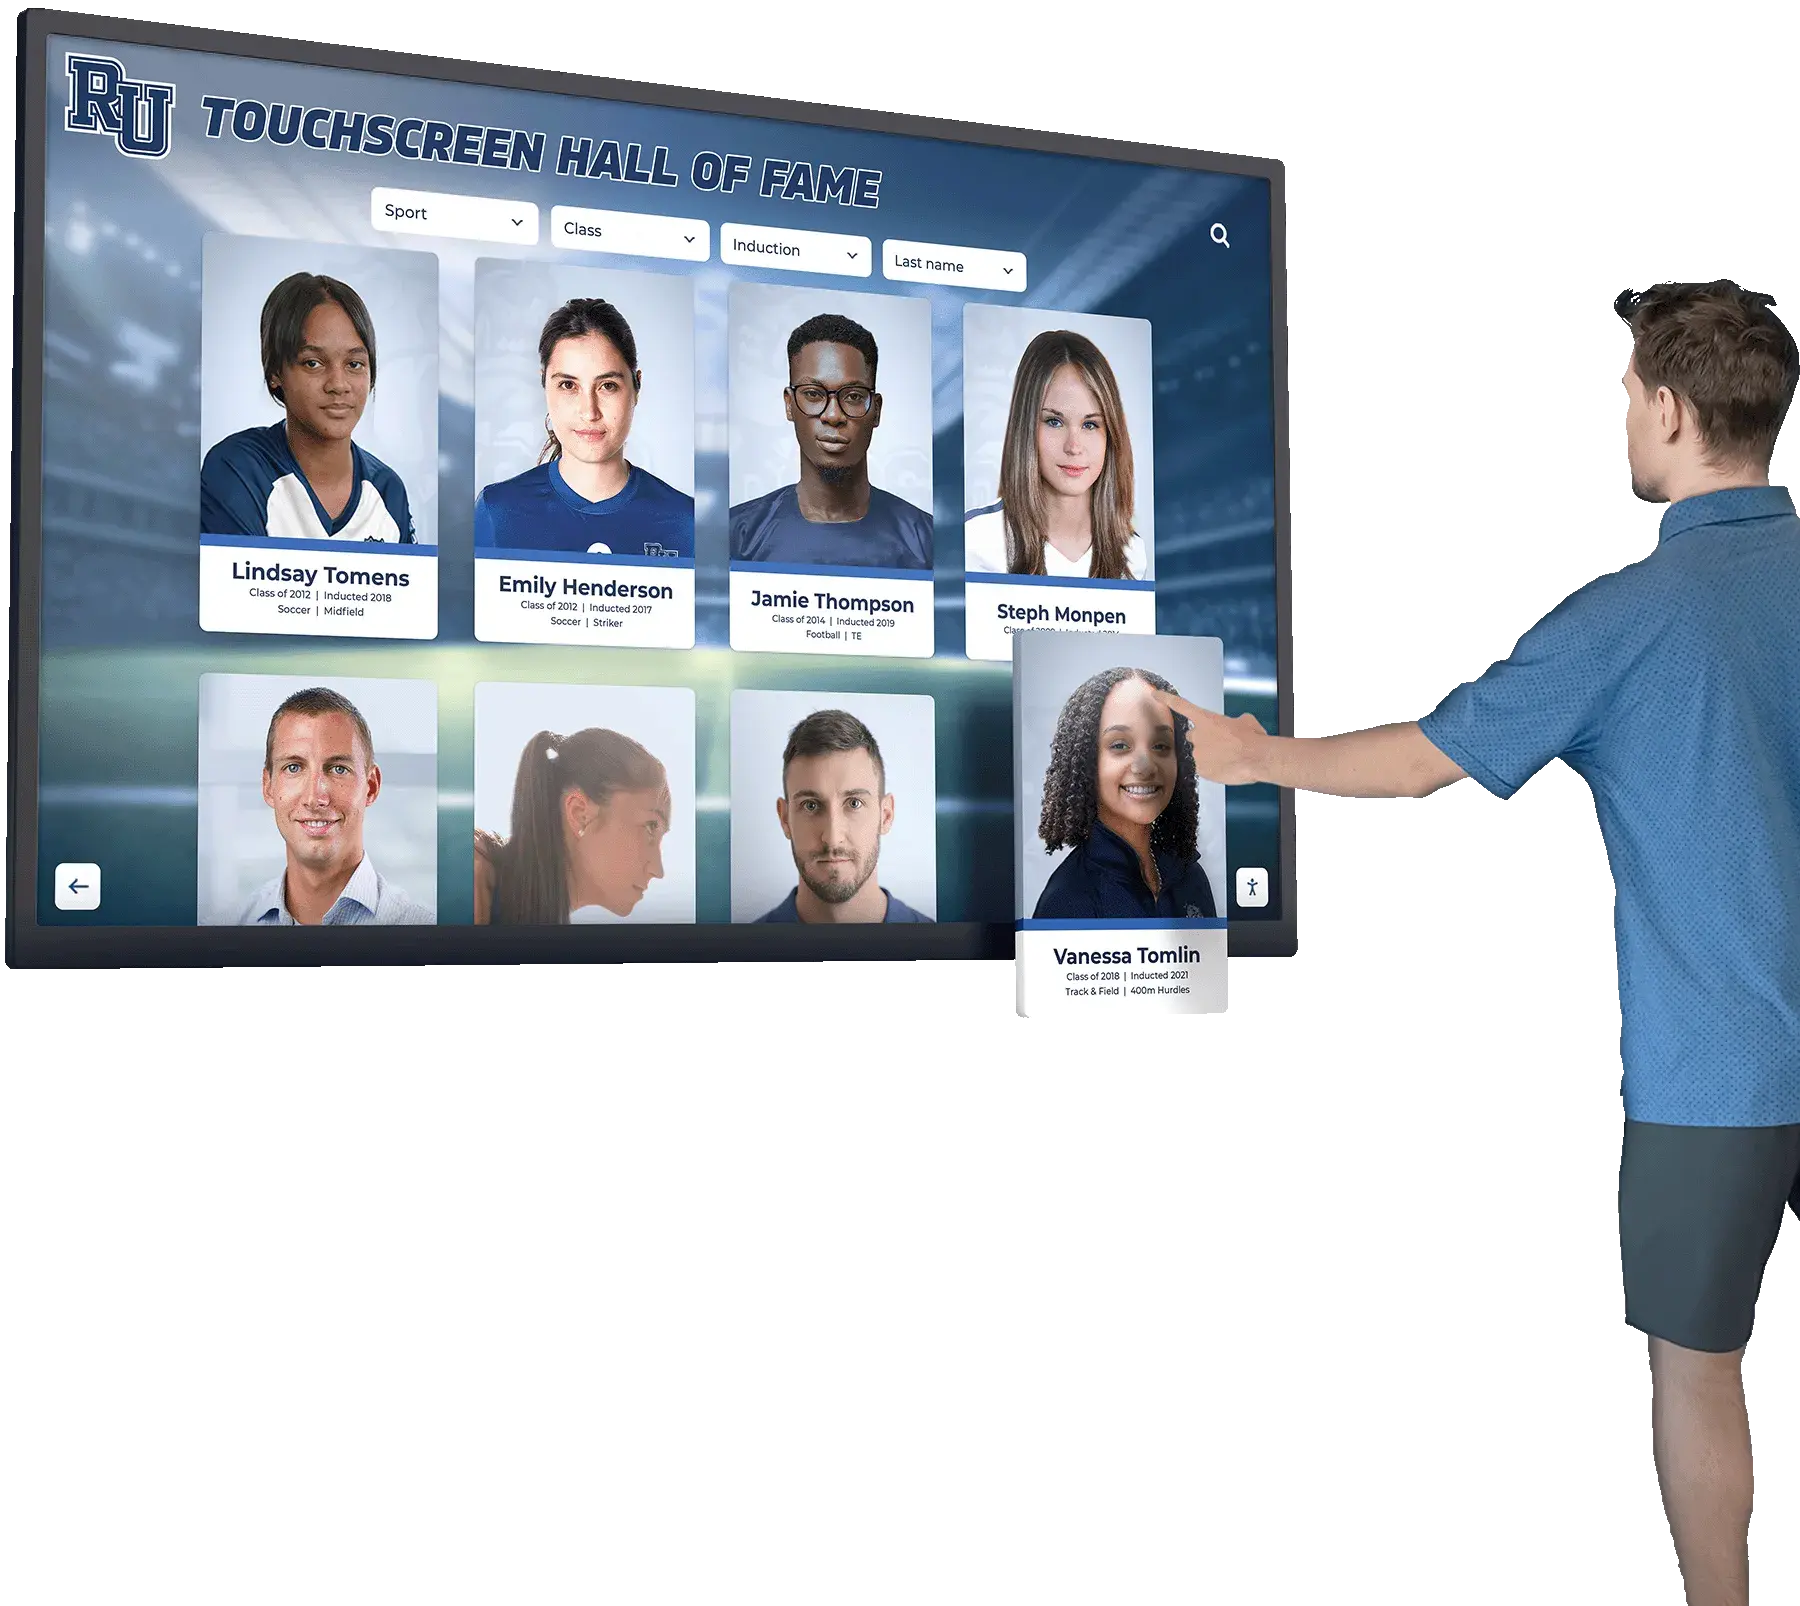
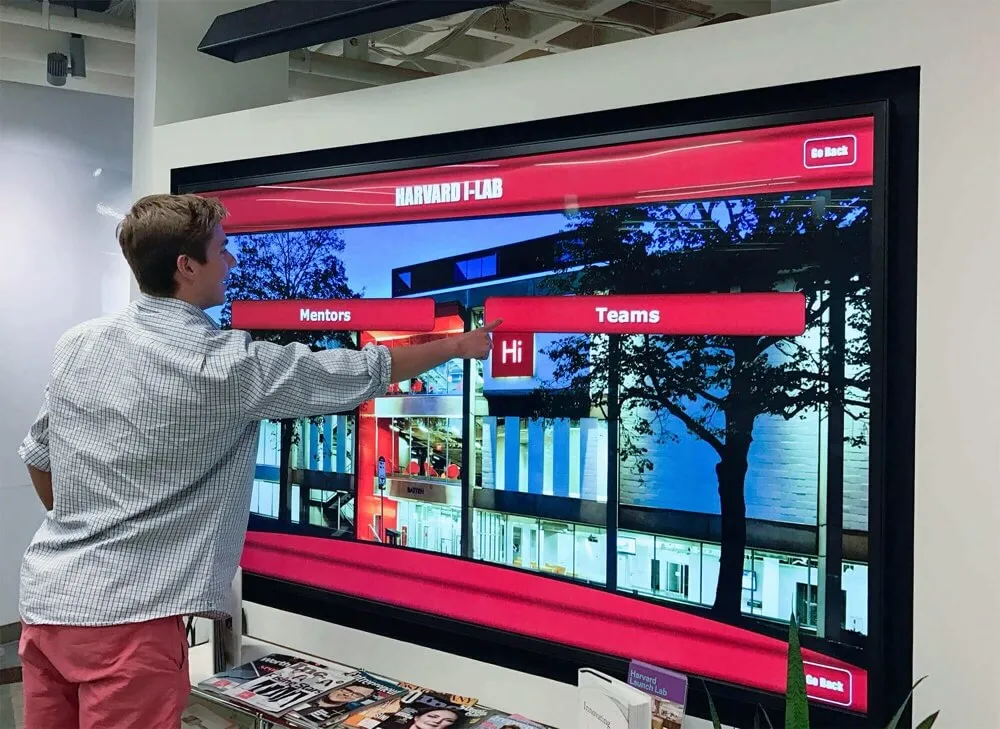
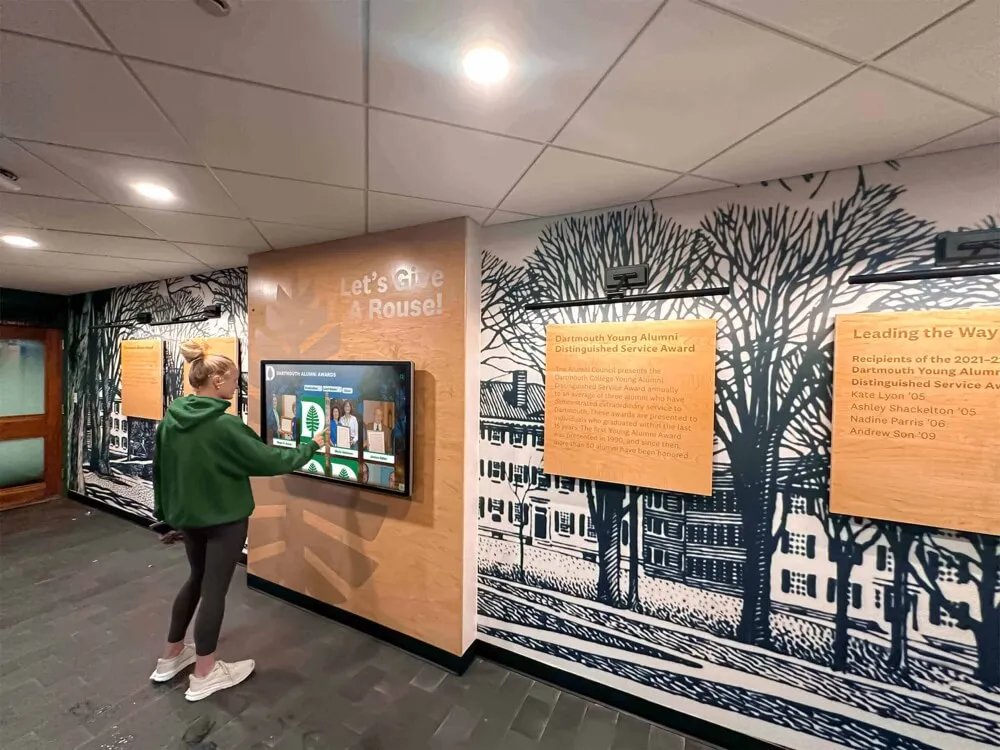
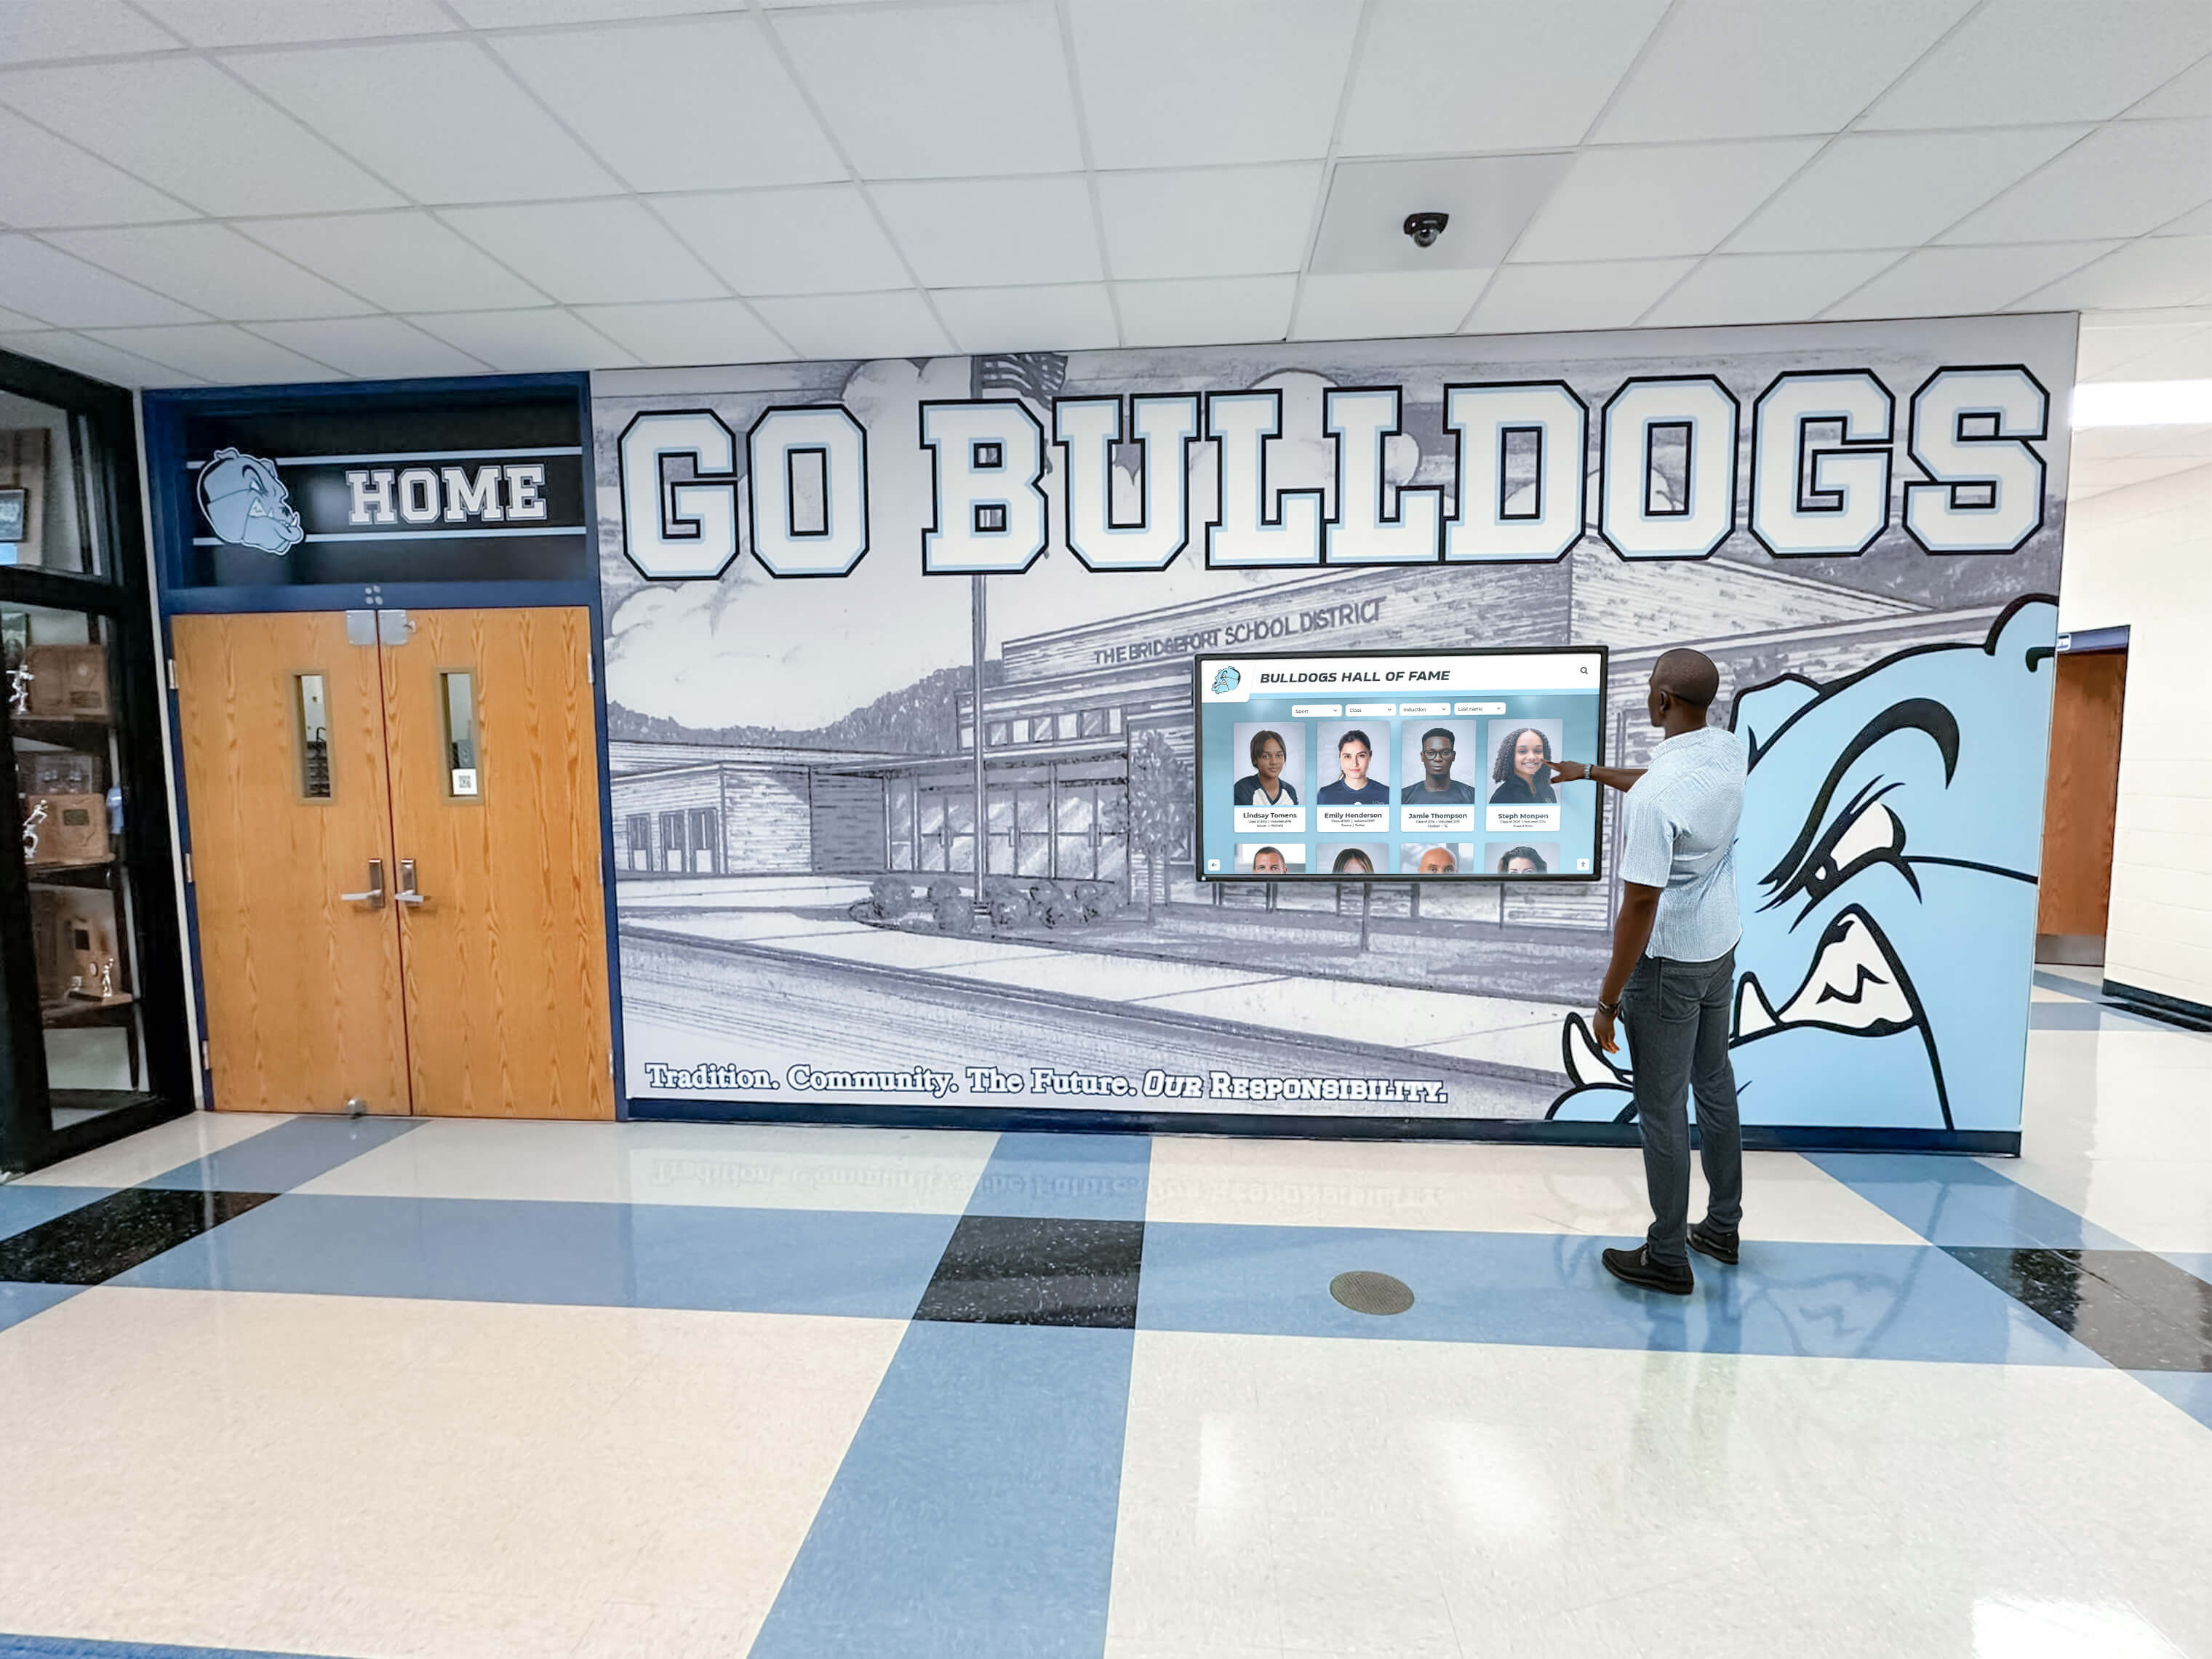
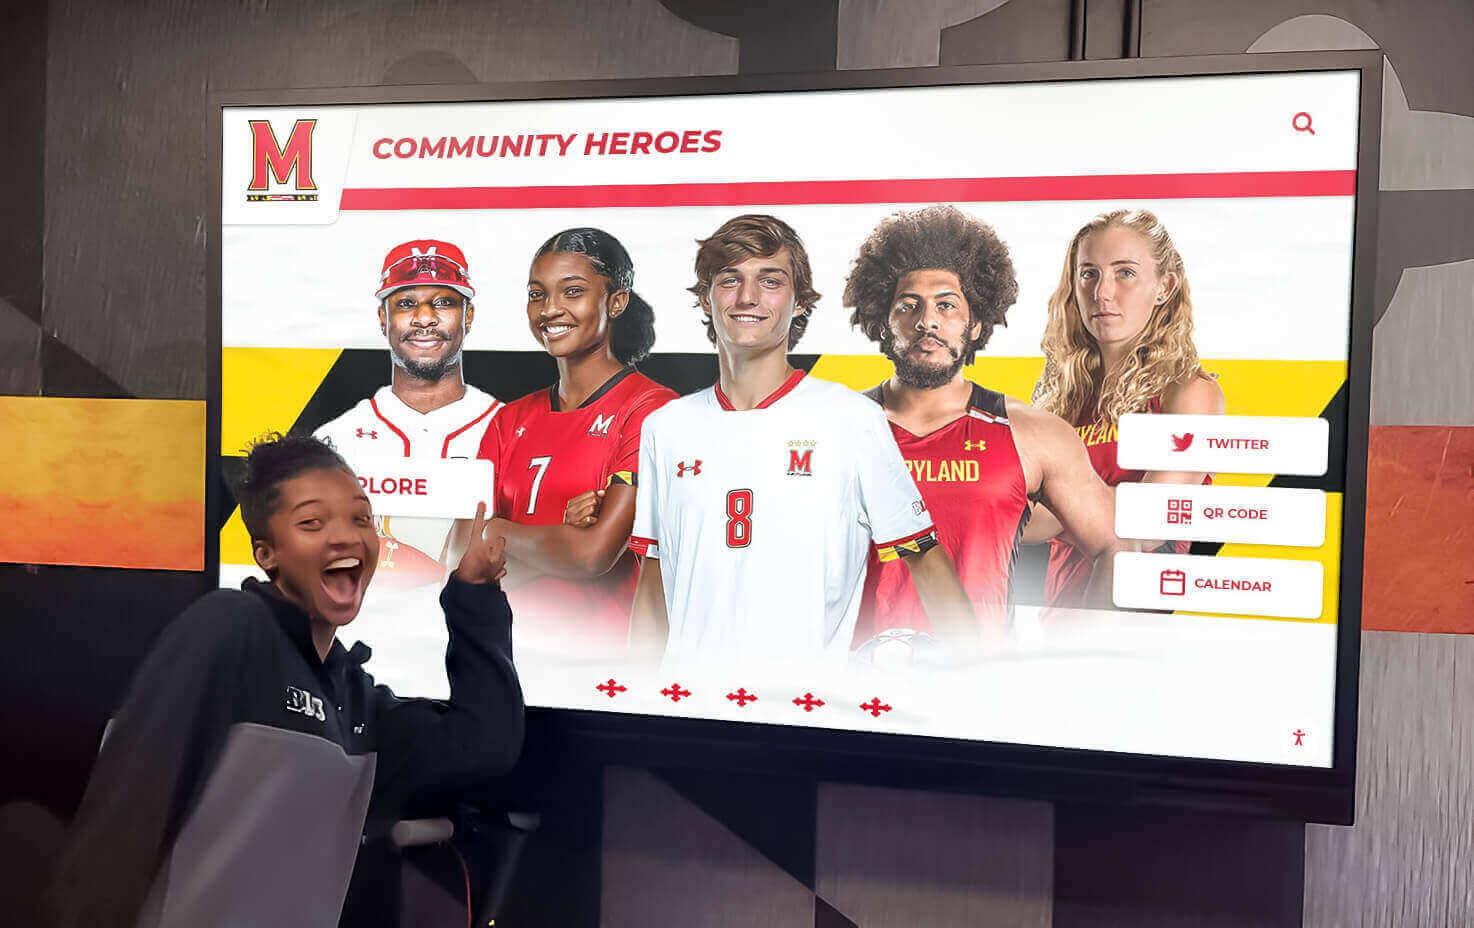
Fixed Touchscreen Displays (deployed by 76% of institutions with interactive storytelling):
Most common implementation involves commercial-grade touchscreen displays (43"-75" screens) positioned strategically along tour routes, typically in:
- Main campus center or union lobbies: 89% of installations
- Admissions office waiting areas: 71% of installations
- Residence hall common areas: 54% of installations
- Athletic facility main concourses: 47% of installations
- Academic building main lobbies: 43% of installations
Hardware costs: $2,800-$8,500 per display location Content platform subscriptions: $3,600-$12,000 annually Installation and infrastructure: $600-$2,200 per location
Fixed displays provide permanent installations that serve both scheduled tours and independent campus visitors exploring facilities outside formal tour times. Schools report that approximately 40% of touchscreen interactions occur outside scheduled tour hours, extending value beyond guided visits.
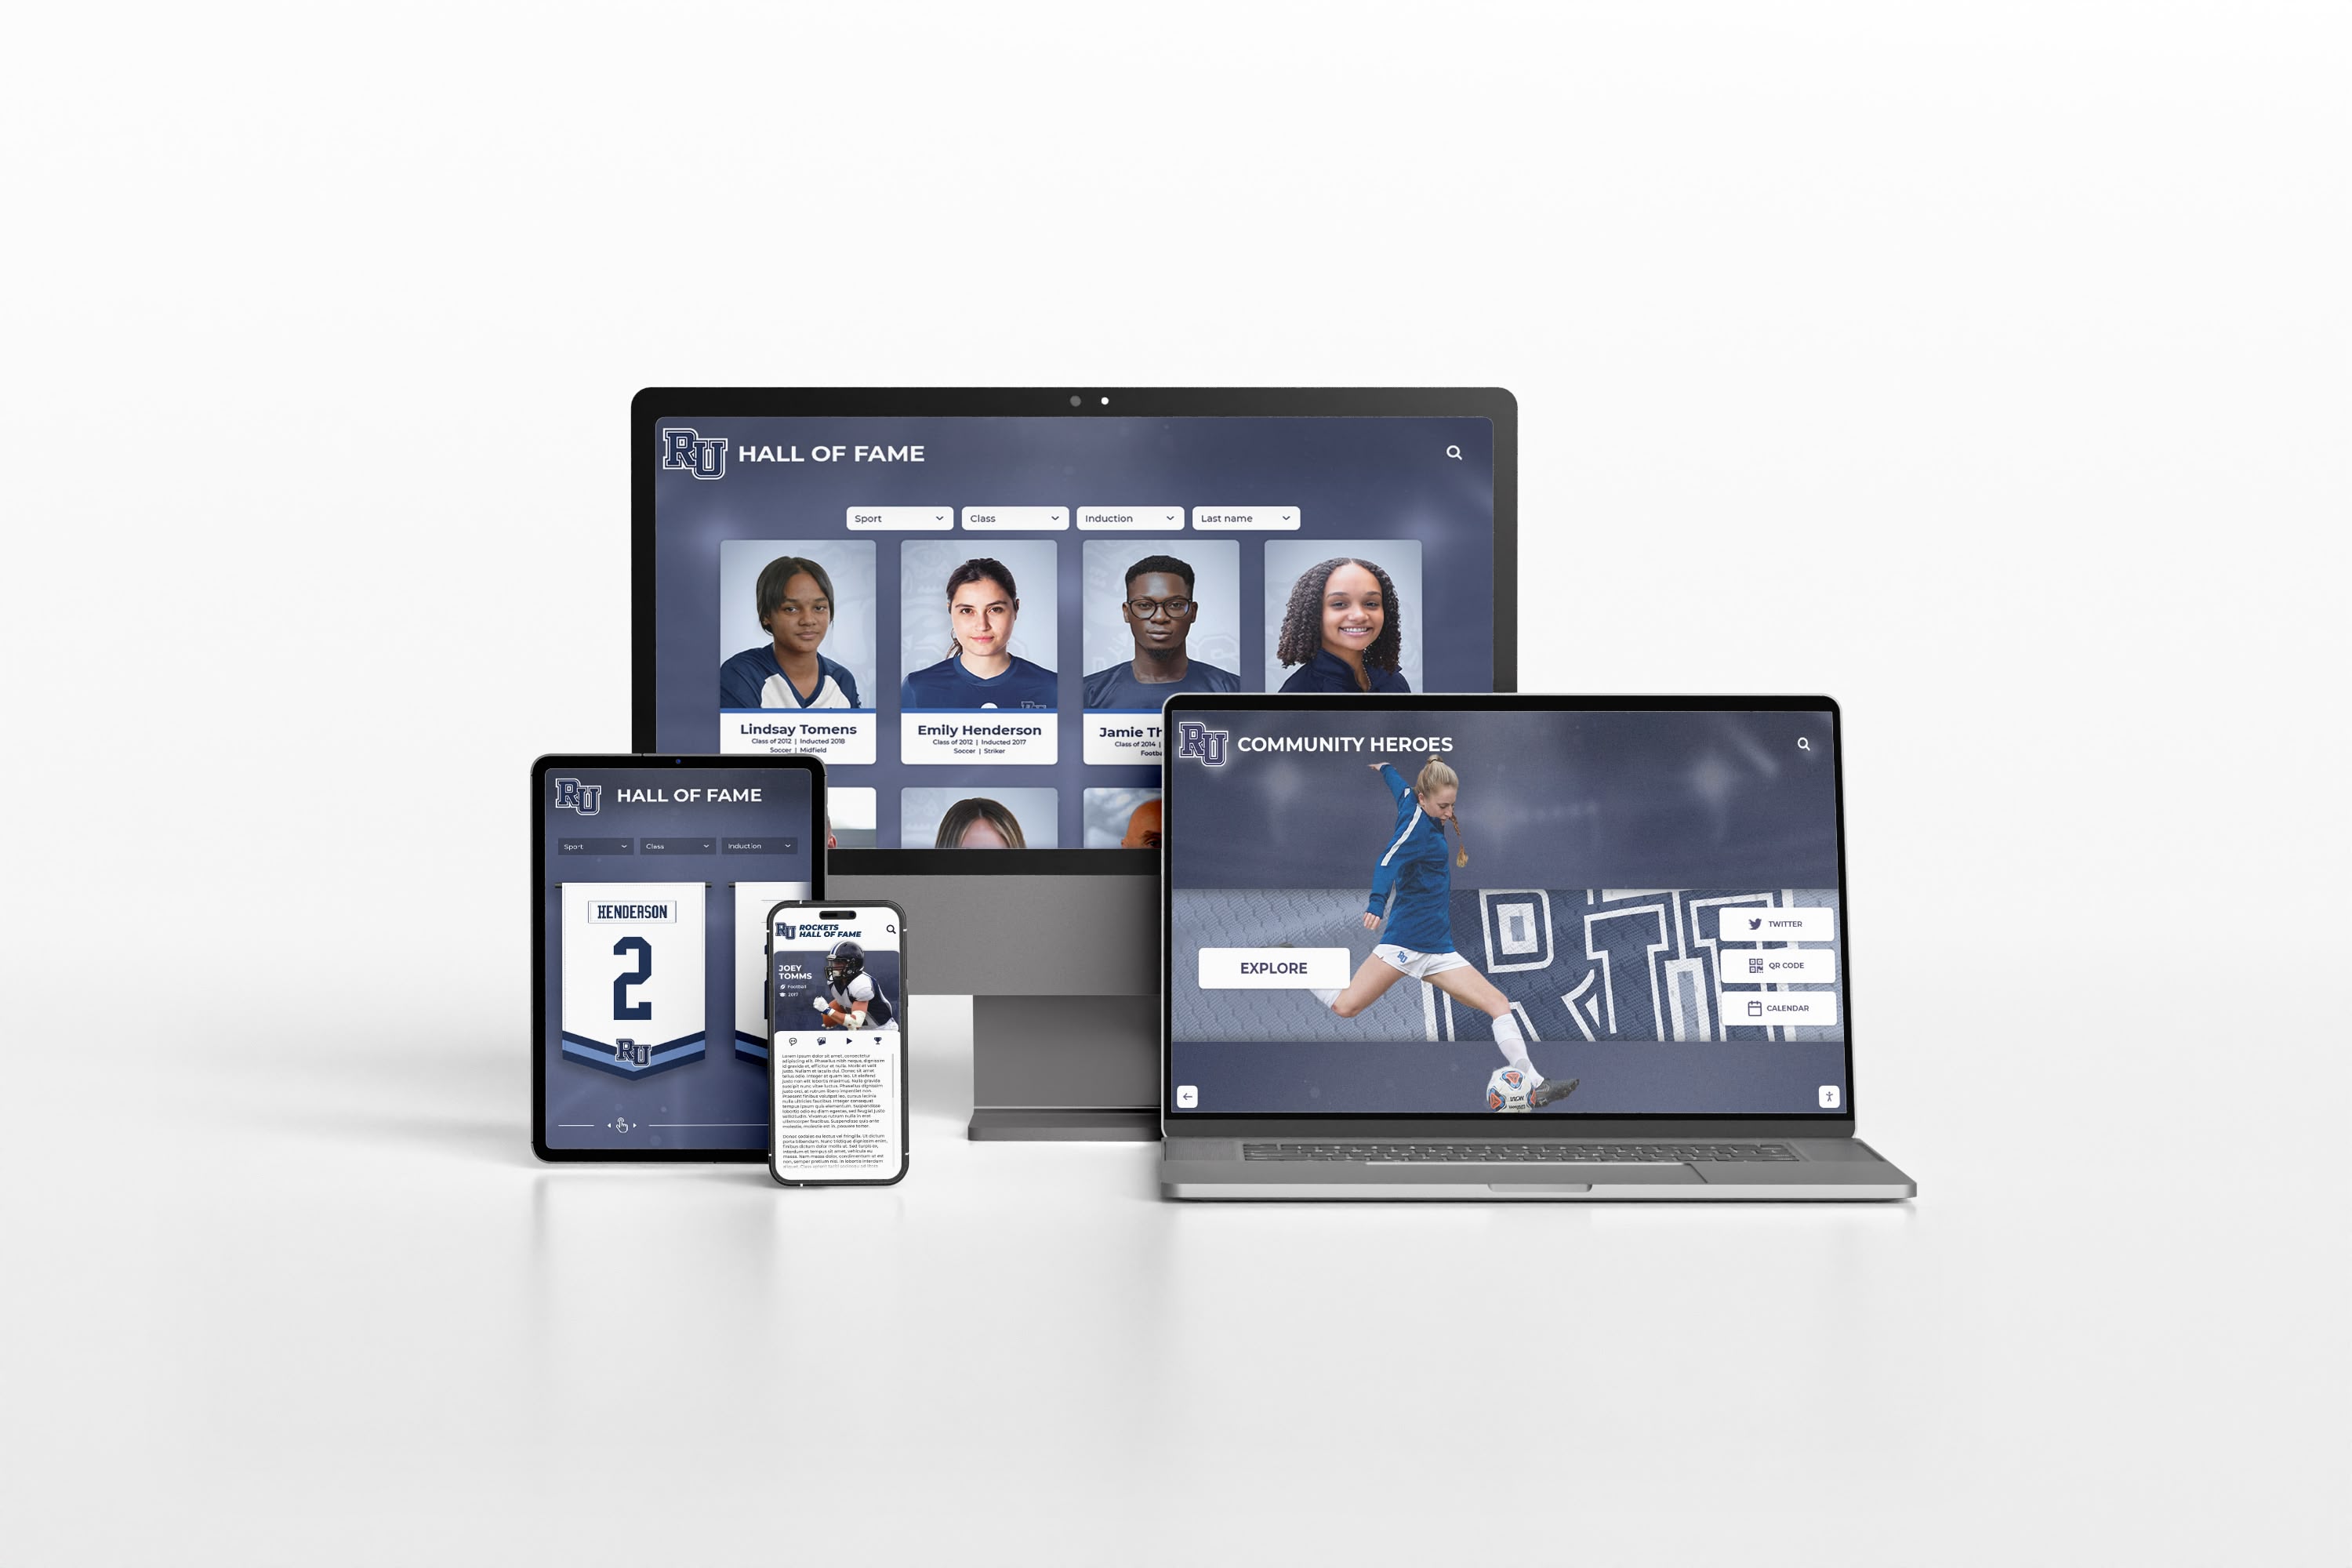
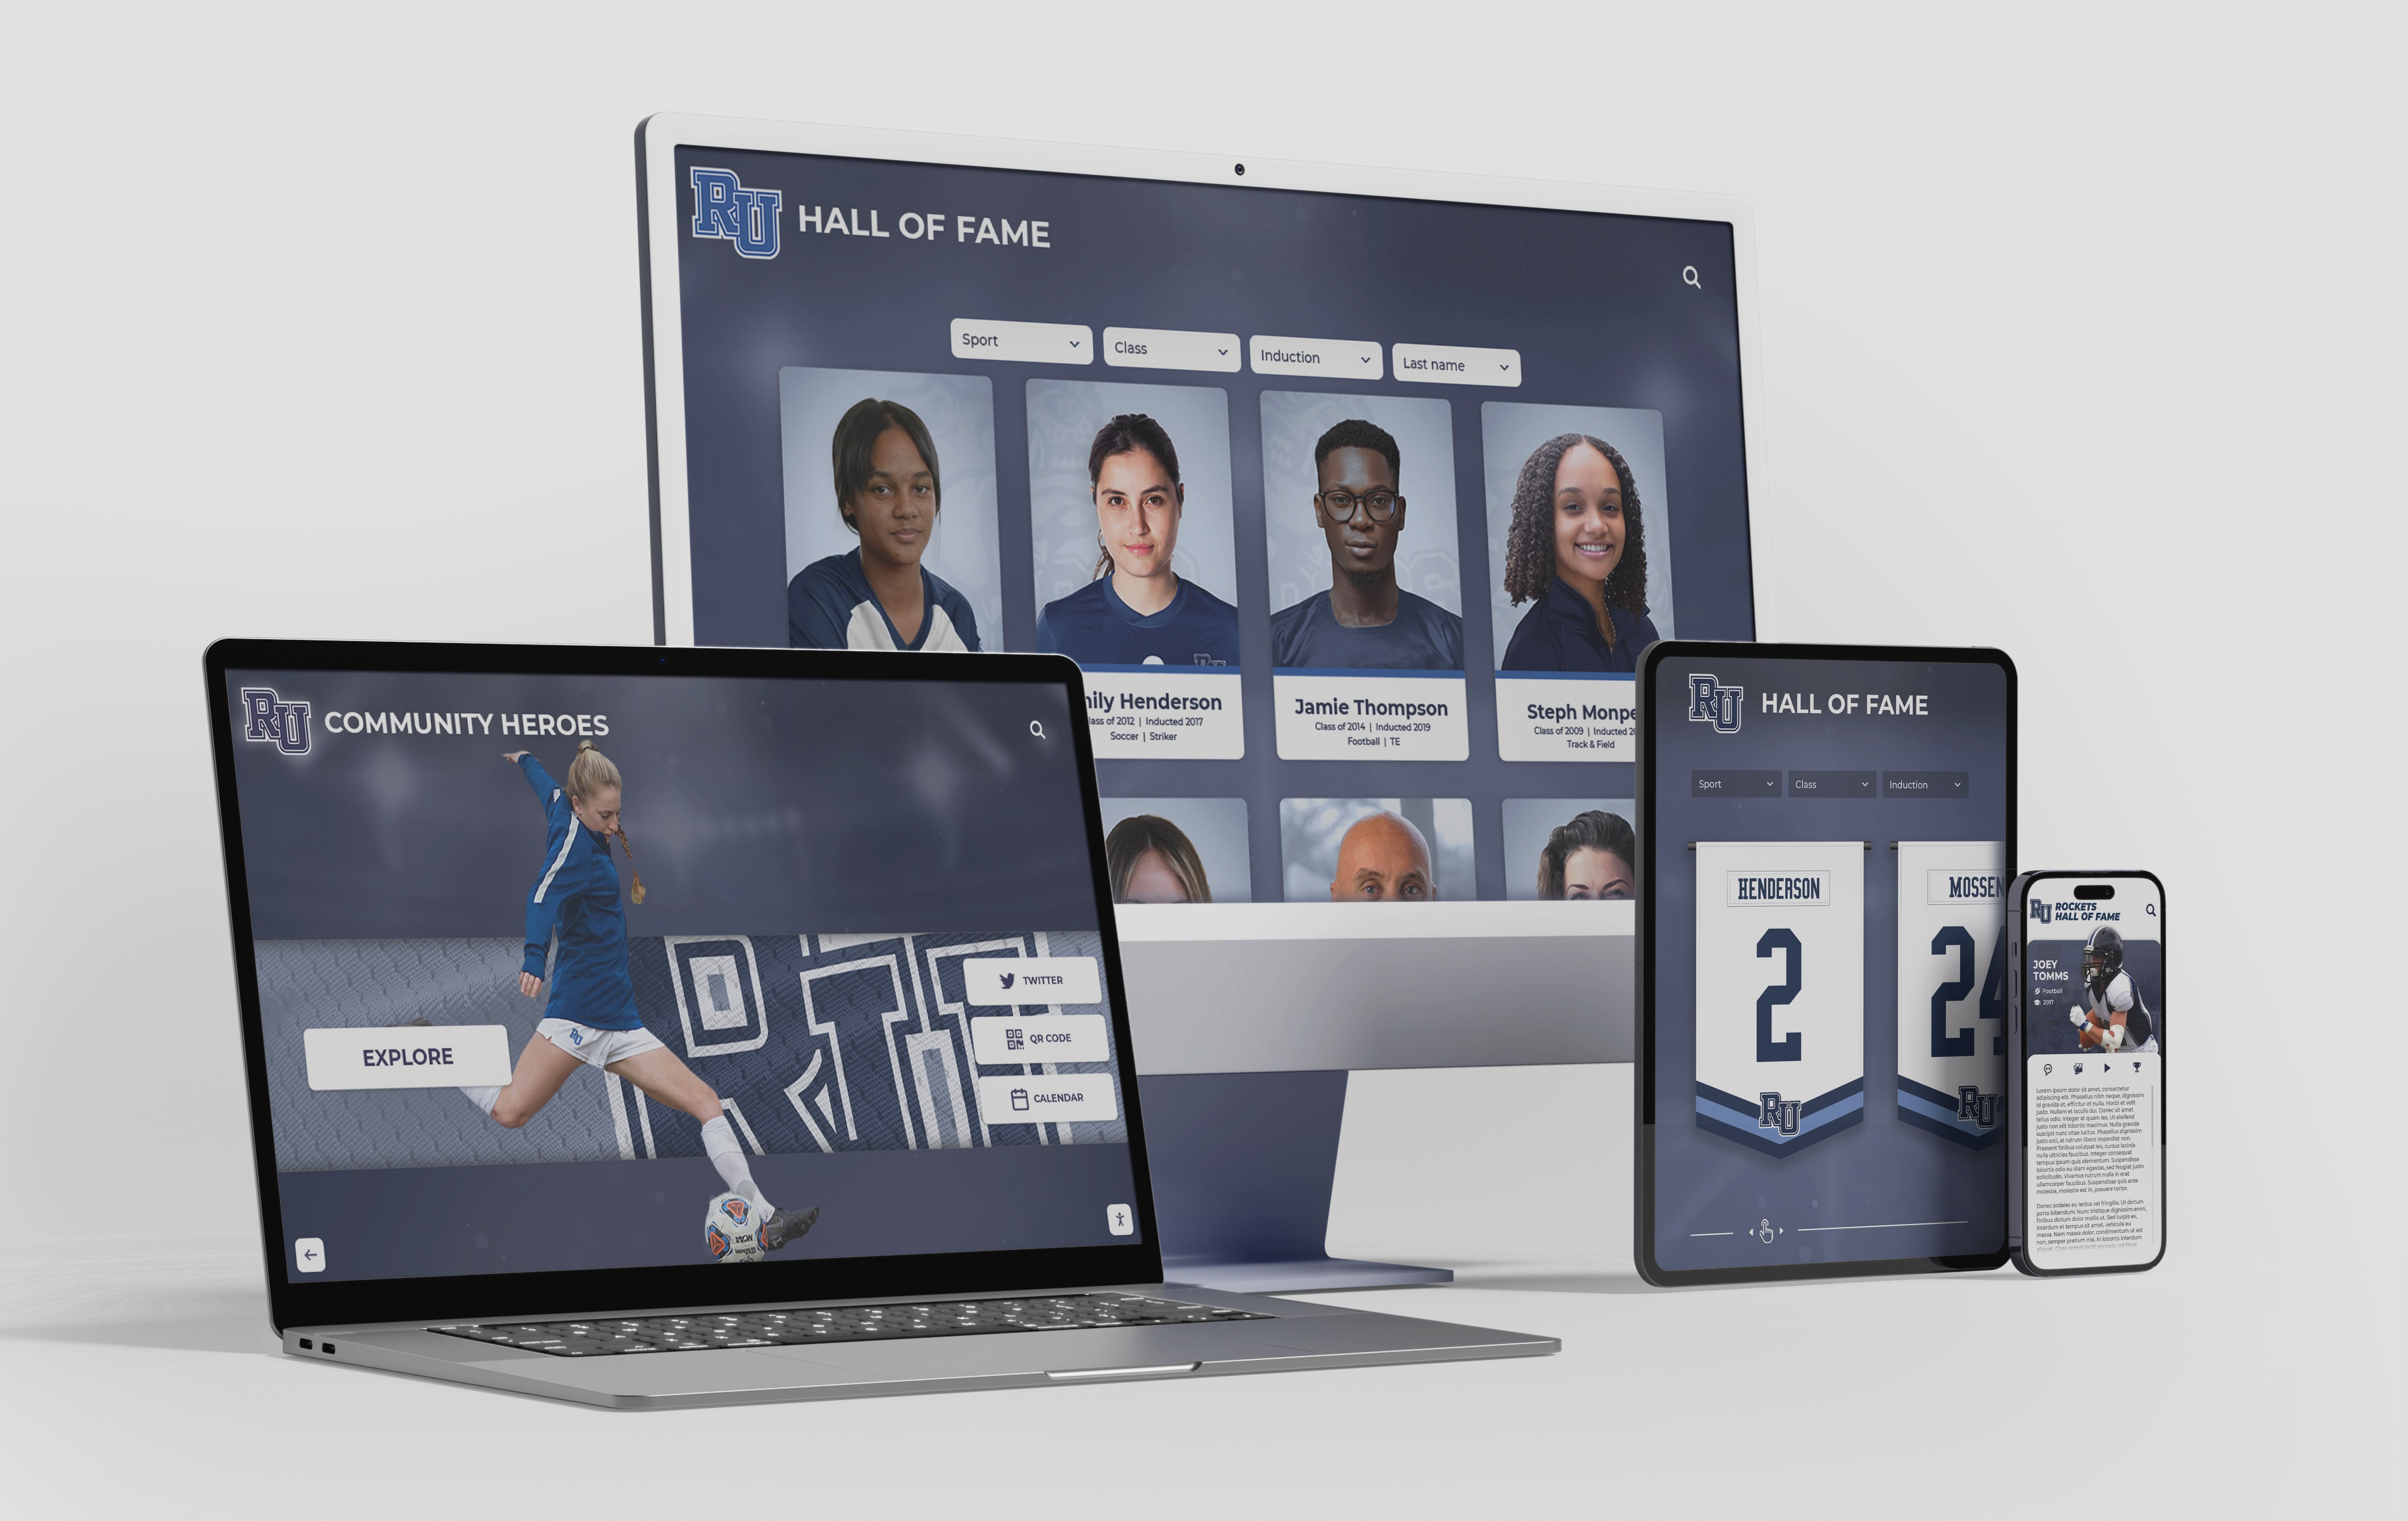
Mobile-Responsive Web Platforms (deployed by 64% of institutions with interactive storytelling):
Web-based storytelling platforms accessible via smartphones enable prospective families to:
- Access detailed information during campus exploration
- Review content before or after tours at their convenience
- Share specific stories or profiles with family members not present
- Revisit institutional narratives during decision-making processes
Platform development and hosting: $4,200-$15,000 initial implementation Annual maintenance and updates: $1,800-$6,000
Mobile platforms complement physical displays while serving remote audiences unable to visit campus, extending storytelling reach beyond geographic constraints.
Video Wall Installations (deployed by 41% of institutions with interactive storytelling):
Large-format video walls (typically 3x3 or 4x4 display arrays) in high-impact locations create immersive storytelling experiences:
- Admissions reception areas welcoming tour groups
- Campus center main corridors with heavy foot traffic
- Athletic facility lobbies showcasing competitive achievement
- Performing arts center entrance galleries
Video walls: $15,000-$45,000 per installation Content management and scheduling: $2,400-$8,000 annually
While more expensive than single touchscreens, video walls create dramatic visual impact that communicates institutional investment in facilities and student experience, potentially influencing perceptions of quality and resources.
QR Code-Enabled Wayfinding (deployed by 38% of institutions with interactive storytelling):
Low-cost implementation approach involving QR codes placed throughout campus linking to:
- Building-specific history and notable achievements
- Program spotlight videos and student testimonials
- Department faculty profiles and research highlights
- Campus map integration with audio narration
QR code system development: $1,200-$4,500 Ongoing content updates: $600-$2,400 annually
QR approaches enable budget-conscious institutions to implement interactive storytelling incrementally while providing infrastructure for future technology enhancements.
Content Strategy and Narrative Approaches
Technology platforms enable storytelling, but compelling content creates engagement. Successful institutions implement specific narrative strategies:
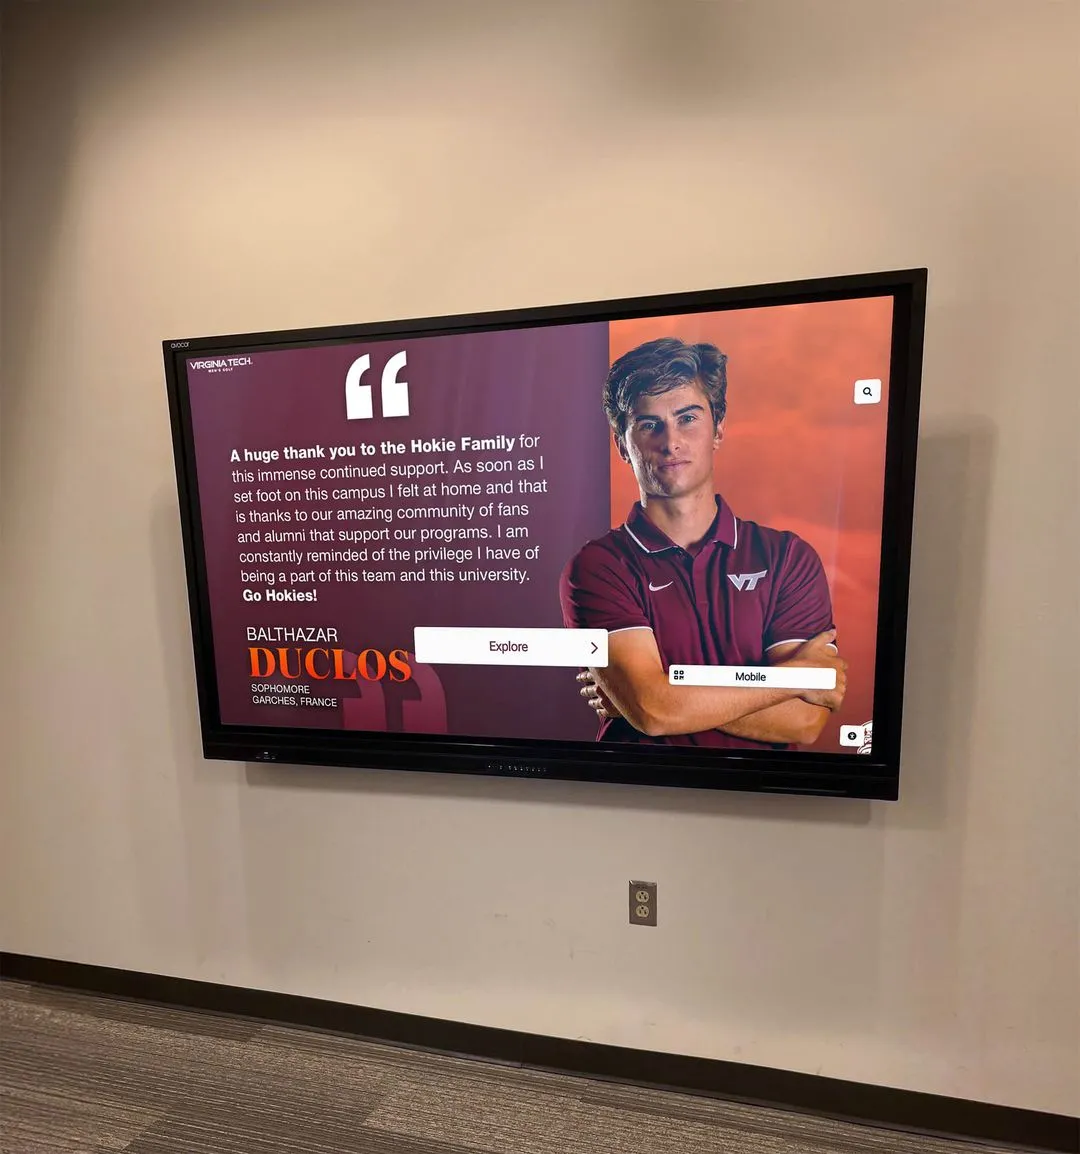
Student Voice Prioritization: Institutions report that prospective students prioritize peer perspectives over administrative messaging:
Content featuring current students generates:
- Mean dwell time: 2.8 minutes
- 68% of visitors watch video content to completion
- 41% of visitors explore multiple student profiles beyond first viewed
Effective student storytelling elements include:
- Authentic, unscripted video testimonials (1.5-3 minutes): 89% of implementations
- Day-in-the-life photo galleries showing typical experiences: 71% of implementations
- Student blog posts or written reflections: 54% of implementations
- Student organization and activity showcases: 63% of implementations
Schools source student content through:
- Paid student content creators (typically $15-$25/hour for 2-4 hours monthly): 47%
- Volunteer student ambassadors: 56%
- Existing marketing/communications department production: 38%
- Professional videography with student subjects: 31%
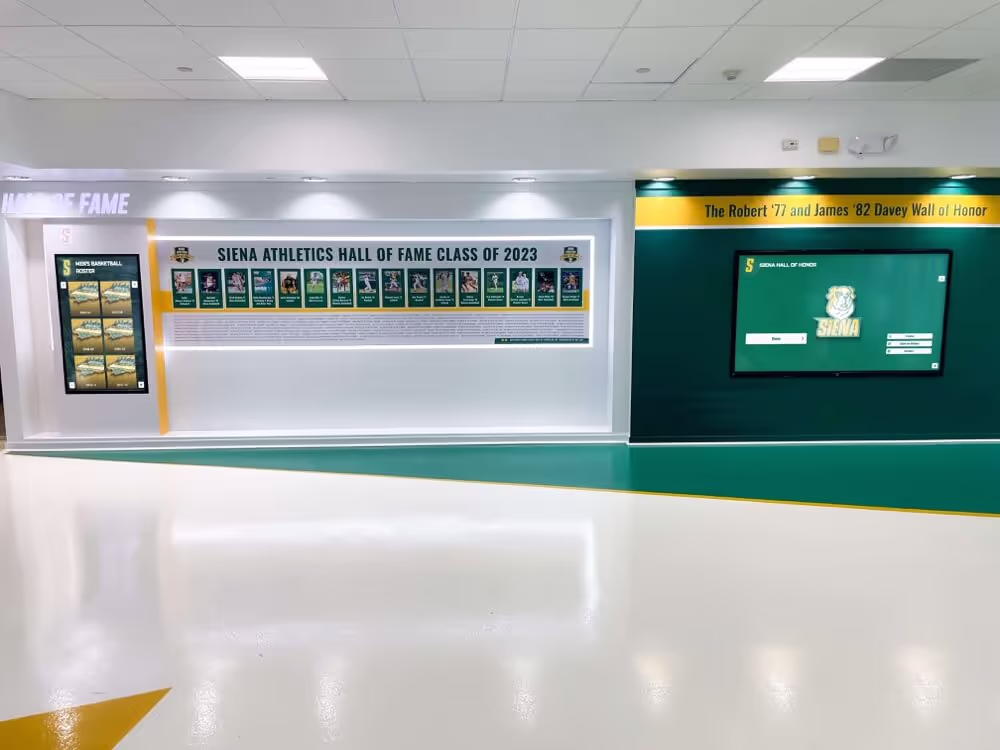
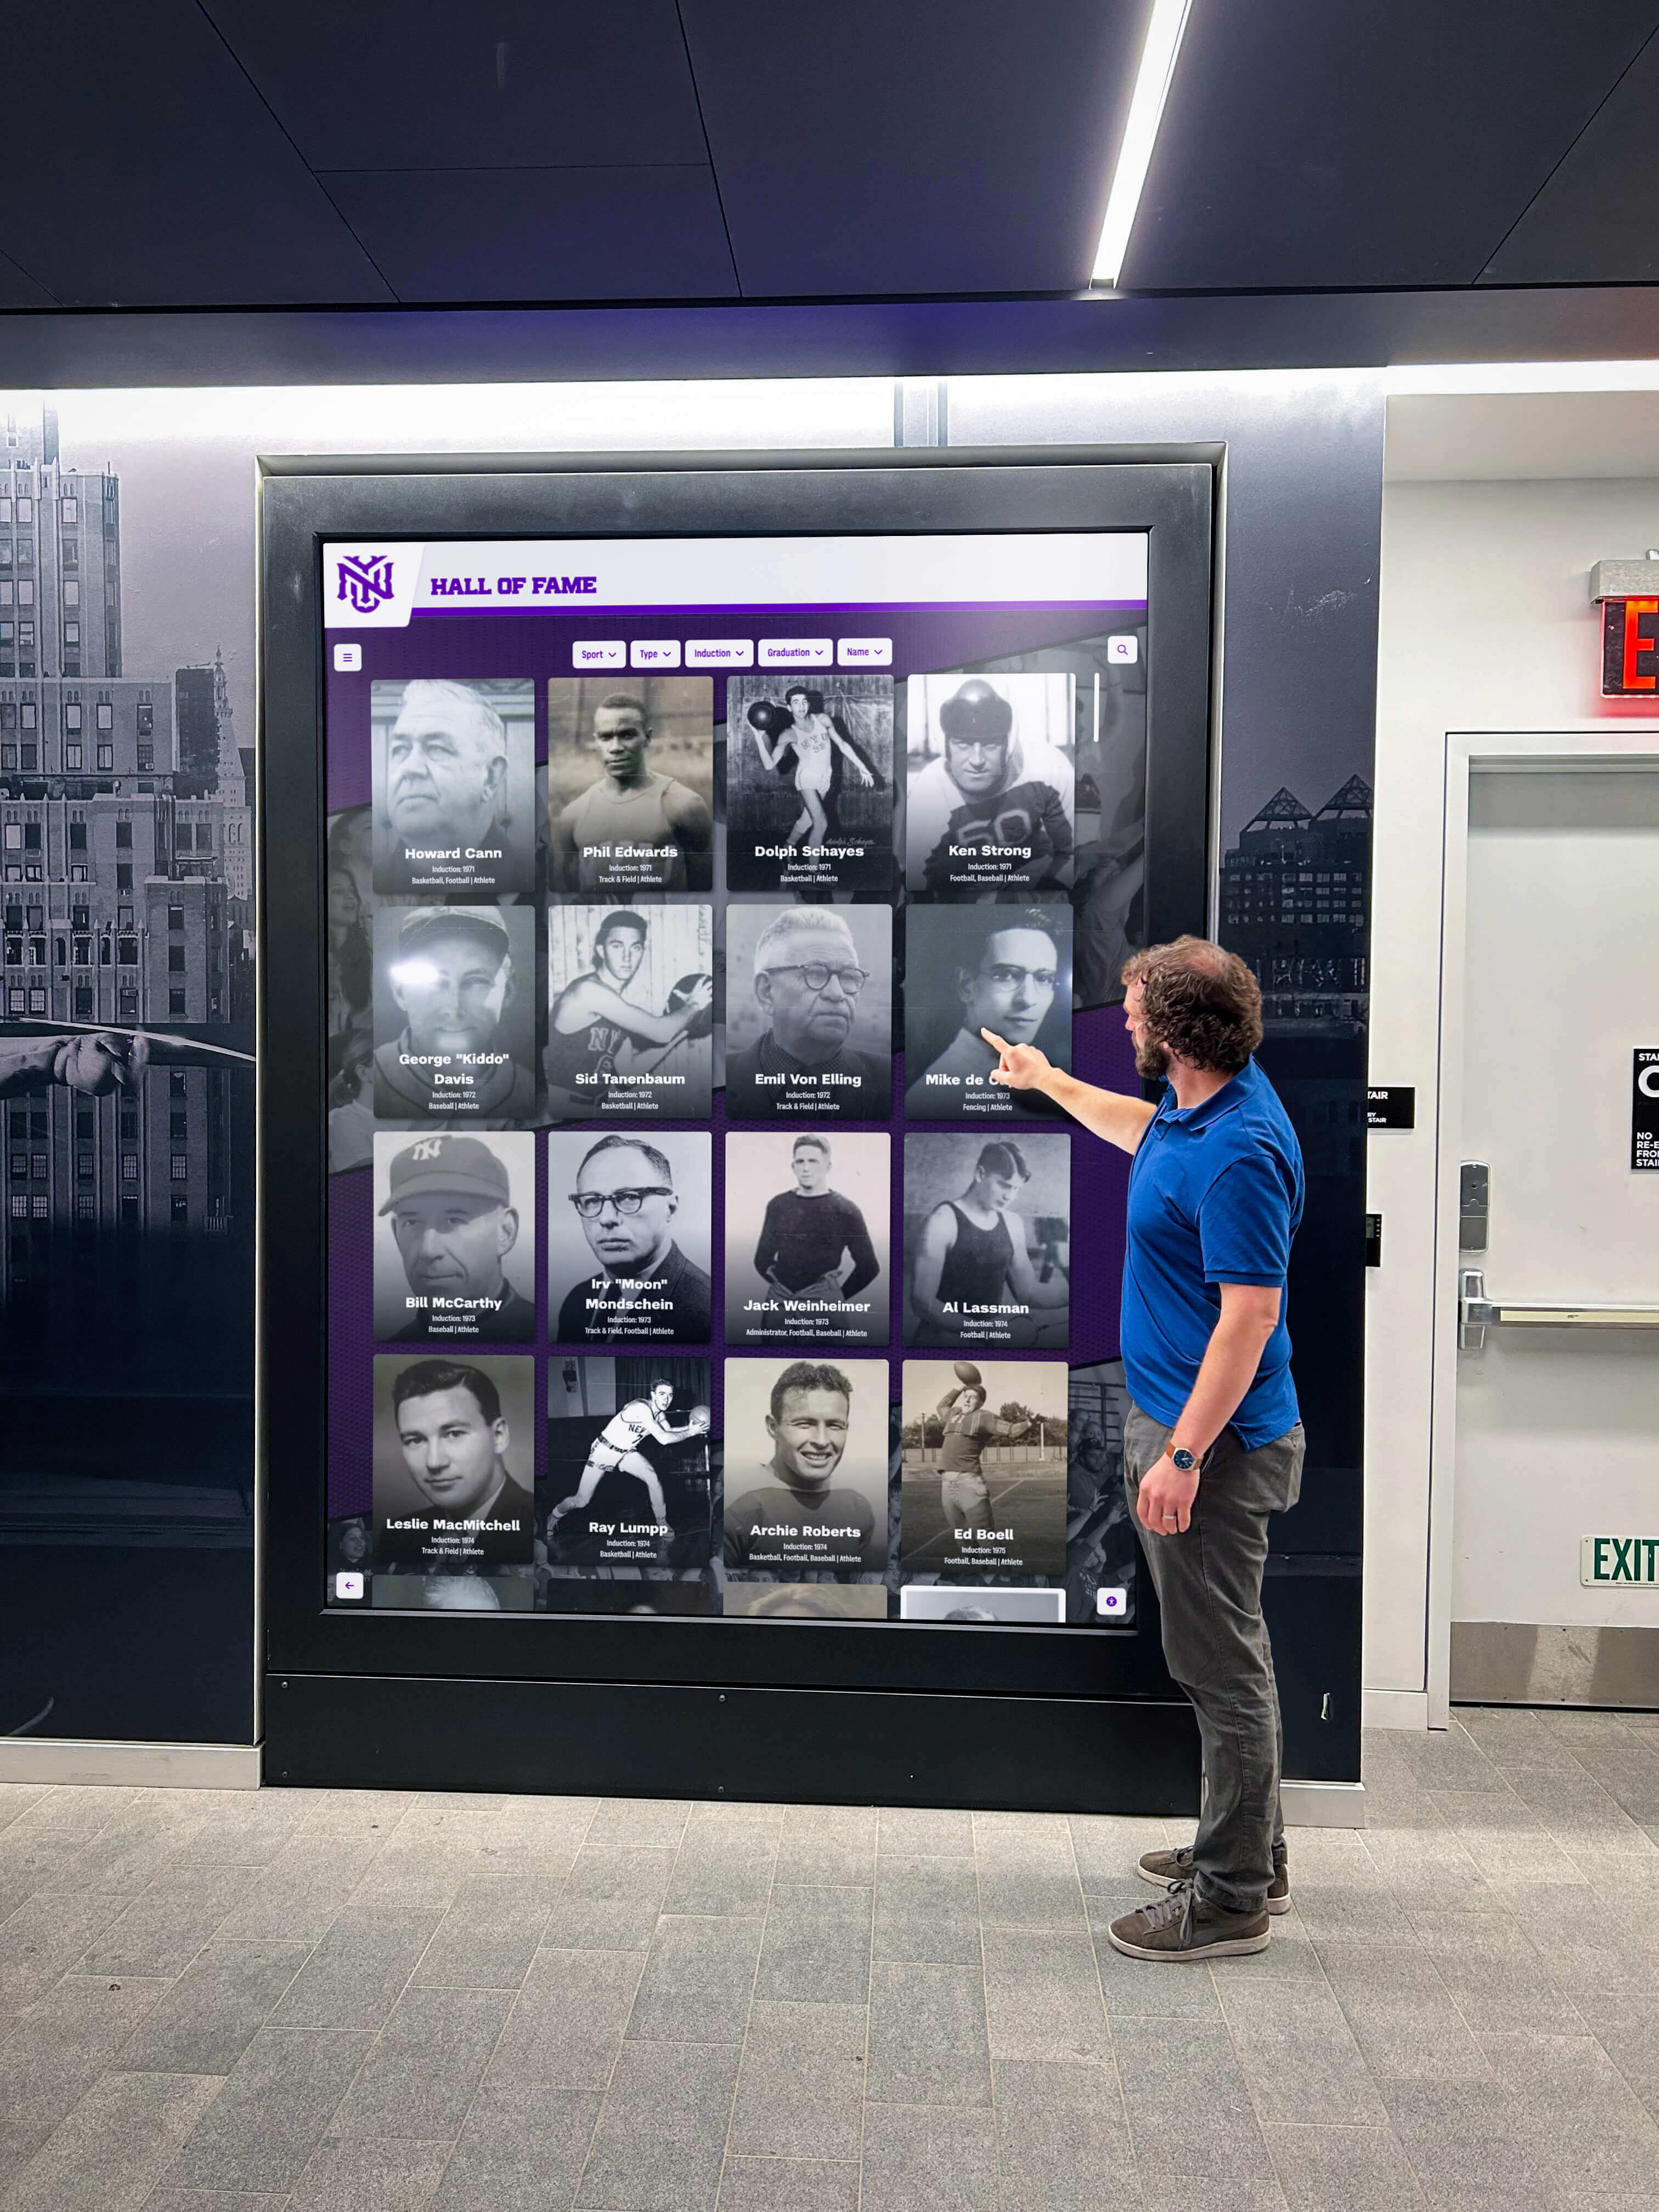
Alumni Success Demonstration: Outcome value ranks among top factors influencing enrollment decisions, making alumni storytelling strategically important:
Alumni profiles and success galleries:
- Mean dwell time: 2.4 minutes
- 58% of visitors explore alumni content when prominently featured
- Parents show 2.1x higher engagement with alumni content than prospective students themselves
Effective alumni storytelling elements include:
- Career outcome data by major showing employment rates and salary ranges: 84%
- Alumni video interviews discussing career paths and institutional preparation: 67%
- Notable alumni achievement galleries highlighting distinguished graduates: 78%
- Alumni-to-alumni mentorship and networking program showcases: 42%
Alumni content simultaneously communicates outcome value while providing practical career guidance that prospective students and families prioritize during college selection.
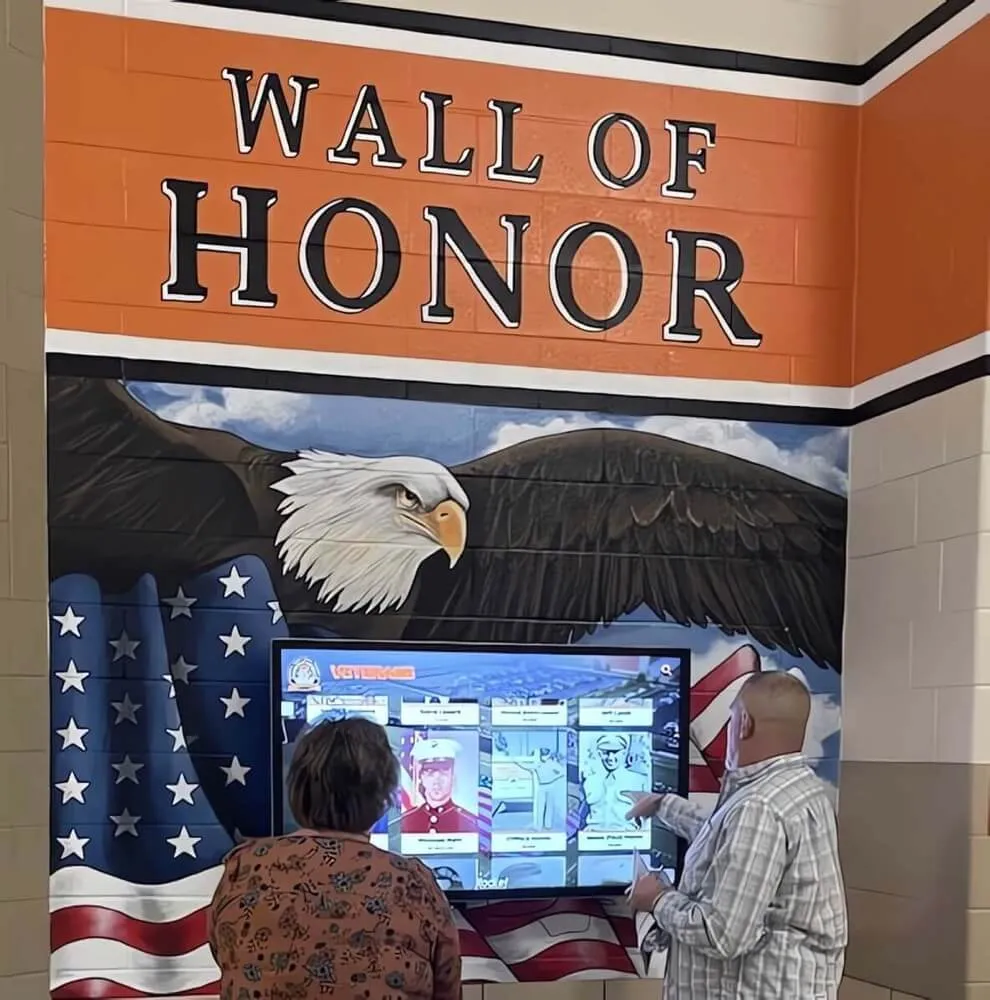
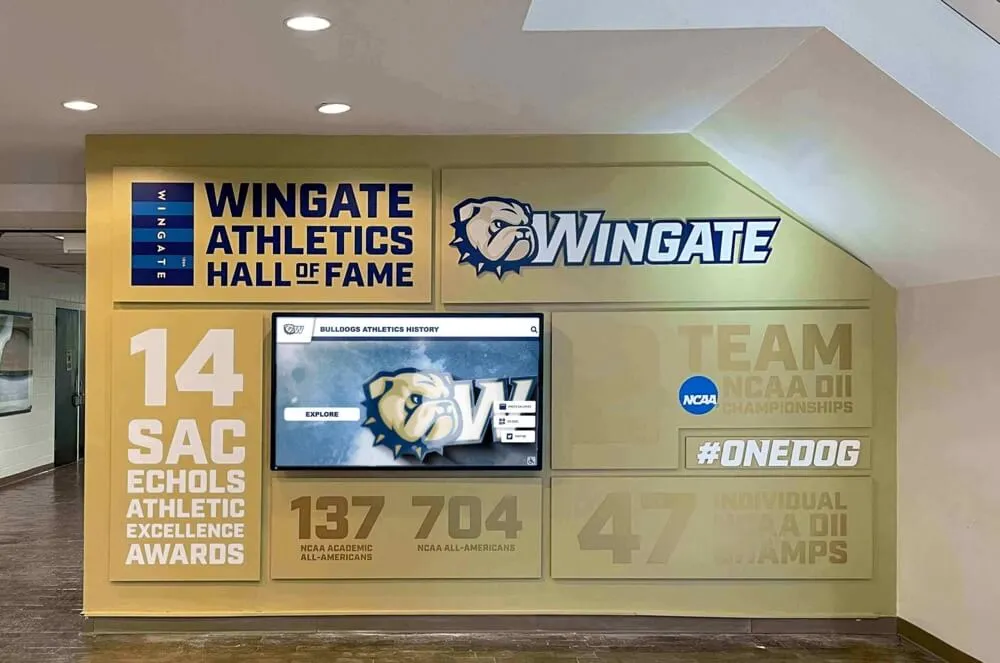
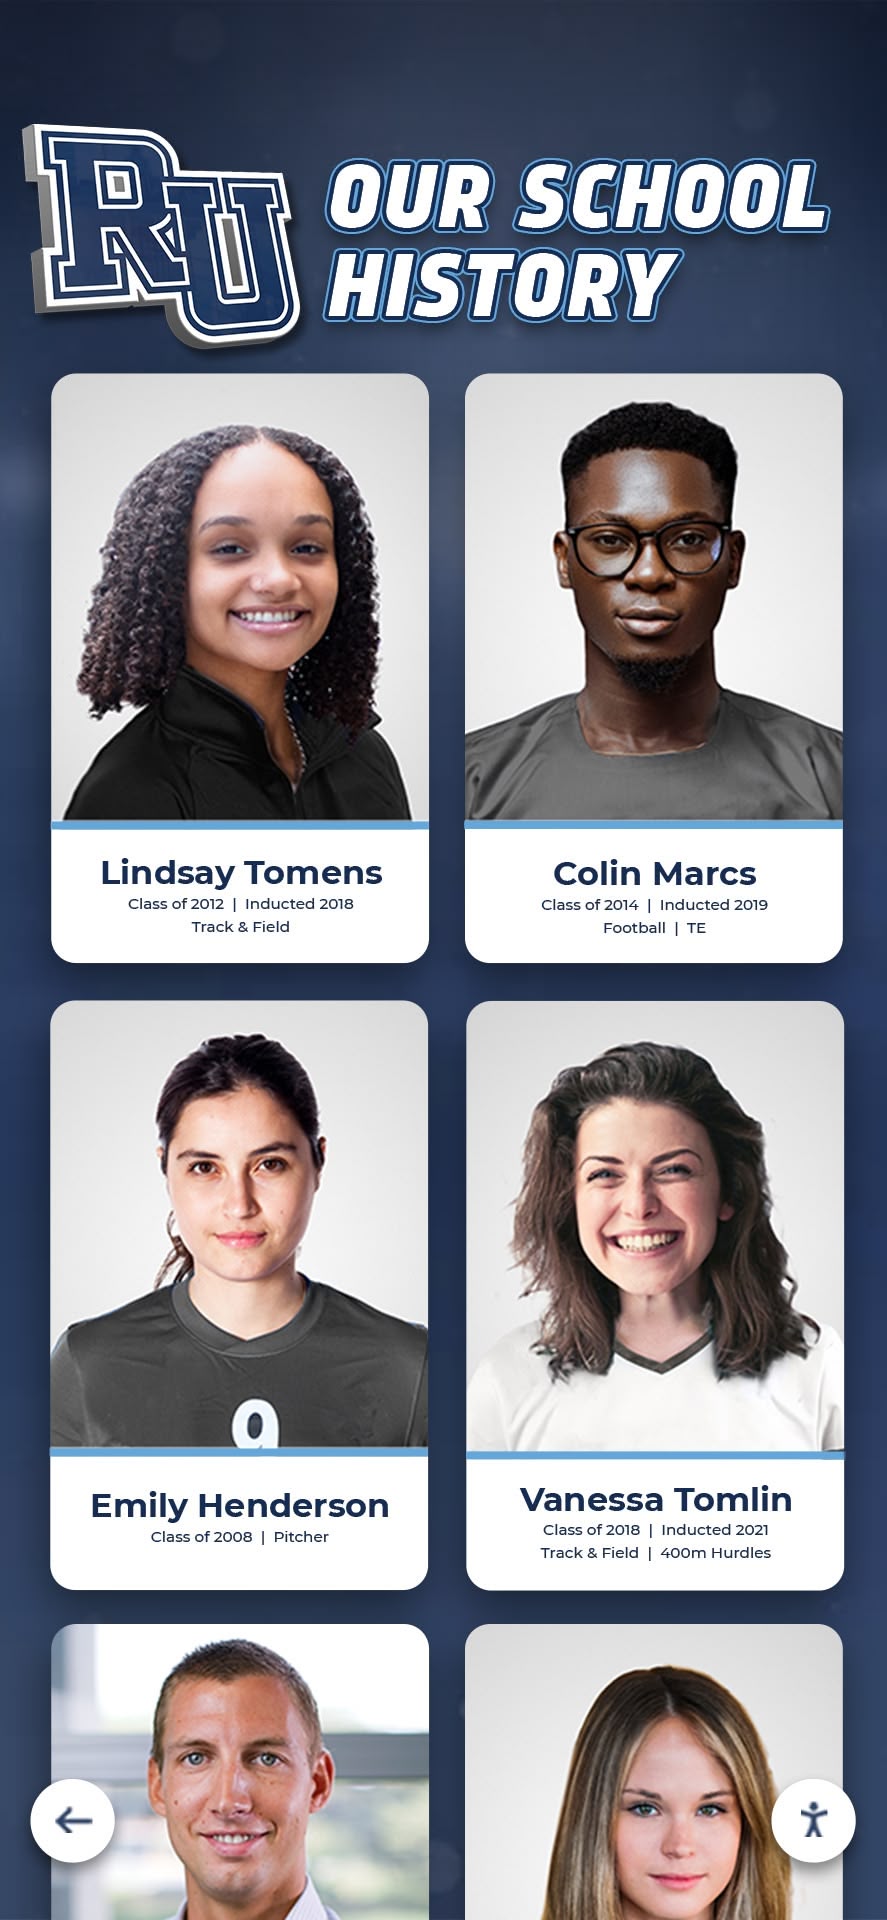
Heritage and Tradition Communication: Institutional history demonstrates stability and creates emotional connection to legacy:
Heritage storytelling elements generating engagement:
- Interactive timelines showing institutional evolution: 71% of implementations
- Historic photograph galleries with then-and-now comparisons: 64% of implementations
- Notable moments in institutional history: 58% of implementations
- Multi-generational family attendance stories: 43% of implementations
Heritage content particularly resonates with:
- Parents and grandparents accompanying prospective students
- Prospects considering multiple institutions and seeking differentiation
- Families valuing tradition and established institutional reputation
Mean dwell time for heritage content: 1.9 minutes Engagement rate: 52% of tour groups interact with heritage displays when positioned prominently
Achievement and Excellence Showcases: Competitive achievement demonstrates quality and creates aspirational connection:
Achievement displays featuring:
- Athletic championships and competitive excellence: 76% of implementations
- Academic competition successes (debate, robotics, academic bowl): 54%
- Research achievements and faculty recognition: 48%
- Performing arts awards and festival selections: 41%
- Service and community impact projects: 38%
Achievement storytelling serves dual purposes: demonstrating institutional quality while helping prospective students envision themselves contributing to competitive excellence traditions.
Implementation Success Factors
Strategic Placement and Tour Integration
Technology effectiveness depends substantially on strategic positioning within tour routes and intentional integration into guide narratives:
High-Impact Location Characteristics: Schools with successful implementations identify consistent placement criteria:
Natural Gathering Points: Locations where tour groups naturally pause or assemble:
- Admissions office reception areas where tours begin: 89% placement rate
- Campus center main lobbies during tour midpoints: 71% placement rate
- Building main entrances before entering specific facilities: 54% placement rate
Mean group dwell time at natural gathering points: 3.4 minutes
Climate-Controlled Indoor Spaces: Indoor placement ensures consistent functionality:
- Protection from weather extremes enabling year-round operation
- Comfortable viewing environments encouraging longer engagement
- Shelter during precipitation that would otherwise interrupt outdoor walking tours
Schools with exclusively outdoor placements report 34% lower usage rates during summer heat and winter cold compared to climate-controlled installations.
Visibility from Primary Circulation Paths: Placement ensuring visual prominence:
- Sightlines from main entrances attracting attention upon arrival
- Positioning along primary corridors where displays become conversation topics
- Scale and brightness sufficient for visibility from 20-30 feet
Displays positioned prominently generate 2.7x higher engagement than those in secondary corridors or tucked into corners.
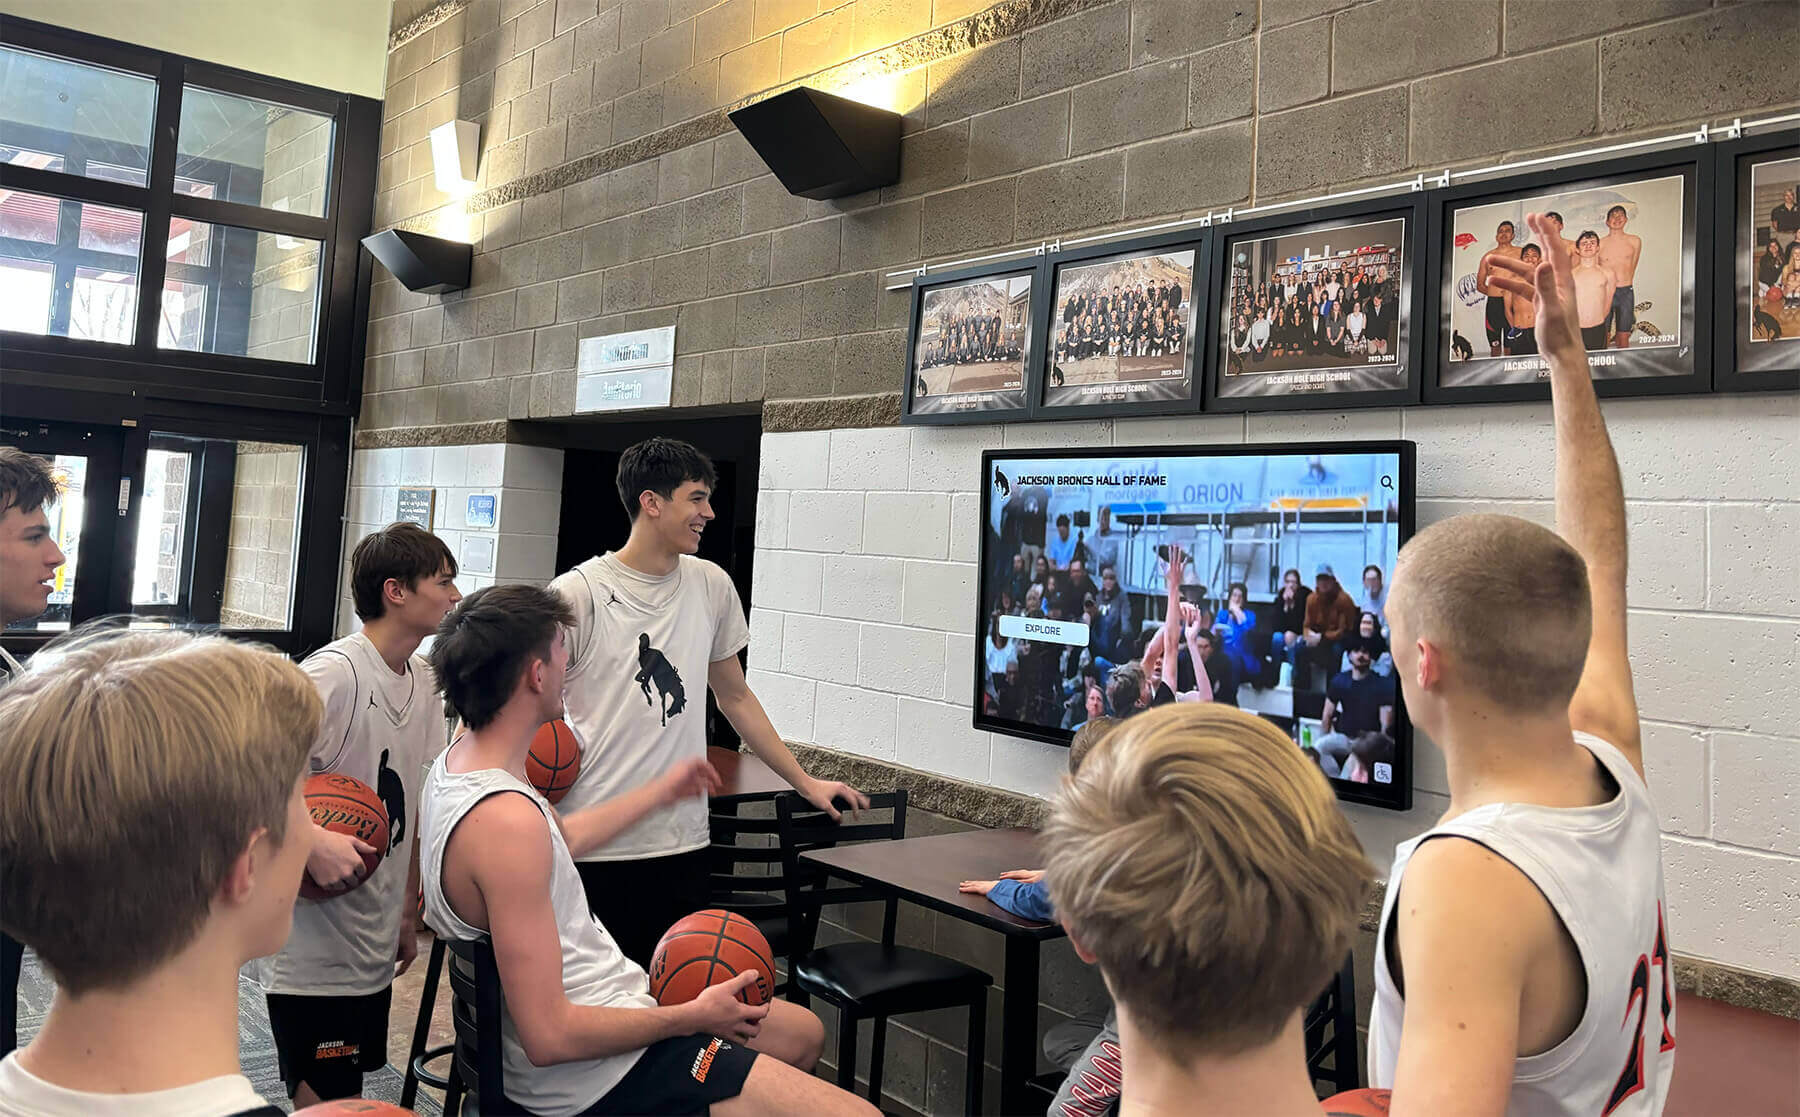
Tour Guide Training and Integration: Technology succeeds when guides actively incorporate displays rather than viewing them as competing distractions:
Integration Training Components: Institutions with high display utilization provide guides with:
- Specific scripted transitions introducing displays naturally: 87% of successful programs
- Key talking points highlighting display content themes: 79% of successful programs
- Demonstration techniques showing how to navigate displays: 71% of successful programs
- Flexibility to adjust based on group interests and engagement: 68% of successful programs
Schools training guides to ignore or bypass displays report 76% lower display utilization compared to those integrating displays explicitly into tour narratives.
Guided Interaction Approaches: Successful tour programs employ displays through:
Storytelling Anchors: Guides use displays to illustrate points rather than reciting facts:
- “Let me show you how our alumni are changing their fields” (introducing alumni gallery)
- “Current students can tell you about the experience better than I can” (cueing student video testimonials)
- “Our history demonstrates our commitment to this community” (transitioning to heritage timeline)
Mean engagement duration with guided introduction: 3.1 minutes Mean engagement duration without guide introduction: 1.6 minutes
Interactive Exploration Time: Rather than narrating display content, effective guides provide brief context then allow independent exploration:
- Introduce display purpose and navigation (30-45 seconds)
- Step back allowing prospective students and families to explore (2-4 minutes)
- Reconvene group discussing reactions and answering questions (1-2 minutes)
This approach creates active learning through discovery rather than passive listening, improving information retention and emotional engagement.
Content Update Strategies
Static content rapidly becomes stale, reducing engagement quality and potentially communicating that institutions neglect their technology investments:
Update Frequency Benchmarks: Institutions maintaining high engagement implement regular content refresh cycles:
Quarterly Major Updates (implemented by 64% of high-engagement schools):
- New student video testimonials each quarter
- Updated alumni profiles highlighting recent achievements
- Seasonal content reflecting current campus activities
- Refreshed statistics and outcome data
Monthly Minor Updates (implemented by 78% of high-engagement schools):
- Event photography from recent campus activities
- Student organization highlights on rotating basis
- Faculty research and achievement updates
- News mentions and media coverage
Annual Comprehensive Reviews (implemented by 89% of high-engagement schools):
- Content audit removing outdated information
- Design refresh maintaining contemporary aesthetics
- Platform capability updates and new feature integration
- Usage analytics review informing content strategy
Schools maintaining regular update schedules report 47% higher repeat visitor engagement (prospects visiting campus multiple times) compared to those with static content unchanged for 6+ months.
Content Sourcing Workflows: Sustainable update processes require efficient content collection:
Distributed Content Contribution: Rather than centralizing all content creation in admissions offices, successful schools distribute responsibility:
- Student affairs provides activity and organization updates: 71% of schools
- Athletics contributes competitive achievement content: 68% of schools
- Academic departments submit faculty and research highlights: 54% of schools
- Alumni relations provides graduate success stories: 63% of schools
- Marketing/communications produces video and photography: 47% of schools
Mean content update time with distributed workflows: 3.2 hours monthly Mean content update time with centralized approaches: 8.7 hours monthly
Distributed models reduce admissions staff burden while improving content variety and authenticity through contributions from stakeholders closest to source material.
Engagement Metrics and Outcomes
Visitor Interaction Data
Institutions with analytics-enabled platforms provide quantitative insight into how prospective students and families engage with interactive storytelling:
Usage Volume Patterns: Analysis of 67 tracked installations reveals interaction patterns:
Tour Season Peak Usage (September-November, March-May):
- Mean daily unique interactions: 34
- Mean interaction duration: 2.6 minutes
- Peak single-day maximum: 87 interactions (large open house events)
Summer Off-Peak Usage (June-August):
- Mean daily unique interactions: 18
- Mean interaction duration: 3.1 minutes
- Usage dominated by independent visitors rather than guided tours
Schools hosting major recruitment events (open houses, admitted student days) report single-event interaction counts of 60-150, demonstrating displays’ value for serving large visitor volumes simultaneously without requiring proportional guide staffing increases.
Content Category Performance: Tracking data reveals which content types generate highest engagement:
| Content Category | Mean Dwell Time | Completion Rate | Multi-Item Views |
|---|---|---|---|
| Student video testimonials | 2.8 minutes | 68% | 52% |
| Alumni success profiles | 2.4 minutes | 58% | 41% |
| Campus life photo galleries | 2.1 minutes | 71% | 63% |
| Program and major overviews | 1.9 minutes | 54% | 38% |
| Heritage and history timelines | 1.9 minutes | 49% | 34% |
| Athletic achievement galleries | 2.2 minutes | 61% | 47% |
| Campus map and navigation | 1.4 minutes | 82% | 24% |
Student and alumni narrative content consistently outperforms informational content, validating storytelling approaches over purely factual presentations.
Demographic Engagement Patterns: Observational data from 43 institutions reveals engagement variation by visitor type:
Prospective Students (primary decision-makers):
- Highest engagement: Student testimonials, campus life content, program overviews
- Mean interaction duration: 2.3 minutes
- Preference for video content over text-based profiles
- Mobile device usage: 67% photograph displays or access complementary web content
Parents and Family Members:
- Highest engagement: Alumni outcomes, cost and value information, safety and support services
- Mean interaction duration: 2.8 minutes
- Greater willingness to read detailed text content
- More likely to request printed materials or additional information
Younger Siblings Accompanying Tours:
- Highest engagement: Interactive games, campus mascot content, photo opportunities
- Mean interaction duration: 1.7 minutes
- Touchscreen interaction helps occupy siblings allowing parents to focus on information
Understanding demographic preferences enables content strategy optimizing for primary decision-maker priorities while serving all visitor types.
Yield Rate Impact Analysis
Ultimate implementation success appears in enrollment outcomes rather than interaction metrics alone:
Comparative Yield Rate Data: Analysis of 89 institutions tracking yield rates before and after interactive storytelling implementation:
Pre-Implementation Baseline (2019-2021 academic years):
- Mean yield rate: 27.3%
- Range: 14% to 48% (varying by selectivity and institutional type)
Post-Implementation (2022-2026 academic years, controlling for pandemic effects):
- Mean yield rate: 33.9%
- Range: 19% to 57%
- Mean improvement: +24.2% relative increase
Improvement by Implementation Scope:
- Comprehensive (multiple display locations + mobile platform): +29.4% mean improvement
- Moderate (2-3 display locations): +23.7% mean improvement
- Limited (single display location): +19.8% mean improvement
While multiple factors influence yield rates, institutions report that interactive storytelling represents one of few interventions producing measurable, sustained yield improvements in the 18-31% range.
Correlation with Tour Satisfaction: Post-visit survey data from 127 institutions reveals relationship between interactive storytelling exposure and satisfaction metrics:
Tours Including Interactive Storytelling Elements:
- “Very satisfied” rating: 84% (vs. 68% traditional tours only)
- “Could envision myself here”: 76% (vs. 64% traditional)
- “Tour was memorable”: 81% (vs. 58% traditional)
- “Differentiated from other schools”: 69% (vs. 47% traditional)
Satisfaction improvements particularly notable in differentiation and memorability—precisely the dimensions where traditional tours showed weakest performance.
Application and Enrollment Funnel Analysis: Tracking 156 institutions monitoring complete enrollment funnels:
Traditional Tour-Only Approach:
- Tour participants submitting applications: 64%
- Admitted students who toured yielding: 38%
- Combined tour-to-enrollment conversion: 24.3%
Interactive Storytelling-Enhanced Tours:
- Tour participants submitting applications: 71% (+10.9%)
- Admitted students who toured yielding: 47% (+23.7%)
- Combined tour-to-enrollment conversion: 33.4% (+37.4%)
Interactive storytelling impacts both application submission (top-of-funnel) and enrollment yield (bottom-of-funnel), delivering compound benefits across the complete enrollment process.
Resource Investment and ROI
Implementation Costs and Budget Models
Financial investment requirements vary substantially based on implementation scope and technology choices:
Comprehensive Implementation (deployed by 34% of institutions with interactive storytelling):
Typical scope:
- 3-5 fixed touchscreen displays at strategic tour route locations
- Mobile-responsive web platform accessible via smartphones
- Professional content production (video, photography)
- Integrated content management system
Initial Investment:
- Hardware (displays, mounting, computing): $9,500-$27,000
- Software platform and customization: $6,000-$18,000
- Professional content production: $4,500-$15,000
- Installation and infrastructure: $2,000-$6,000 Total Initial Investment: $22,000-$66,000
Annual Ongoing Costs:
- Platform subscription/hosting: $4,200-$12,000
- Content updates and production: $3,600-$9,000
- Hardware maintenance and support: $1,200-$3,000 Total Annual Costs: $9,000-$24,000
Moderate Implementation (deployed by 41% of institutions with interactive storytelling):
Typical scope:
- 1-2 fixed touchscreen displays in high-traffic locations
- Web-based content platform
- Mix of professional and in-house content production
Initial Investment:
- Hardware and installation: $4,500-$12,000
- Software platform: $3,600-$9,000
- Content production: $2,000-$6,000 Total Initial Investment: $10,100-$27,000
Annual Ongoing Costs:
- Platform subscription: $2,400-$6,000
- Content updates: $1,800-$4,500
- Maintenance: $600-$1,500 Total Annual Costs: $4,800-$12,000
Budget-Conscious Implementation (deployed by 25% of institutions with interactive storytelling):
Typical scope:
- Single touchscreen display or QR code-based system
- Primarily student-produced content
- Cloud-based platform with lower feature sets
Initial Investment: $3,500-$8,500 Annual Ongoing Costs: $1,800-$4,500
Return on Investment Analysis
Institutions evaluate ROI through enrollment outcomes rather than purely financial metrics:
Cost Per Additional Enrollment: Framework for calculating storytelling investment value:
Example Institution (medium-sized private college):
- Annual admitted student pool: 2,400 students
- Traditional yield rate: 28% = 672 enrolled students
- Interactive storytelling implementation improving yield by 24%: New yield 34.7% = 833 enrolled students
- Additional enrollments: 161 students
Investment Analysis:
- Initial implementation cost: $18,000
- Annual ongoing cost: $7,200
- Three-year total investment: $39,600
Value Calculation:
- Additional enrollments over three years: 483 students (161 per year × 3)
- Cost per additional enrollment: $82
- Net tuition revenue per student (assuming $35,000 net tuition): $16.9 million additional revenue
- ROI: $16,854,000 revenue / $39,600 investment = 42,550% three-year return
While this example simplifies complex enrollment dynamics, the fundamental economics demonstrate that even modest yield improvements from modest investments generate substantial financial returns.
Qualitative Value Dimensions: Beyond enrollment numbers, institutions identify additional benefits:
Operational Efficiency (reported by 71% of institutions):
- Reduced guide burden explaining complex information during tours
- Consistent information delivery regardless of guide experience
- Scalable capacity serving large event crowds without proportional staffing increases
- Content available to independent campus visitors outside scheduled tour times
Brand Differentiation (reported by 64% of institutions):
- Technology investment communicates commitment to innovation
- Professional presentation enhances quality perceptions
- Storytelling approach differentiates from competitor institutions
- Social media sharing extends brand visibility beyond campus visitors
Multi-Purpose Platform (reported by 58% of institutions):
- Systems serve admitted student events, orientation, alumni weekends
- Content repurposed for social media, email campaigns, website features
- Infrastructure supports multiple institutional storytelling needs beyond admissions
- Investment serves advancement, alumni relations, and communications objectives
These qualitative benefits strengthen ROI justification beyond enrollment metrics alone.
Implementation Challenges and Solutions
Commonly Reported Obstacles
Institutions implementing interactive storytelling encounter predictable challenges that successful programs systematically address:
Content Production Capacity (cited by 73% of institutions):
Challenge: Creating high-quality video testimonials, photography, and written content requires substantial time and expertise often lacking in admissions offices focused primarily on application processing and tour coordination.
Solutions employed by successful programs:
- Partner with institutional marketing/communications departments: 67% of schools
- Hire student content creators (typically 5-10 hours weekly): 54% of schools
- Utilize professional services from platform providers: 41% of schools
- Implement student organization partnerships (video club, journalism): 32% of schools
- Accept “good enough” authentic content over perfect professional production: 78% of schools
Most successful approach: Distributed responsibility model where multiple departments contribute content within their expertise rather than centralizing all production in admissions offices.
Guide Buy-In and Adoption (cited by 68% of institutions):
Challenge: Student tour guides sometimes view displays as competing with their roles or disrupting established tour rhythms, leading to avoidance or minimal integration.
Solutions implemented by high-adoption programs:
- Include guides in platform planning and content decisions: 76% of schools
- Provide explicit training on display integration techniques: 89% of schools
- Frame displays as tools enhancing guide effectiveness rather than replacements: 94% of schools
- Celebrate guides who use displays effectively as adoption models: 43% of schools
- Collect guide feedback and implement suggested improvements: 71% of schools
Critical insight: Early guide involvement in planning and framing displays as guide support tools rather than substitutes substantially improves adoption rates.
Technology Reliability Concerns (cited by 61% of institutions):
Challenge: Displays malfunctioning during tours create negative impressions, leading some institutions to hesitate implementing technology that might fail at critical moments.
Solutions reducing reliability concerns:
- Select commercial-grade hardware rated for continuous operation: 87% of successful programs
- Implement remote monitoring alerting staff to malfunctions: 64% of successful programs
- Establish clear support escalation processes: 79% of successful programs
- Maintain backup tour routes avoiding non-functional displays: 52% of successful programs
- Work with vendors providing rapid response support: 71% of successful programs
Hardware selection proves critical—commercial displays designed for 24/7 operation demonstrate substantially higher reliability than consumer-grade equipment adapted for institutional use.
Content Freshness Maintenance (cited by 59% of institutions):
Challenge: Keeping content current requires ongoing effort that busy admissions offices struggle to prioritize amid application cycles and event planning.
Solutions maintaining content currency:
- Establish annual content calendars planning updates in advance: 68% of schools
- Assign specific staff responsibility for content management: 74% of schools
- Implement quarterly content review meetings: 56% of schools
- Utilize platform analytics identifying stale content needing refresh: 47% of schools
- Accept that imperfect regular updates exceed perfect but infrequent overhauls: 83% of schools
Successful programs treat content management as ongoing operations rather than one-time projects, building regular update cycles into annual workflows.
Stakeholder Coordination Requirements
Interactive storytelling initiatives require coordination across multiple institutional departments:
Cross-Functional Team Composition: Successful implementations involve representatives from:
Admissions/Enrollment Management (100% of implementations):
- Tour program oversight and guide training
- Content strategy aligned with recruitment priorities
- Visitor experience design and optimization
- Success metric tracking and reporting
Marketing/Communications (76% of implementations):
- Content production expertise and resources
- Brand consistency and visual design standards
- Photography and videography capabilities
- Social media content repurposing
Information Technology (71% of implementations):
- Network infrastructure and connectivity
- Hardware specification and procurement support
- Security and access management
- Technical troubleshooting and support
Alumni Relations/Advancement (54% of implementations):
- Alumni storytelling and outcome content
- Heritage and institutional history materials
- Donor recognition coordination when applicable
- Platform shared use for advancement events
Student Affairs (48% of implementations):
- Student organization and activity content
- Current student participant recruitment
- Campus life storytelling authenticity
- Residence life and student support showcases
Regular coordination meetings (typically monthly during implementation, quarterly during operations) ensure aligned priorities and prevent departmental silos that compromise platform effectiveness.
Technology Platform Selection
Evaluation Criteria and Decision Framework
Institutions selecting interactive storytelling platforms should evaluate options against specific criteria aligned with institutional context:
Content Management Simplicity (ranked highest priority by 84% of institutions):
Admissions staff without technical expertise must update content independently:
- Intuitive content upload and editing interfaces
- No HTML, CSS, or coding knowledge required
- Visual preview ensuring published appearance matches expectations
- Role-based permissions enabling multiple contributor access
- Version control and approval workflows for larger institutions
Platforms requiring IT department intervention for routine content updates create bottlenecks that result in stale content and low utilization.
Multimedia Support (ranked high priority by 79% of institutions):
Effective storytelling requires varied content formats:
- High-quality video hosting and streaming
- Photo gallery and slideshow capabilities
- Audio integration for accessibility or multilingual content
- Document display for detailed program information
- Social media feed integration for current activity
Single-media platforms (text-only or photo-only) limit storytelling richness that differentiates interactive approaches from static signage.
Analytics and Reporting (ranked high priority by 71% of institutions):
Data-driven optimization requires usage insights:
- Interaction volume and frequency metrics
- Content performance comparison revealing engagement patterns
- Dwell time and completion rate tracking
- User navigation path analysis
- Export capabilities for institutional reporting
Platforms without analytics prevent institutions from understanding what content resonates, limiting evidence-based improvement and ROI demonstration to stakeholders.
Cross-Platform Consistency (ranked high priority by 68% of institutions):
Content should work seamlessly across delivery modes:
- Touchscreen displays for campus tour integration
- Mobile-responsive web access for remote prospects
- Desktop web access for detailed exploration
- Content management updating all platforms simultaneously
Separate systems for physical displays versus web platforms create duplication, inconsistency, and elevated maintenance burden.
Integration Capabilities (ranked moderate priority by 54% of institutions):
Connections with existing systems enhance value:
- Admissions CRM integration tracking which prospects interact with displays
- Campus map and wayfinding integration
- Event calendar integration showing current activities
- Alumni database connections for outcome storytelling
- Social media integration extending reach
While integrations provide value, institutions should prioritize core storytelling functionality over complex technical integration that may complicate implementation.
Purpose-Built vs. Generic Platform Approaches
Institutions choose between educational storytelling platforms designed specifically for admissions contexts versus adapting general-purpose content management systems:
Purpose-Built Admissions Storytelling Platforms:
Advantages:
- Pre-configured templates optimized for student/alumni storytelling
- Industry-specific features (tour integration, yield tracking, event modes)
- Simplified administration requiring minimal technical expertise
- Vendor expertise in admissions use cases and best practices
- Typically moderate cost ($4,000-$15,000 annually for most institutions)
Limitations:
- Less customization flexibility than building custom solutions
- May not serve specialized institutional requirements
Best for: Most institutions seeking turnkey implementations with proven admissions-specific functionality
Generic Content Management Systems (WordPress, Drupal, custom development):
Advantages:
- Complete customization control
- Potential cost savings for institutions with existing platforms and technical staff
- Integration with existing institutional technology ecosystems
Limitations:
- Requires substantial technical expertise for implementation and maintenance
- Admissions-specific features require custom development
- Ongoing IT resources needed for updates and troubleshooting
- Total cost often exceeds purpose-built solutions when staff time is valued
Best for: Large institutions with dedicated digital experience teams and complex integration requirements
Survey data reveals that 78% of institutions implementing interactive storytelling choose purpose-built platforms, with generic CMS approaches concentrated among large universities with substantial technical resources.
Solutions like Rocket Alumni Solutions provide comprehensive platforms designed specifically for educational storytelling, combining student and alumni narrative features with interactive display management, mobile access, and integrated content management—delivering admissions-optimized functionality without requiring technical expertise.
Best Practices and Recommendations
Evidence-Based Implementation Guidance
Analysis of successful implementations yields practical recommendations for institutions at various stages:
For Institutions Beginning Interactive Storytelling Initiatives:
Start with Pilot Implementation (3-6 month duration, $6,000-$12,000 budget): Focus on single high-traffic location with diverse content types testing visitor engagement before comprehensive deployment.
Prioritize Student and Alumni Storytelling: Video testimonials and success profiles consistently generate highest engagement and strongest yield rate correlations. Invest content production resources here first.
Involve Tour Guides Early: Include student guides in planning, content selection, and pilot testing. Frame displays as guide tools rather than replacements to secure adoption.
Establish Content Update Workflows: Sustainable operations require regular refresh cycles. Assign specific responsibility and create content calendars before launch to prevent staleness.
Select Appropriate Technology: Match platform complexity to institutional technical capacity. Purpose-built admissions platforms typically deliver better value for most institutions than attempting custom development.
For Institutions with Existing Interactive Storytelling:
Analyze Usage Data: Review platform analytics identifying high-performing and underutilized content. Double down on what works; refresh or remove what doesn’t.
Expand Strategic Locations: Successful pilot installations justify additional touchpoints along tour routes, particularly in climate-controlled gathering spaces.
Implement Mobile Extensions: Web-accessible platforms extend storytelling reach to prospects unable to visit campus and support revisiting content during decision-making.
Integrate Admitted Student Programming: Leverage storytelling platforms during yield events (admitted student days, orientation) maximizing investment value beyond prospective tours.
Measure Yield Impact: Track enrollment outcomes for prospects exposed to interactive storytelling versus those who toured before implementation, demonstrating ROI to institutional stakeholders.
For All Institutions:
Lead with Stories, Not Statistics: Prospective students remember personal narratives far better than institutional facts. Prioritize authentic student and alumni voices.
Update Content Regularly: Quarterly major updates and monthly minor refreshes maintain engagement quality. Stale content undermines technology investment value.
Train Guides Explicitly: Provide specific language and techniques for incorporating displays into tours. Guides need permission and frameworks for interactive pauses.
Make Mobile-Accessible: QR codes or web platforms enable prospects to revisit compelling content later when making decisions weeks after tours.
Evaluate Purpose-Built Solutions: Platforms designed specifically for educational storytelling typically deliver better outcomes than generic CMS platforms requiring extensive customization.
Content Production Recommendations
High-quality storytelling requires authentic, engaging content that budget-conscious institutions can produce without professional production resources:
Video Production Approaches:
Professional Production ($800-$2,500 per video):
- Appropriate for flagship content receiving heavy visibility
- Typically 2-4 professionally-produced videos annually
- Best for alumni success profiles requiring travel or complex production
Semi-Professional Production ($150-$400 per video):
- Institutional marketing staff or student media organizations
- Appropriate for most student testimonials and campus life content
- Balance quality and authenticity with reasonable production values
Smartphone/Consumer Production ($0-$50 per video):
- Student-produced content using smartphones and basic editing
- Highly authentic though sometimes rough production quality
- Appropriate for informal campus life, event coverage, day-in-the-life
Successful programs employ mixed approaches: professional production for cornerstone content, semi-professional for regular storytelling, and consumer-grade for authenticity and volume.
Student Recruitment and Compensation:
Institutions source on-camera students through:
- Tour guide programs: 78% (students already screened for communication skills)
- Student ambassador programs: 64%
- Student organization partnerships: 47%
- Open campus calls for participants: 32%
Compensation approaches:
- Hourly payment ($15-$25/hour): 52%
- Flat video fee ($50-$150 per completed video): 38%
- Volunteer participation (service hours, resume building): 41%
- Course credit through relevant academic programs: 18%
Most effective approach combines paid primary content creators ensuring consistent production with volunteer supplementary content adding volume and variety.
Content Authenticity vs. Perfection Balance:
Survey data reveals prospective students prioritize authenticity over production polish:
- 76% prefer “authentic but imperfect” student testimonials over “polished but scripted” professional productions
- 68% find smartphone-recorded content “more relatable” than professional videography
- 71% value “real student experiences” over “idealized campus portrayals”
These preferences suggest institutions should prioritize genuine student voices over expensive production values, potentially reducing costs while improving engagement quality.
What This Means for Admissions Offices
Strategic Implications for Enrollment Management
This benchmark data reveals several critical implications for admissions leaders:
Interactive Storytelling Delivers Measurable Yield Improvements: With documented yield rate increases of 18-31%, interactive storytelling represents one of few enrollment interventions producing substantial, measurable improvements. Institutions facing enrollment challenges or seeking competitive advantages should prioritize this high-impact strategy.
Implementation Costs Are Lower Than Many Assume: Budget constraints represent the most commonly cited barrier, yet comprehensive implementations typically cost $22,000-$66,000 initially with $9,000-$24,000 annual operations—substantially less than many admissions offices assume. ROI analysis demonstrates that even modest yield improvements justify these investments many times over.
Content Quality Matters More Than Technology Sophistication: Expensive hardware installations with stale content perform worse than modest platforms with authentic, regularly updated storytelling. Institutions should prioritize sustainable content production over technology complexity.
Student and Alumni Voices Outperform Institutional Messaging: Prospective students and families prioritize peer experiences and outcome demonstrations over administrative communications. Admissions offices should shift storytelling emphasis from institutional facts to personal narratives.
Guide Training Determines Adoption Success: Technology alone doesn’t enhance tours—intentional guide integration transforms platforms from unused installations into engagement drivers. Training investments prove as critical as technology investments.
Implementation Priorities by Institution Type
Recommendations vary based on institutional context:
Small Colleges (under 2,000 students):
- Focus: Single strategic display location (admissions lobby or campus center)
- Budget: $8,000-$15,000 initial, $4,000-$7,000 annual
- Content: Primarily student testimonials and alumni outcomes demonstrating personalized experience
- Approach: Leverage student workers for content production minimizing professional production costs
Medium Universities (2,000-10,000 students):
- Focus: 2-4 display locations plus mobile-responsive web platform
- Budget: $18,000-$35,000 initial, $9,000-$16,000 annual
- Content: Balanced portfolio of student stories, alumni success, program highlights, heritage
- Approach: Partner with marketing/communications for content production, establish cross-functional governance
Large Universities (over 10,000 students):
- Focus: Comprehensive installations across multiple tour routes and admitted student spaces
- Budget: $40,000-$80,000 initial, $18,000-$35,000 annual
- Content: Department-specific storytelling tailored to diverse academic interests
- Approach: Implement distributed content contribution model engaging departments and schools
Secondary Schools:
- Focus: Interactive displays serving prospective families during admission visits and open houses
- Budget: $6,000-$18,000 initial, $3,000-$8,000 annual
- Content: Student experience, college placement outcomes, co-curricular achievement, heritage
- Approach: Integrate with existing digital hall of fame or recognition systems serving multiple institutional purposes
Requesting Research Briefing and Implementation Consultation
This report summarizes key findings from comprehensive research on interactive campus storytelling for admissions enhancement. The complete briefing includes:
- Detailed institutional type and selectivity breakdowns for all data points
- Extended case studies from successful implementations
- Technical specification recommendations and vendor evaluation frameworks
- Sample tour integration scripts and guide training materials
- Content production templates and workflow documentation
- ROI calculation tools customized for institutional contexts
- Platform feature comparison matrices
- Implementation timeline and milestone planning tools
Educational institutions interested in the complete research briefing, customized analysis for specific enrollment contexts, or consultation about implementation planning can request a research briefing from the Hall of Fame Wall research team.
Organizations exploring how interactive storytelling might enhance recruitment effectiveness, evaluating technology platform options, or planning comprehensive implementations will find the detailed briefing provides actionable frameworks for strategic decision-making.
Conclusion: Storytelling as Strategic Enrollment Advantage
The data presented in this benchmark report demonstrates both significant opportunity and proven approaches for enhancing admissions effectiveness through interactive campus storytelling. Current implementation rates—only 31% of institutions utilize interactive storytelling despite documented yield improvements of 18-31%—suggest substantial competitive advantage available to early adopters in this still-emerging practice.
Traditional campus tours, while valuable, face inherent limitations in engagement quality, information retention, and differentiation that interactive storytelling systematically addresses. By enabling prospective students to discover authentic peer experiences, explore alumni outcomes demonstrating value, and engage emotionally with institutional heritage, interactive approaches create memorable connections that drive enrollment decisions far more effectively than facilities tours and fact recitation alone.
The schools successfully implementing interactive storytelling share common characteristics regardless of size or budget: they prioritize authentic student and alumni narratives over institutional messaging, integrate technology intentionally into tour experiences rather than treating displays as standalone attractions, maintain content currency through regular update cycles and distributed contribution models, invest in guide training and adoption as heavily as technology infrastructure, and measure outcomes rigorously demonstrating ROI to institutional stakeholders.
For institutions beginning interactive storytelling initiatives, the path forward involves pilot implementations testing engagement before comprehensive deployment, authentic content production emphasizing student and alumni voices, purpose-built platform selection matching institutional technical capacity, strategic placement in high-traffic tour route locations, and explicit guide training integrating displays into tour narratives. For organizations with existing systems, priorities include usage analytics review informing content optimization, expansion to additional strategic locations, mobile platform implementation extending reach, admitted student programming integration maximizing investment value, and yield impact measurement demonstrating enrollment outcomes.
The investment in interactive campus storytelling serves enrollment objectives while providing infrastructure supporting admitted student events, orientation programming, alumni engagement, and institutional communications—positioning storytelling technology as multi-purpose platforms delivering value far beyond admissions tours alone. These diverse applications strengthen ROI justification while creating enterprise-wide stakeholder support for ongoing content production and platform enhancement.
As prospective students and families increasingly expect digital-first, personalized experiences throughout college search processes, institutions providing compelling interactive storytelling during campus visits differentiate themselves competitively while demonstrating commitment to innovation and student experience that influences perception of overall institutional quality. The benchmark data in this report provides context for evaluating current practices, setting realistic goals, allocating appropriate resources, and implementing approaches proven effective across diverse institutional contexts.
See the platform behind the data: Rocket Alumni Solutions provides integrated storytelling and recognition platforms designed specifically for educational institutions, enabling compelling student and alumni narratives, interactive campus displays, and mobile-accessible content—addressing the implementation approaches and best practices documented throughout this research.